
On Saturday, the Storm defeated the Bulldogs 41-10 at Sunshine Coast Stadium. Perusing the stats, I noticed that the Bulldogs actually had more possession in their opponents 20 metre area than the Storm, with 38 play the balls inside 20 compared to Melbourne’s 28. Yet they were outscored by 30 points.
This made me wonder if how strong the connection was with the amount of possessions inside an opponents half with the number of points scored.
To do this we will look at where teams are playing the ball and if that correlates to points being scored. As usual, I’m going with the caveat that I’m using aggregated public data – those with access to the X/Y coordinates for play the balls will have a deeper and more accurate analysis than this. Still it should provide some evidence if there’s a connection or not.
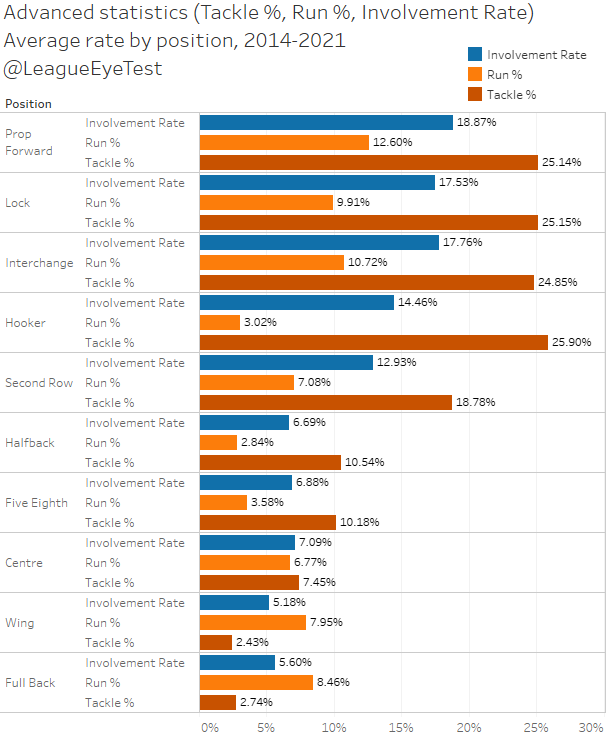
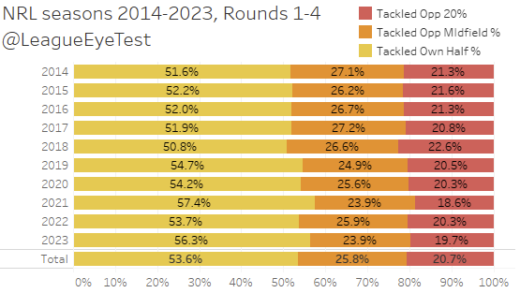
Starting off, let’s have a look at the percentage of where play the balls occur by team.

Since Round 3, Melbourne lead the way with just over half their play the balls occurring in their own half of the field. On the other end of the scale, Brisbane are playing the ball 60% of the time in their own half. Interestingly, the North Queensland Cowboys sit in second place, with just 51% in their own half.
At first that sounds ridiculous, until you realise that Jason Taumalolo is basically a guaranteed 10 metres. The Cowboys lock averages nearly 10 metres every run and 80% of his runs are 8 metres or longer, which is amazing when he is making 20 runs per match. Jordan McLean and Francis Molo are also averaging north of nine metres per carry. It’s more of an indictment of their inability to penetrate defences once they get in their opponents half, which has been a hallmark of Paul Green’s endless telegraphed block play attack. Have fun next season Broncos fans.
But I digress. From the above chart, we can see that the good teams (and the Cowboys) use about 20% of their play the balls inside their opponents 20 metre zone. They also spend about 25%-27% of their play the balls in the opponents “midfield”, from the 20-50m area.
Now if we plot how many times a team has played the ball in each “area” we can see if there’s what sort of correlation there is with points scored. The shading of the data points indicates the final margin of a game, ranging from losing (red) to winning (green) with the darker colour indicating a larger margin.
First let’s look at points versus possession inside an opponent’s half.

There’s a very slight upwards correlation so far in 2020, with a few outliers. The Roosters 59 points scored against Brisbane in Round 4 came from 100 tackles inside their opponents half, while the Sharks put 56 on the Knights from just 60 tackles inside their half. The Cowboys have had the most tackles inside an opponent’s half this season, with 108 resulting in 36 points against the Titans in Round three.
What about the opponents midfield (between 20m and 50m) then?

Again, it is a similar level of correlation – low. Canterbury showed you don’t need a lot of field position to eek out a win. In Round 5, they were tackled just 22 times inside the Knights midfield area, but still managed to squeeze out a six-point victory, winning 18-12.
Then surely if you have a high volume of play the balls inside an opponent’s 20 metre zone, you’d be more likely to score points?

Funnily enough, the correlation is again very low, but still positive. If you know what an R Squared value is in a regression (how strong the correlation is), the value for the above plot is just 0.0264. When you look at the individual games you can see why the correlation is so low – when the Roosters beat Canterbury in Round 5, they scored 42 points from just 16 play the ball inside the Bulldogs 20 metre zone.
As the above charts are just from 2020, does the trend change if you look at the last 6 seasons? The answer is no, it’s a similar trend and you can check the data plots in the gallery below. There’s a very slight positive correlation. Once again, it’s not just having possession it’s what you do with it.


So, does field position correlate with scoring points? The conclusion would be obviously yes but not to the extent you’d expect. Which makes sense in that you can score from anywhere on the field, and attacking kicks are often set up closer to or outside the 20-metre line than the goal line. I’d imagine the X/Y coordinates from where tries scored would tell an interesting tale.
Set restart update
With so many new readers to the site I thought I’d post an update on the set restart analysis I’ve been doing this season.
About a month ago I made a post looking at set restart differential (set restarts awarded minus set restarts conceded), to see if there were any trends coming out of the new NRL rule change. This was borne from observations during games that teams higher up the ladder seemed to be conceding more set restarts in their opponents halves, and early on tackle counts.
Randomly, I had a look at the correlation between set restarts and margin and noticed after Round 8 it turned negative. This meant that the larger the gap between set restarts conceded and awarded, the larger your margin of victory was likely to be. This made no sense since net penalties still had a positive correlation with margin, and possession is usually valued so highly by coaches.
All of this led to the below chart plotting net set restarts against net margin by team, to see if there was a reason why the trend was negative. Here’s how things looked after Round 9:

As the chart shows, at that time it turned out at the time that the top four teams all had a negative set restart differential, and some of the highest net margins as well. Penrith in particular had huge negative differential, more than the other top four teams combined.
Fast forward to Round 13 and we can have a look at how things have changed. I’ve also fixed up some team colours to make it a little clearer.

We still have three of the top four sides sitting in the top left quadrant, although the Roosters are only sitting at a -4 differential. Penrith and Melbourne are sporting double figure set restart differentials.
But the disparity between the top four sides and the rest of the competition has shrunk. Parramatta has drifted further to the right, although this may be due to missing some key players during this period (Mitch Moses and Ryan Matterson) leading to some close games.
Does this mean teams are no longer strategically giving away set restarts? That is unlikely, the answer probably lies with two things. The first is small sample sizes, with only six games (incidences) per team, which could partly account for Penrith being -23 after six games but +9 in their last four. It’s unlikely be the sole cause of it, as other clubs haven’t seen such a dramatic swing in such a short period of time.
The other reason could be the inconsistent awarding of set restarts, which is a touchy subject this week.
I’m usually in the camp that believes NRL referees deserve a lot more credit than the deserve. The first few rounds of captains challenges proved that. But there’s something a bit off with the application of set restarts across the refereeing ranks in certain games.
Last weekend we saw Ben Cummins call five set restarts in the first half, and only one in the second half. Ashley Klein and Chris Sutton also only called one each in the second half of their games as well. No coincidence that this was the lowest number of set restarts awarded since the introduction of V’Landysball when the season resumed in Round 3, as shown in the next chart.

The biggest discrepancy in set restarts by half came In Round 10, when Grant Atkins presided over the Newcastle v South Sydney game on a Saturday evening. The Knights led 14-0 at half time leading the set restart count 5-4. The second half finished with Newcastle winning 20-18, and the set restart count was still 5-4. There were three penalties blown in each half 3-0 Souths in the first, 2-1 Newcastle in the second.
Are we supposed to believe that after nine ruck infringements in the first half of that game, and a similar number of penalties awarded, that players all behaved within the rules around the ruck and there was no need to award a set restart in the second half despite the onset of fatigue? This wasn’t the only time there have been zero set restarts in the second half, there have been six instances of it happening since Round 3 and the average set restarts give in the first half of those games is five.
Again, it appears from using the Eye Test™ that encroachments in the ruck that resulted in a set restart in the first half are not being awarded in the second half. Whether it is a conscious or unconscious decision, the enforcement of ruck infringements seems to differ by half. There have been on average 4.0 set restarts awarded in the first half, and 2.7 in the second half.
If anything, you would possibly expect more set restarts in the second half due to fatigue. Yet as you can see below, we had the lowest number of set restarts this season, with just 17 in the second half across all eight games.

This does follow a trend with usually fewer penalties blown in a second half. In the six seasons prior to 2020, there were 7.7 penalties awarded in the first and 6.0 in second period. It’s not a like for like comparison, but since 2014 there has been just one half of football where not a single penalty was given, which was Round 4 2017, which was after six in the first half.
That is just one half of rugby league in over a thousand games in six seasons. This season, we’ve now seen six instances of multiple set restarts awarded in the first half of games with zero in the second half. Are players these days such quick learners that they are abiding by the new rules after the half time break?
As stated above, I’m usually on the side of the referees and largely think they do a fantastic job. And unlike coaches I’m not insinuating there’s any nefarious reasons behind a perceived lack of consistency. Just that it exists. Maybe in a game where there’s a 20-point lead with 10 minutes to go they just want to have a warm shower? I couldn’t blame them for that in the middle of winter.
Is Nathan Brown the answer for the Warriors?
Things change quickly in a week in rugby league, with Nathan Brown emerging late in the week as the likely head coach for the New Zealand Warriors in 2021. His announcement came on Saturday, less than 24 hours after an emotional win against Manly.
You can argue if the Warriors needed a full rebuild in the way Newcastle did in the mid-2010s, but unfortunately the die has been cast and that’s the direction they’ve taken. Brown does have experience with rebuilds but how long did it take him to turn the Knights around?
The below chart is coaching seasons from 2014-2020, with average metres per game plotted against average margin since more run metres usually correlates well with winning. The shading of the data points indicates points scored per game, going from low (red) to high (green).

In the four years at Newcastle, not once did the Knights pass 1350 metres gained on average for a season. Their best average margin was -1.2 in 2019. Part of this is the playing list Brown inherited, which was constricted by salary cap issues. However, four years is an eternity in rugby league, and during that time Brown improved the team from historically bad to just competitively bad.
You can see that from above, Kearney wasn’t performing nearly as bad as brown was, even if things weren’t moving in the right direction. And from all accounts the players loved him. There were certainly other coaches with better records available (Geoff Toovey always seemed to be mentioned), but with the rebuild decided upon Brown ended up top of the list.
There’s a good chance that Todd Payten saw the writing on the wall and Gould is setting things up for the next coach after Brown. It’s unlikely Gould is going to give Brown the same time he had in Newcastle, but at least the Warriors have a direction for now. And don’t even get me started on the possibility of signing Jack De Belin.
What are the Bulldogs getting with Nick Cotric?
The Canterbury recently luring Nick Cotric away from the nations capital, I thought I’d have a look at how he stacked up to some other outside backs to see if the Bulldogs made the right choice.
To do so, let’s look at some radar charts of outside backs this season across a number of stats that I’ve deemed representative of performance for those positions – runs, run metres, metres per run, tries, try assists, line breaks, line break assists, tackle busts, one pass runs and causes of line breaks and tries (added together).
As a reminder, the closer to the edge of the radar the better. This goes for negative stats too – the closer to the edge for Try and Line Break Causes means a player ranks highly and rarely concedes them. Someone sitting closer to 0% would be giving them up regularly, as is the case with many Brisbane players this season.
One issue using percentiles with backs is that there’s not many degrees of separation for some statistics like tries and line breaks, even on a per game basis. You end up with players bunched together, for example those with one try. Still, it gives us something to work with and there’s no reason to make perfect the enemy of good.
Let’s compare Cotric to one of the best performing outside backs (centeres, wings and fullbacks) statistically this season.

David Nofoaluma has set the bar for most of the 2020 season for outside backs, and this chart shows why. He sits in the 98th percentile for tackle busts among all outside backs, 96th for run metres , 95th for runs and 89th for tries and line breaks.
Not the best fit for Cotric unfortunately. What about the seasons equal leading try scorer, Sione Katoa from Cronulla?

A little closer, but it highlights an issue with Cotric is that he’s not really elite at anything other than busting tackles. He breaks tackles at an elite level (95th percentile), but he sits in the bottom three quarters of players for every other statistic on the above radar chart. Most concerning is that he sits at the 41st percentile for runs made and low 50s for run metres and metres per run, meaning that around half of all outside backs run the ball more often than he does and with more impact.
All this shows that whilst he can bust a tackle better than almost anyone in the NRL, he’s not getting the ball or doing enough with it to make any impact, which seems to be a theme for the Raiders outside backs this season. That might be a factor of his inside players not speading the ball to the edges regularly, and might be different with a change of scenery or new coach.
The question then is, who does Cotric compare to? The concerning thing is that his profile sits closer to 34-year-old Bryson Goodwin’s five games for Cronulla this season than any of this season’s top tier outside backs.

Is that worth $650k? It might be to the Bulldogs, who do need some firepower in their backline. But it shows that the level of output from Cotric currently isn’t in the top tier of backs and isn’t matching the dollars the Bulldogs are offering. That isn’t to say he couldn’t become an impact player at Canterbury, but it is a gamble to overpay on the chance he does.
Sometimes to attract top talent you need to overpay. It’s a double-edged sword though, as overpaying for marginal talent can put you in a situation where you can’t bid for the truly transcendent players when they come off contract.
This isn’t to say that Cotric doesn’t deserve every cent he’s getting – he’s a quality first grade player and if anything, all NRL players are underpaid and deserve more. But from a purely salary cap management perspective, the Dogs may have been able to get similar output for less. And it doesn’t fill their biggest needs at half and hooker.

Fantastic analysis