In last weeks’ post, I proposed a theory that NRL teams this season were changing their tactics from using weighted kicks to look for repeat sets to more attacking kicks aimed outside the try line. The first reason was to take advantage of the new rules protecting attacking players in the air. The second was to reduce the number of seven tackle sets from kicks going dead in goal.
This week, I wanted to see if there were any teams driving this change. Turns out there are, and it’s mostly who you would expect but not necessarily how you’d expect it.
As mentioned last week with the increase in time in play there should be more “stuff” being done – after Round 14, time in play was up over 8%, runs and tries are up nearly 10%, line breaks up 7% and kicks are up over 7%. But weighted kicks were down 20%.
To find out who is causing this change, first let’s look at the percentage change in total kicks and total sets. That way we can see who is kicking more purely from having more possession due to rule changes introduced in Round 3.
Below is the percentage change for total kicks and total sets for all teams from Rounds 1-15, 2019 to 2020 (excluding Round 12, which was a condensed round in 2019 due to representative gams and had just four matches). The colour of each data point ranks each team for the volume of total kicks (dark red = 16th, dark green = 1st with lighter shades in between).

There are a few things that stand out initially from this. Every team in the league, except for the Gold Coast and Brisbane, has seen an increase in total sets this year of at least 4%. Penrith (it’s always Penrith) are leading the way with the most kicks this season, thanks to a 15% increase in possession resulting in 27% more total kicks. Parramatta have seen a similar amount of possession increase but only an 18% increase in kicks, indicating they’re running the ball a little more than the Panthers, who are favouring kicks more to end their sets. Soemthing that confirms the Eye Testtm with the Panthers.
There are a few teams though with a decline in total kicks despite an increase in possession, such as the Melbourne Storm, who have 5% fewer kicks despite an 8% increase in total sets. We’ll get to them in a minute.
One thing to remember is that we’re dealing with percentage change here, so higher percentages do not necessarily equate to high volumes. There are also lower volumes of weighted kicks for individual teams, but given the game sample size I’m not concerned about it as I would be after 6 or 7 games. Also, with the increase in ball in play time of about 8% and 5% increase in runs as noted last week, anything lower than that is technically a decline.
Next, we’ll look at the year on year change in total sets against the change in attacking kicks. It’s similar to the previous chart but the gaps are a little smaller at the top end of the scale.

At the pointy end, the numbers for Penrith are almost identical – an increase of 14% in total sets and 28% in attacking kicks, in case you want to know what is driving their offense this season. Parramatta are much closer to the Panthers in their increase in attacking kicks, up 25% on last season.
And if you wanted another indication of why the Broncos attack is so putrid, they have a decrease in total sets of 7%, but a decrease in attacking kicks of 20%.
Now if we look at the percentage change of weighted kicks against total sets, which as I mentioned before is down 20%.

Here’s where things get interesting. There has only been one team with an increase in weighted kicks this season – New Zealand (+10%) – although the Tigers were in the positives last week. Their bases are low enough however that you could argue they’ve at best stayed steady in weighted kicks but increased other kick types.
For the Warriors, even with an increase in attacking kicks they’re still under indexing on weighted ones as their total kicks are up by 13%. And their weighted kick increase of 12% is actually just two kicks in volume – they’ve gone from 20 to 22 since they don’t kick the ball as often as other clubs. One of the perils of drilling down to lower levels of data.
The far bigger story is the significant decline in weighted kicks by two teams – Melbourne and the Sydney Roosters – who have attempted 50% fewer weighted kicks than last season. If those teams taking half as many weighted kicks isn’t an indication of a massive change in tactics then I don’t know what more proof you’d need. The sharp drop in change for those clubs would lead me to believe someone has been doing some expected points analysis on certain kick types and found that attacking kicks yield a better result than weighted ones.
Melbourne’s 50% decline in weighted kicks is a drop from 58 to 28, which on a per game basis is a drop from over 4 per game to under 2. That is 30 fewer weighted kicks in over half the season. It’s a huge swing even if you consider that their total kicks are down 5%. I initially thought that they may have had small decline that increased whilst Cameron Smith was injured, but the decline was similar before he hurt his shoulder in Round 12.
The Roosters are another interesting case. Their overall increase in kicks is just 2.6%. What makes them more intriguing is that unlike Melbourne, their 56% decline in weighted kicks looks like 25 to just 11 in volume. That 11 is by far the lowest in the NRL, indicating they may have been ahead of the game by not having as many last season. On a per game basis they’ve’ from kicking around 1.5 weighted kicks per game now down to less than 1. It’s barely a part of their attack now, and when you have weapons like James Tedesco, Brett Morris, Angus Crichton and Daniel Tupou that makes sense.
It’s not just those two teams, even St George Illawarra are kicking 47% fewer weighted kicks. This is a case where execution can’t be captured by statistics, as they’re clearly not travelling as well as the Storm or Roosters even if they have improved of late. It seems everyone is getting in on it as the Titans are down 39% on weighted kicks this season, from 36 to 22.
Now to tie everything together and support my crackpot theory, here is the change in attacking kicks plotted against the change in weighted kicks. Again, colour indicates the ranking of teams by total kicks (dark red = 16th, dark green = 1st and shades in between). I’ve also added a size indicator for the volume of weighted kicks taken to help visualise whether or not the change from last year matters.

Penrith, who had a 28% increase in attacking kicks, are kicking 14% fewer weighted kicks, and Parramatta who had 25% more attacking kicks have 18% fewer weighted kicks. Melbourne and the Roosters both have significant drops in weighted kicks but more muted increases for attacking kicks of 3% and 8% respectively. When you consider that they did not have large increases in total kicks, and the Roosters already take the fewest weighted kicks in the NRL, that makes sense.
Most of the top eight sits in the bottom right quadrant where you have an increase in attacking kicks but a decrease in weighted kicks. South Sydney (Wayne always likes to be different) are the lone outlier sitting firmly in the bottom left quadrant, as Cronulla sits very close to the right side with just a 1% drop in attacking kicks. Again, the Sharks have an increase in kicks of less than 1% so that change isn’t a huge concern.
And there’s your confirmation of a change in kicking tactics not just on an overall basis but led by some of the higher performing teams in the league. This is most likely due to the rule changes this season and coaches trying to reduce the incidence of seven tackle sets as discussed at length last week.
Those teams having very a successful 2020 – such as Penrith and Parramatta – are seeing a huge increase in kicks, both total and attacking, and outpacing their increase in possession. Other top four sides like Melbourne and the Roosters have dramatically changed their kicking profiles this season, eschewing weighted kicks in favour of attacking ones or running the ball more frequently close to the line. But as I mentioned last week, you’ll only hear how one referee and set restarts, not strategic kicking, are changing the game this year.
Why volume statistics aren’t always your friend
This week should have been a fantastic matchup of halves, with Shaun Johnson of the Sharks facing up against the Panthers and Nathan Cleary. Cleary has been one of the standouts this season, whilst Johnson is having a great season, but you wouldn’t necessarily know it from the way he’s often covered by the mainstream media. I’d pointed it out previously with a radar chart comparison in early August:
Johnson ended up missing the game due to some minor injuries and the birth of his child (congratulations Shaun!) and Cleary had another strong showing. Despite this we can still have a look at their statistical output for the season and use it as a test case for counting stats and raw volume statistics not telling the full story.
If you’ve been following for me for any length of time you know that I’ve put together some advanced statistics for rugby league, as using raw numbers mean players who spend the whole 80 minutes on the field usually dominate. If you’ve not read them, I’d recommend checking out my articles on Run %, Tackle % and Involvement Rate on the website, as they’re all incredibly useful in identifying high
But back to the topic at hand. It’s lazy analysis to only use counting stats without context but is more palatable to the wider viewing audience so I’m not going to deride them for dishing up what the consumer wants and easier to digest in small doses.
Comparison of raw numbers – Cleary seems ahead. More passes, more runs, more kicks, more attacking kicks, more tries, more try contributions, more line breaks and more line engagements. Johnson is only ahead in try assists (20 to 14) and weighted kicks (17 to 10).
Per game stats will give a slightly better comparison, although it paints a better picture for Cleary who has only played 12 games compared to Johnson’s 14.
When players are compared on the usual pregame shows, it’s assumed that all players in a certain position play a similar game or similar role within a team, leading to scorching hot takes like this on social media from mid-June:
And if you look at the raw volume or counting statistics at that time without any context you’d probably agree – Johnson isn’t impacting the game as much as Cleary is.
But there’s one variable that’s not usually discussed (although the wonderful Jason Oliver pointed it out in his Round 15 preview on SportsTechDaily, another must read each week), is possessions. The amount of times a player gets his hands on the ball plays a massive part in his statistical output. The basketball adage of “you can’t rebound the ball out of the basket” can be applied here with a twist, you can’t do more in attack in rugby league without the ball in your hands.
For the season Cleary has 964 possessions, compared to just 733 for Johnson, a difference of 231 possessions. On a per game basis, that’s roughly 73 possessions for Cleary and 52 for Johnson. Cleary has his hands on the ball nearly 30% more than Johnson on a per game basis.
Knowing this, what if we looked at the same statistics again for Cleary and Johnson on a per possession basis. Would it show anything?
Not initially, as those numbers are essentially meaningless – 0.016 line break assists or 0.187 line breaks per possession isn’t really meaningful. You can’t create 20% of a line break.
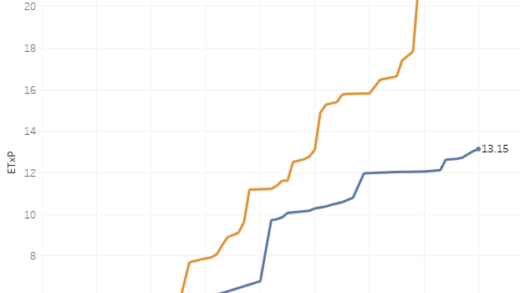
Instead we’ll normalise it to take out any bias that having more possesions per game creates. I’m going to pick a set number of possessions in between both players to even things out. The number doesn’t matter so much as long as we use the same number for both, and for this exercise I’m going to use 60 per game, since it’s a nice round number that falls between both Cleary and Johnson’s season average.
Now we can see that they’re not performing that differently. Cleary has an edge with kicking, especially long kicks, whilst Johnson leads on weighted kicks and try assists. Yet for all the calls that Johnson needs to run the ball more, his runs, passes and line engagements are very similar to Cleary’s. Does he really need to “do more”?
That leads into the other part of player this analysis their positioning and their role. As mentioned above it’s assumed that all #6s and all #7s should play identically but this is rarely the case.
This was shown in a great article by Jack Snape from the ABC showing the locations NRL halves are receiving the ball. If you apply the Eye Testtm during Sharks games you’d know that Johnson sticks primarily to the right side of the field, while Cleary tends to operate on both sides. The above article shows this, with the locations of Cleary’s touches coming evenly across the field whilst Johnson’s are mostly on the right. You could then argue that if Johnson had a similar level of freedom as Cleary, he would probably increase his raw statistics.
The other part of the role is not just what side they’re playing on but how often they’re involved and relied upon for their team. Cleary takes about 16% of the Panthers total possessions, makes 36% of their passes, 75% of their kicks, 66% of attacking kicks and 44% of line engagements. Johnson on the other hand, takes 12.6% of Sharks possessions, 29% of their kicks, only 52% of their kicks and 45% of attacking kicks.
This again ties back to role. Similar to a sport like Formula One, the Panthers play with a clearly defined lead half in Cleary, with Jarome Luai supporting him. The Sharks more often than not play with their halves on a closer to equal footing, a 1a/1b type scenario, with each either sticking to their side of the field or sharing in the playmaking duties.
Asking Johnson to “do more” or run the ball more won’t necessarily help his game. More stuff isn’t always better. Johnson will turn 30 in a few weeks and it could be that he doesn’t have the same explosiveness and has developed more as a player is now picking his spots and interjecting himself at the right time. Just because he’s not shredding teams anymore with one of his explosive runs and making defenders look as if their feet are stuck in cement doesn’t mean he’s not impacting games.
Whatever the reason, the outcome of this specific comparison of Cleary and Johnson is that they’re both having amazing seasons for their team, and the difference in their statistical output is simply down to the role they play for their side, which can be accounted for by looking at a per possession basis.
Claiming one is better based on one number or a group of counting statistics won’t prove anything other than teams and players are different and may play different styles. Hopefully we’ll see some more analysis based on possessions than just counting stats moving forward.
Opponent play the ball location analysis
A few weeks back I had posted a chart showing the percentage of play the balls each team has in their own half, opponents midfield (20-50 metre area) and inside the opponents 20 metre zone. If you didn’t see it, here’s an update after Round 15, sorted by percentage of play the balls in a teams own half.

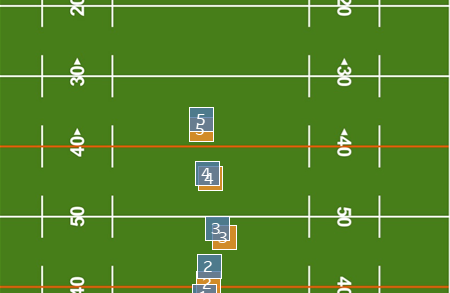
The Panthers are still dominating here, with nearly a quarter of their play the balls inside their opponents 20 metre zone. The Cowboys are still sitting in the top half of the league for play the balls in an opponents half, a testament to Jason Taumalolo’s ability to make lengthy runs (discussed last week), and also to their inability to do anything with the ball once they get there.
The biggest change would be the Roosters, who now sit in the bottom half of the NRL for play the balls in their opponents half since Round 3, although the Titans have improved with the ball, also sitting mid table now.
I’ve had a few requests to look at it from the other side of the ball, showing where their opponents are playing the ball to see if it was the inverse of their own play the balls. Below is the distribution of play the ball by opponent after Round 15, sorted by the percentage of play the balls spent in their own half.

It’s not an exact mirroring of the above chart, but there’s some similar trends. The Panthers are having a lot of success this season with field position, holding opponents to their own half in nearly 59% of play the balls. Combined with a very low percentage of play the balls inside their own 20 metre area, it shows the Panthers have been succeeding at maintaining excellent field position all season. Souths are the only team ahead of them, with 59% of play the balls in their opponents half on the back of some big wins recently.
The Roosters sitting mid table is a refelction of their struggles of late, and also of their confidence in defending their own line, as they sport a higher percentage of play the balls in their own 20 metre zone than the rest of the top eight.
The middle of the field grind that Canterbury likes to get into is evident as well, having one of the lowest percentages of play the balls inside their own 20 metre zone, but one of the highest in the opponents midfield at 27.3%. The Gold Coast keep opponents in their own half less than 50% of the time, the worst in the league but not far ahead of a faltering Manly.
Error rate Round 15 update
Finally, this week an update on the error rate leaders for the 2020 season. If you’ve not seen a post on error rate before, it can be summed up as how often a player commits an error, as shown by the number of possessions. The average NRL player commits an error approximately every 37 possessions, although that varies wildly by position.
Here’s the leader board (if you can call it that) for the 2020 season after Round 15.
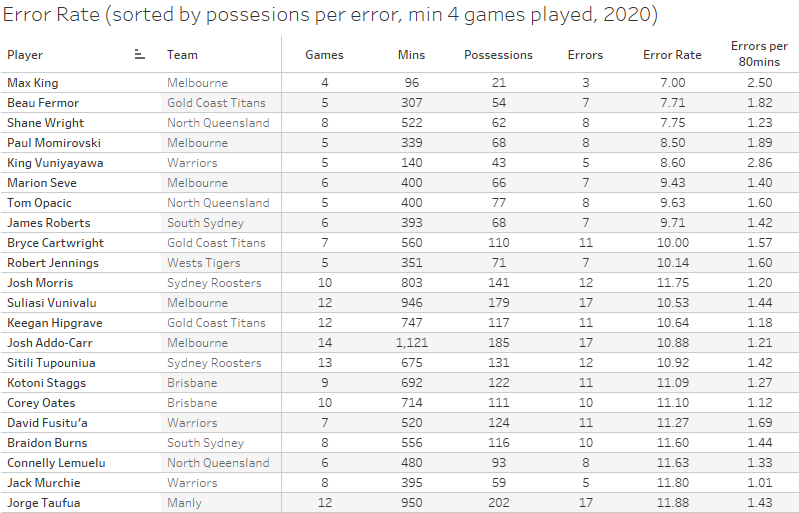
There are eight players who are committing an error before they’ve had 10 possessions. Some of them are low minute interchange players – Max King, Beau Fermor, and Shane Wright. King has been the worst offender this season with three errors in his 21 possessions, and it’s probably no coincidence that we haven’t seen him line up for Melbourne since Round 4.
More concerning for Craig Bellamy is some of his centres and wings showing up this high. Three of those eight players play for the Storm. Suliasi Vunivalu is probably the worst of them and sits just outside the top ten with 17 errors at a rate of one every 10.5 possessions. No wonder Melbourne were happy to let him go to rugby union for a reported $800k per season. Paul Momrovski and Marion Seve aren’t much better with error rates of 8.5 and 9.4, but both have played half as many minutes as Vunivalu.
In fact, there are 21 players with 17 or more errors this season, and Vunivalu is one of only two of them with fewer than 200 possessions. The other is his opposite winger, Josh Addo-Carr who has had 17 errors for an error rate of 10.9. No wonder Bellamy reacts the way he does in the coaches box during games.
I’d also like to give a shoutout to Blayke Brailey, possibly the safest set of hands in the competition. The Sharks hooker has handled the ball well over 1500 times, committing just one error. The next closest is Jake Turpin with one error in 474 possession, although Tom Starling has yet to commit an error in 448 possessions so far for the Raiders, so he’s technically in second place.
Brailey’s error rate of 1,526 is over 3 times that of Turpin’s. As you can see though, the error rate for a hooker is significantly lower than most positions due to the amount of times they handle the ball.
If you enjoyed this post please consider supporting The Rugby League Eye Test through one of the links below.
Scan the QR code or copy the address below into your wallet to send some Bitcoin to support the site Scan the QR code or copy the address below into your wallet to send some Ethereum to support the site Scan the QR code or copy the address below into your wallet to send some Litecoin to support the site Scan the QR code or copy the address below into your wallet to send some Bitcoin cash to support the site Select a wallet to accept donation in ETH BNB BUSD etc.. Donate To Address
 Donate Via Wallets Bitcoin
 Ethereum
 Litecoin
 Bitcoin cash
Support The Rugby League Eye Test
Support The Rugby League Eye Test
Support The Rugby League Eye Test
Support The Rugby League Eye Test
Donate Via Wallets