The Tigers soft middle exposed again
Benji Marshall and Luke Brooks copped a lot of flak on the weekend as the Tigers capitulated 30-6 to the Panthers after starting the game so promisingly. Did they deserve it?
Probably not, and for reasons that are well known among Tigers fans.
Despite showing some early fire, their forwards were steamrolled by the Panthers pack and couldn’t return serve, with not a single Tigers forward picking up more than 100 metres. Not having Josh Aloiai available definitely hurt the Tigers (see below), but it’s not the first time the lack of metres from their forwards has been an issue. Wests are an interesting case in analysing metres. Clear The Obstruction looked into this in early July, and found the Tigers generate below average post contact metres per run.
It’s something that hasn’t changed since then and has only gotten worse. If you look at the split of pre and post contact run metres by Tigers forwards and interchange players this season, they have the third lowest amount of post contact metres, only ahead of the Bulldogs and Titans.
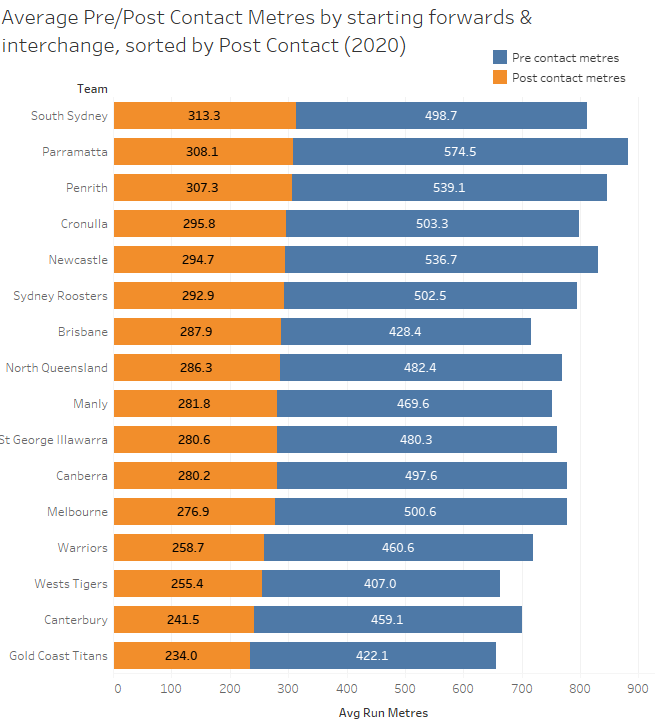
Their pre-contact metres from starting forwards and interchange are even worse, by far the lowest in the league, at just 407 metres per game. And when you add them both together, you get the second fewest total metres by forwards and interchange players in the NRL, only ahead of the Titans. Not only do they not hit the line hard, they don’t push through contact, as Clear The Obstruction pointed out above. Hardly a platform for success for your halves.
Their highest profile forward, Alex Twal, is basically a tacklebot. Here’s his radar chart comparison with Payne Haas, based on per game averages.
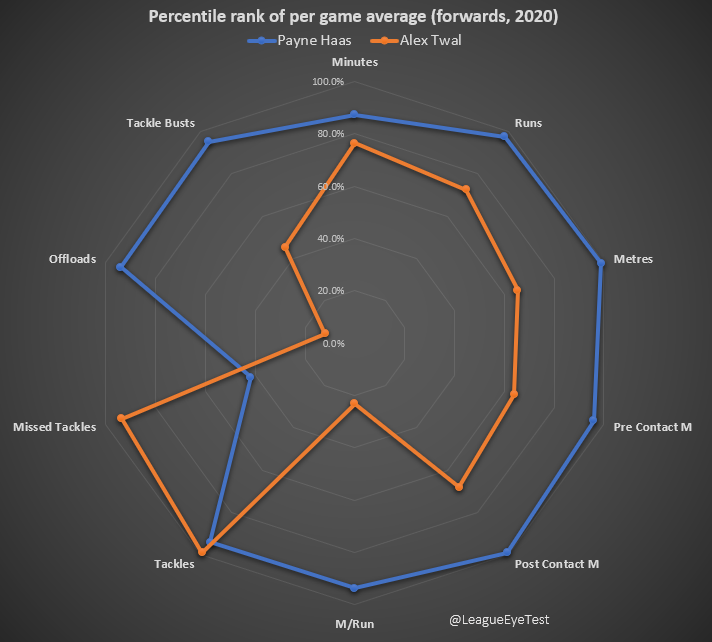
He’s in the 99th percentile of all forwards for tackles made, and 94th for missed tackles (higher is good here), which are elite numbers. Yet he’s in the 72nd percentile for runs, 68th for post contact metres, mid 60s for total metres and 23rd percentile for metres per run. That’s right, 77% of NRL forwards have a better metre per run average than Twal.
Aloiai is probably the closest thing to an “elite” forward the Tigers have, given that he sits in the 90th percentiles for metres and pre contact metres, 88th for runs and 86th for post contact metres. Yet he only sits in the 67th percentile for metres per run, meaning there’s 33% of NRL forwards who have a higher average metres per run than the highest ranking Tigers forward. It’s no wonder they’ve consistently struggled through the middle of the field.

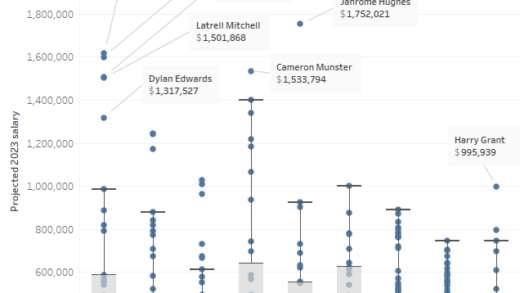
That metres per run trend is the issue here – no other than Aloiai and Thomas Mikaele (also 67th percentile, see below), there isn’t a Tigers forward who is higher than the 63rd percentile in average metres per run.
Mikaele sits in the 37th percentile for minutes anyway, so whilst he can push the ball a little further than his teammates, he’s not on the field often enough for it to make a difference.

Even the Broncos who have some serious issues have two forwards above the 90th percentile for metres (Payne Haas and Patrick Carrigan), and two more just under it (Tevita Pangai and David Fifita). Again, the Tigers don’t have anyone who can consistently gain ground up the middle, let alone exploit a weak defensive edge like Pangai or Fifita can.
As noted with Mikaele, it is compounded don’t get enough contribution from their bench either. The length of each bar represents total metres, which is why some of the percentages look odd compared to the size of the bar.
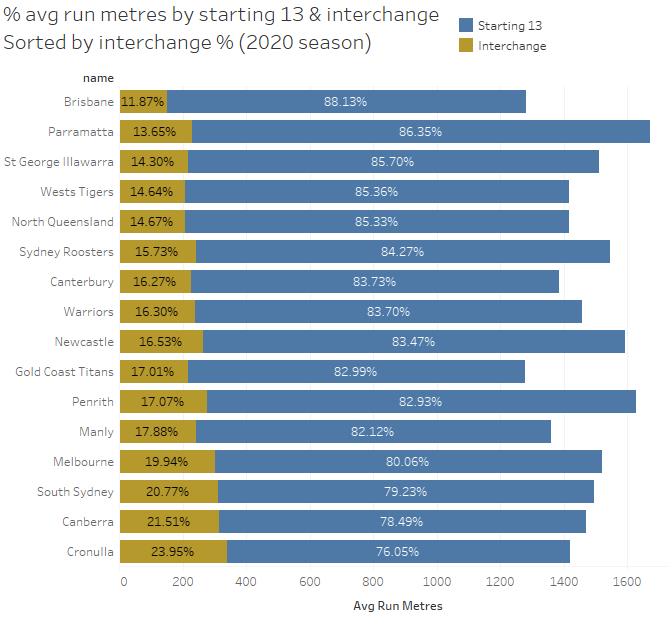
The Tigers have the fourth lowest percentage of run metres from their interchange players, at just 14.64%. To use some common rugby league speak, statistically they’re a bunch of plodders.
It’s far too easy to blame Brooks and Marshall for the Tigers failings when a half has no momentum or created space to work behind. Especially Marshall, who has been very handy when the Tigers have had an opportunity to move the ball and look to create something. Their back three generate a massive amount of their early metres, but the forwards don’t back it up. Almost any half in the NRL would struggle to initiate any meaningful attack behind these sort of numbers and it needs to be the priority of the Tigers recruitment moving forward.
Missing: set restarts in the second half
As regular readers know, I’ve been keeping an eye on set restarts this season and the trends associated with them. Recently I’d posted on twitter that there’s been a significant increase in second halves with zero set restarts, and we had another on the weekend thanks to Chris Sutton in the Cronulla/North Queensland game. Here’s the full list

That brings us to ten so far since Round 3, and it’s something that has only become a trend of late with just three of those halves occuring before Round 10, and seven in the last seven rounds. As I mentioned in a previous post, there has been just one half since 2014 where there was zero penalties given. Again, I find it hard to believe that teams are consistently playing within the rules during the second half, especially with the onset of fatigue.
Here’s how penalties and set restarts per half look by average since 2014.

Focusing on 2020, there’s about 0.5 fewer penalties blown in second halves of games, yet over 1 fewer set restart. Historically, we’ve seen it about about 1 penalty per half difference, save for the 2018 #refsfault penaltython.
Here’s how each referee stacks up by half in 2020.

The king of set restarts Adam Gee stands out here, who has never met a ruck infringement he hasn’t wanted to call for a set restart. Gee is calling 6.6 restarst in the first, but only 3.6 in the second half. That’s a difference of three full set restarts. Everyone’s favourite referee Henry Perenara has the next largest discrepancy with a difference 2 full set retarts between first and second halves. A number of other referees have at least one full set restart fewer called in the second half. Ben Cummins has less than 1 set restart difference, but he calls the least amount in the NRL so he’s working off a smaller base.
One follower on twitter suggested it was because referees are taught in juniors to get things under control early. I agree with this, some referees are definitely putting their stamp on the game early and players are adjusting. Gee during the Roosters/Broncos game on Friday night was a great example of this.
Even accounting for that, I find it hard to believe there isn’t a single ruck infringement that isn’t worth calling in the second half of those games. Penalties are still being called a similar rate in second halves. Surely there should be some consistency?
And that doesn’t even cover the “managing” of penalty counts. Here’s how the set restart count ended up in that Roosters/Broncos game.
And two of those restarts to the Broncos came in the final minutes when everyone just wanted to hit the showers.
I have no issues with how and when penalties are called currently, it’s mostly consistent. I’m not going to take the mainstream media approach and call the inconsistent application of set restarts “the biggest blight on the game”, but I would like to see some more consistency of application across halves.
How does ladder position or ladder difference influence points scored during a match?
Round 16 had two lopsided scores to open the round, but the difference in ladder position was quite stark. Parramatta (3rd) played Souths (7th) on Thursday whilst the Roosters (4th) faced the Broncos (15th). Both games resulted in one sided contests that were largely over by half time.
Those results raised the question, does the difference in ladder position actually make a difference in points scored or the final margin? Logically you’d think that as the ladder gap between two teams increased, you’d see more points being scored. So, let’s have a look at the average points scored in a game by both teams, split by the difference in ladder position. The thickness of the line indicates how many times that ladder difference has occurred.

It turns out the that scoring actually goes down as ladder difference increases and the interesting this is just how little variance there is. If it looks bigger it’s because I’ve shrunk the scale down to exaggerate the difference. There is a slight decline as ladder difference increases, from 40.3 points per game to 38.8ppg, although we’re getting down to small sample sizes with only 10 instances of 1 v 16 since 2014.
This would indicate that evenly matched teams score slightly more points in a game. But only slightly, as the average per game is 40.7 points per game, meaning the biggest variances are around 5%. The reason for is that as you would expect, in games with a high ladder difference, the team higher on the ladder is scoring more points and the lower team fewer, whilst evenly matched teams both tend to score points.
Is it any different if you split the data by half?

The intriguing thing here is that there is the tiniest correlation to more points being scored as ladder difference increases. Again nothing significant as most variances are in the % range but probably speaks to higher positioned teams letting their foot off the gas late in a game and conceeding cheap points. Or referees managing losing teams back into the game with penalties or set restarts, depending on who you speak to.
Will a high offload count result in more points?
A lot has been made about how much the Eels are offloading this season. Kane Evans in particular has developed a handy off load late in his career (yes, he’s 28). Which begs the question, does it make a difference?
Whilst it was a big factor in their Round 15 win over Melbourne, it certainly didn’t on Thursday evening as Parramatta led the offload count 16-11 against Souths but were annihilated 38-0. That was with 10 fewer total sets and 43 fewer runs. They clearly didn’t generate a significant increase in metres either, with Souths gaining 440 more metres during the course of the game.
If you look at the Eels average offloads plotted against their average runs per game, they’re offloading at a historically high rate even if you consider the increase in ball in play.

They’re averaging roughly the same amount of runs per game as the Panthers and Knights, but Brad Arthur has his men offloading the ball nearly twice as much as Penrith, and nearly five more per game than Newcastle. It all sounds very impressive doesn’t it?
The issue is that the quantity of offloads alone don’t correlate with more points or a higher margin. The first chart below is plotting points scored by offloads, for every game from 2015-2020.
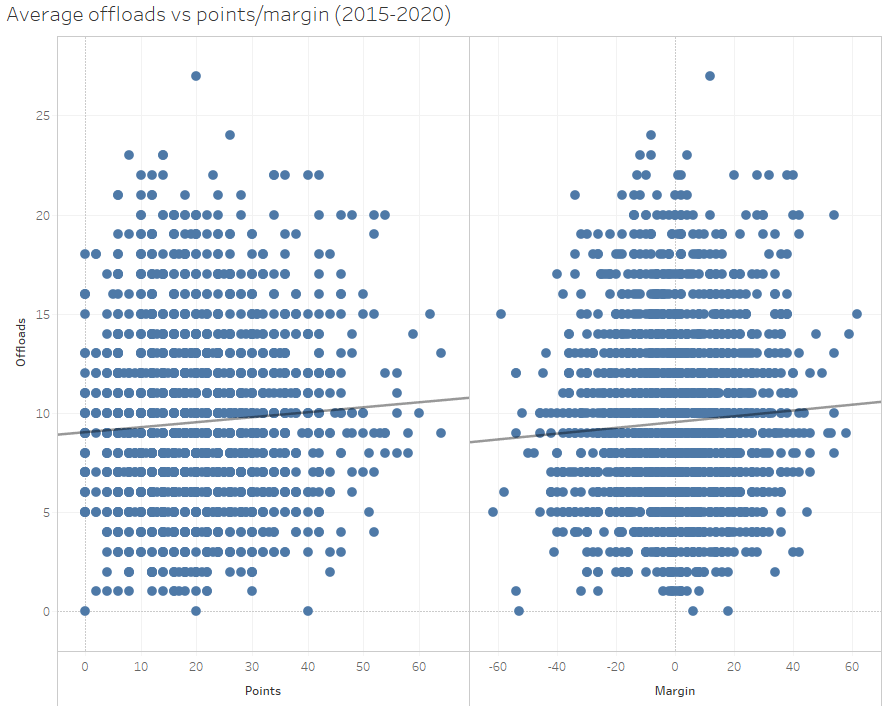
This shows the tiniest positive correlation but nothing significant and showing there’s almost no relation between the number of offloads thrown and points scored. The same can be seen for margin, again a small positive correlation but nothing substantial.
Do effective offloads make a difference, rather than looking just at total offloads? Let’s see by plotting them against points scored.

Again, no significant correlation here, just a very slight positive trend.
That’s some pretty strong evidence that a high volume of offloads has no bearing on the number of points scored of the final margin of a game. Whilst the Eels are offloading the ball at a notable rate, it’s not something that has historically been an indicator of success. As with everything in rugby league, context is everything and the right offload at the right time is what matters, not just having more of them.
Jamal Fogarty finally getting the attention he deserves
I recently posted a few radar charts comparing Gold Coast half Jamal Fogarty to some of the other top halves in the NRL. It turned out he’s having a sneaky good season which has mostly been flying under the radar.
One of his biggest strengths has been his ability to attack the line and keep defenses on their heels, ranking in the 88th percentile for line engagements per game among all haves for the 2020 season.
And it’s paying off for both the Titans and Fogarty, who received a contract upgrade recently and also was named as captain, despite having played only 16 first grade games and playing Q Cup a year ago.
What a difference a year makes. Notch another win for the Titans recruitment staff, who are having a wonderful season. There’s still some issues with their edge forwards and outside backs, but you can’t right the ship in one go.
It’s also a great reminder that player progression isn’t linear, and some players progress at different rates and develop into first grade players at 23-25. The lack of a genuine second tier competition means a lot of these players are lost to the game as the opportunities to develop their skills narrow dramatically once they hit 19-20. Of course, it indicates that there was yet another quality first grader who had been running around in the Queensland Cup for a while before being given a chance.
The frequency of this happening shouldn’t be surprising with only a few clubs making the most of that strong player base. Everyone is too busy trying to scout the next Greg Inglis and igoring the fact you’ll rarely hit on one of them and you still need another 16 players. There’s a glaring market inefficiency here if someone wants to exploit it…