If you’re a regular reader of the Eye Testtm, you’ll be (somewhat) familiar with the advanced statistics I use to analyse players throughout and across each NRL season. And now, they’re also available for previous NRLW seasons.
What do these statistics show? The issue is that generally middle forwards don’t play big minutes or put up big numbers and go unnoticed besides the odd comment about how much of an impact they make. To do so I created three advanced statistics for rugby league – Tackle %, Run % and Involvement Rate.
- Tackle % estimates the percentage of opponent plays whilst on field where a player completed a tackle.
- Run % estimates the percentage of team plays where a player completed a run during their time on field.
- Involvement Rate combines them and estimates the percentage of total plays a player completed a run or tackle whilst on the field.
If you want to read more about them, I’ve linked the explanations of them from the site.
Now I’ve explained them, let’s see how NRLW positions compare for these statistics to their NRL equivalents and look back at some top performers within each statistic from the past two NRL seasons. I would like to note that we’re dealing with some very small sample sizes, and even with a lenient minute restriction of 40 minutes I would still take these as indicative rather than representative of performances. Also, “current team” may also mean “previous team” for someone not playing NRLW currently, which is one of the issues looking at multiple seasons of data at once. Anyway, lets move on to the analysis.
Tackle %

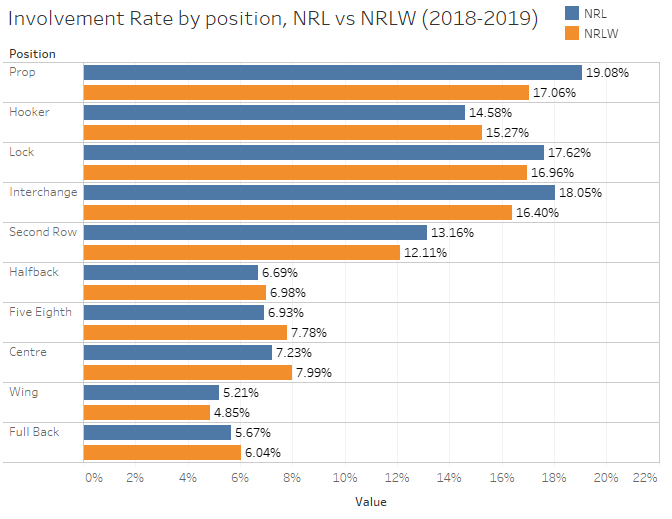
There’s not a huge difference between the NRL and NRLW for Tackle %. Hookers and Locks are making tackles at the same rate, around 25-25%, indicating they complete a tackle on one in four defensive plays. Props and interchange players still sit over 20%, but around 4% lower than their NRL counterparts. This could indicate that a lot of the basic hit up work could be centered less on the middle of the field.
Positions on either edge of the field are similar as well, other than Second Row being down over 2% and Five Eight being up almost 2%, which given that they defend in the same spot could cancel each other out. Fullback is slightly higher as well at 4% for NRLW compared to 2.8% for NRL.
Who are the top NRLW players for Tackle % then? Below are the top 15 players by Tackle % for seasons 2018 & 2019 who played at least 40 total minutes.
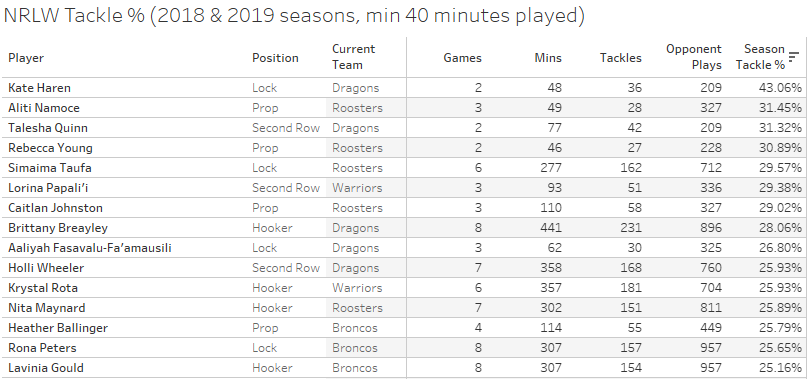
Kate Haren formely of the Dragons leads the way with a Tackle % of 43% from her two games, indicating that she made a tackle on two out of every five defensive plays whilst on the field. Aliti Namoce who last plaeyd for Roosters placed second at 31.45% and Talesha Quinn who also last played for he Dragons came in third at 31.32%.
Rebecca Young from the Roosters was the only other player to have a tackle rate above 30%. As noted above, the average Tackle % for middle forwards is about 20-25% so each of these players are tackling well above average for their position.
One of the interesting differences here compared to the NRL is seeing Second Rowers at the top of this list, which is usually just middle forwards for the NRL. In addition to Namoce, Lorina Papali’I (29.38%) and Holli Wheeler (25.93%) also make the top 15 whilst playing in the second row. Again, the average for second rowers is 16.2%, which puts Namoce’s tackle rate almost twice as high the average second rower.
Run %

Looking at the average Run % across positions for the NRLW against the NRL, there’s not as much variance as there was for Tackle %. Differences fall between 0.5% to 1% for most positions, and the only significant change is at lock, where NRL players make a run on 10% of plays, whilst NRLW locks make a run on 7%.
So, who has the highest run rate among all NRLW players who played at least 40 minutes across 2018 & 2019?

Ngatotokotoru Arakua takes first place with a Run % of 20.92%, meaning she completes a run on at least two out of every five plays the Dragons used the ball. Second place is Chloe Caldwell from the Roosters at 20.45%, the only other player above 20%. Another former Rooster in Elianna Walton picks up third place with a run rate of 17.99%.
With the average Run % for middle forwards sitting in the 10-12% range, anyone over 15% is putting in an elite amount of work.
It’s also worth noting that new Dragons signing Isabelle Kelly at centre was extremely close to making this top 15, sitting only 0.15% outside with a run rate of 12.04% which is exceptional for a centre.
Involvement Rate
Given that Involvement Rate is a combination of Tackle % and Run %, it would make sense that any changes we saw in the previous two statistics would be reflected here as well.
Involvement Rates for middle forwards are slightly down as was exhibited with Tackle % rates. NRLW Prop forwards suffer the biggest drop at 2% compared to their NRL counterparts, otherwise things are relatively consistent.
The top 15 players in the NRL for Involvement Rate from the 2018 and 2019 seasons who played at least 40 minutes are shown below.

Kate Haren takes top spot here, as she did with tackle %, with an Involvement Rate of 26.37%, meaning she completed a run or a tackle on one in every four plays whilst she was on the field. Ngatotokotoru Arakua came in second with an Involvement Rate of 21.97% while Chloe Caldwell rounded out the top three with an Involvement Rate of 21.42%.
Brisbane halfback Tarryn Aiken is also worth mentioning, sitting in 19th place with an involvement Rate of 17.25% in a list that is dominated by middle forwards. This is mainly due to her running game, as she sits just outside the leaders in Run % with a run rate of 10.23%.
If you enjoyed this post please consider supporting The Rugby League Eye Test through one of the links below.
Scan the QR code or copy the address below into your wallet to send some Bitcoin to support the site Scan the QR code or copy the address below into your wallet to send some Ethereum to support the site Scan the QR code or copy the address below into your wallet to send some Litecoin to support the site Scan the QR code or copy the address below into your wallet to send some Bitcoin cash to support the site Select a wallet to accept donation in ETH BNB BUSD etc.. Donate To Address
 Donate Via Wallets Bitcoin
 Ethereum
 Litecoin
 Bitcoin cash
Support The Rugby League Eye Test
Support The Rugby League Eye Test
Support The Rugby League Eye Test
Support The Rugby League Eye Test
Donate Via Wallets