
One of the outcomes of the introduction of set restarts after Round 3 in 2020 was an increased time in play, which artificially inflated a lot of numbers and not necessarily in a good way. It claimed to speed up the game, but mostly just resulted in more “stuff” happening in the middle of the field.
Six more tackles from a ruck infringement usually just meant they restarted their set as they would from any other spot on the field – three to four one out runs before spreading the ball before an attacking kick.
This isn’t new information. It’s something I’ve written about extensively over the past six months and will probably continue to be a factor in 2021 with offside violations now incorporated into set restarts.
What might be new information is that the Round 3 changes in 2020 didn’t really create a new trend in play style, they just accelerated one that had already started a few seasons ago. We’re seeing more one out running, dummy half freedom decreasing, fewer offloads and consequently less second phase play. The only thing that hasn’t changed is the frequency of long runs.
This makes sense as coaches have become even more conservative, favouring sensible mistake free football over an expansive and aggressive attacking philosophy. Given the immense pressure and scrutiny they’re under it’s hardly surprising, but aesthetically it’s not very viewer friendly.
By looking at some key running and passing statistics over the past seven seasons (2014-2020), we can get an understanding of how the style of play in the NRL has changed.
Let’s take a closer look at some of these trends affecting the style of play. As usual, all statistics are taken from Fox Sports Stats
One Pass Run % (Hitups)
The first was to look at the change in style can be seen by the percentage of one pass runs (a standard hit up, from one pass out of the ruck) out of all runs made by a team. We can see below that it has been increasing over the past three seasons, to the highest rate since 2017.
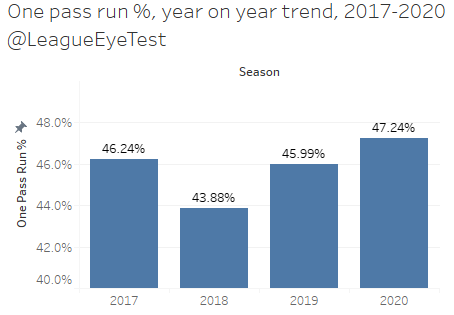
The reason for looking at one pass runs/hit ups as a percentage of all runs is that we know there were more runs in 2020 due to more time in play. Logically that means more hit ups. By looking at the percentage of all runs, we get an idea of how often they’re occurring.
Next we’ll breakdown just one pass run percentage even further. The below chart shows every coach from 2017 who has survived more than three games, their average runs per match and the percentage of all runs that came from one pass. The data points in aqua are from 2020 and the lighter shaded ones represent prior seasons.
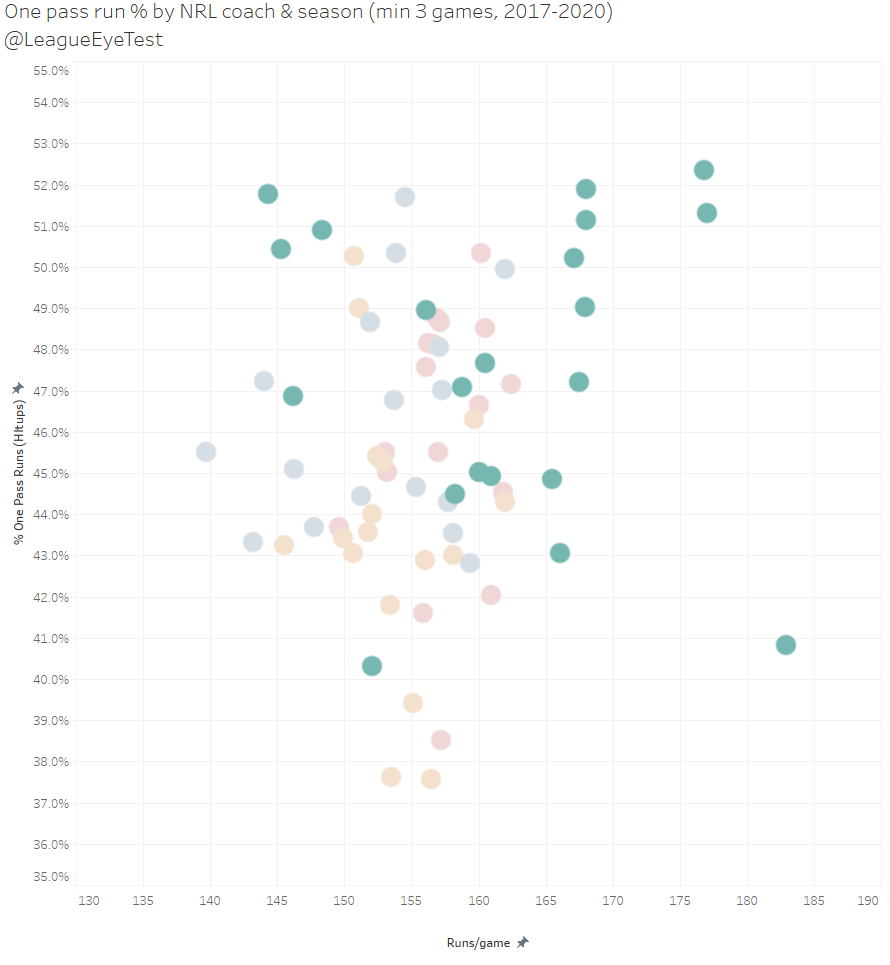
It highlights just how much more running was done in 2020, with ten coaches averaging more than 165 runs per game. The previous high from the six prior seasons was 162 per game, by Dean Pay’s Bulldogs in 2019.
The other thing to note is that since 2014, there had only been five coaches who had a one pass run percentage of higher than 50%. We moved from just five in the previous six seasons, to eight in 2020, having more than half their runs come from a basic hit up. Some successful coaches from last season were among those eight, with Brad Arthur’s and Ricky Stuart’s sides using around 51% of their runs on hit ups. Others included Dean Pay and Anthony Seibold, indicating it’s not a metric that necessarily correlates with winning.
One data point that stands out is in the bottom right corner, which is Ivan Cleary in 2020, who had just 40.8% of their 180+ runs per game come from a one pass run. The only coach to use fewer hit ups was Justin Holbrook at 40.3%. Cleary has been at the bottom of this list for a number seasons so it’s nothing new, with 38.5% in 2019, 42.9% in 2018 after 48.9% in 2017.
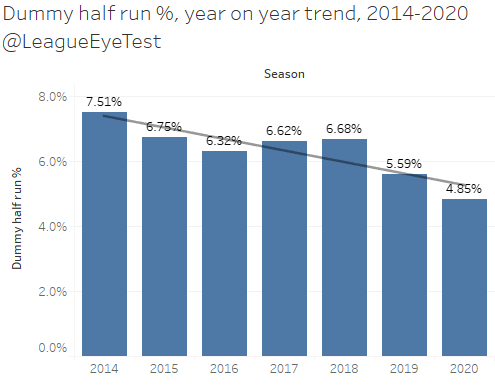
Dummy half runs
The number of dummy half runs declined again in 2020, and chart below shows just how few coaches let their #9 run with the ball out of the ruck, dropping below 5% for the first time since 2014.
Breaking it down, again we’re looking at all coaches, three or more games at the helm, this time from 2014-2020 and the percentage of runs from dummy half, with 2020 highlighted.
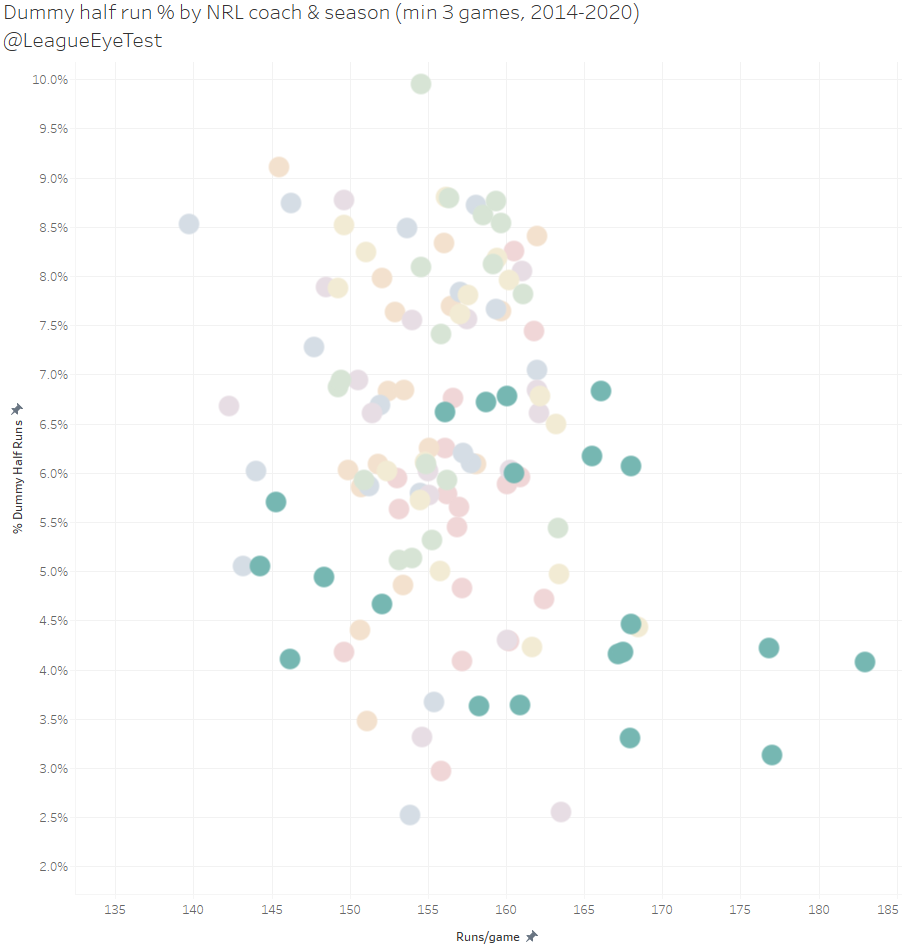
What stands out is that no coach from 2020 had a dummy half run percentage higher than 7%, with Craig Bellamy and Michael McGuire the highest last season topping the NRL at 6.8%. More than half the coaches had a rate of less than 5%.
Another way of looking at the decline in hooker freedom is that there were zero teams with a percentage of dummy half runs higher than 7% in 2020. In 2019 that was three. In 2018 it was seven. And going back to 2014 there were ELEVEN coaches who had dummy half run percentages of at least 7%, with two of them (Neil Henry and Steve Price) above 12%. Let that decline sink in for a minute.
We were sold a bill of goods on set restarts bringing the little man back. They never left, it was only observation bias that indicated they were back post Covid break. The real story is that the little men in the middle of the field are being held back by their coaches, not the rules.
Long run %
The one constant of the past seven seasons has been the percentage of long runs (8 metres or more). Starting in 2014 at 60.7%, we haven’t seen an NRL season with the percentage of long runs below 61%, with the last three seasons sporting very similar rates.
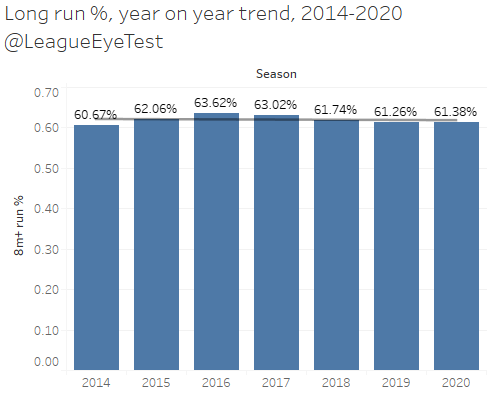
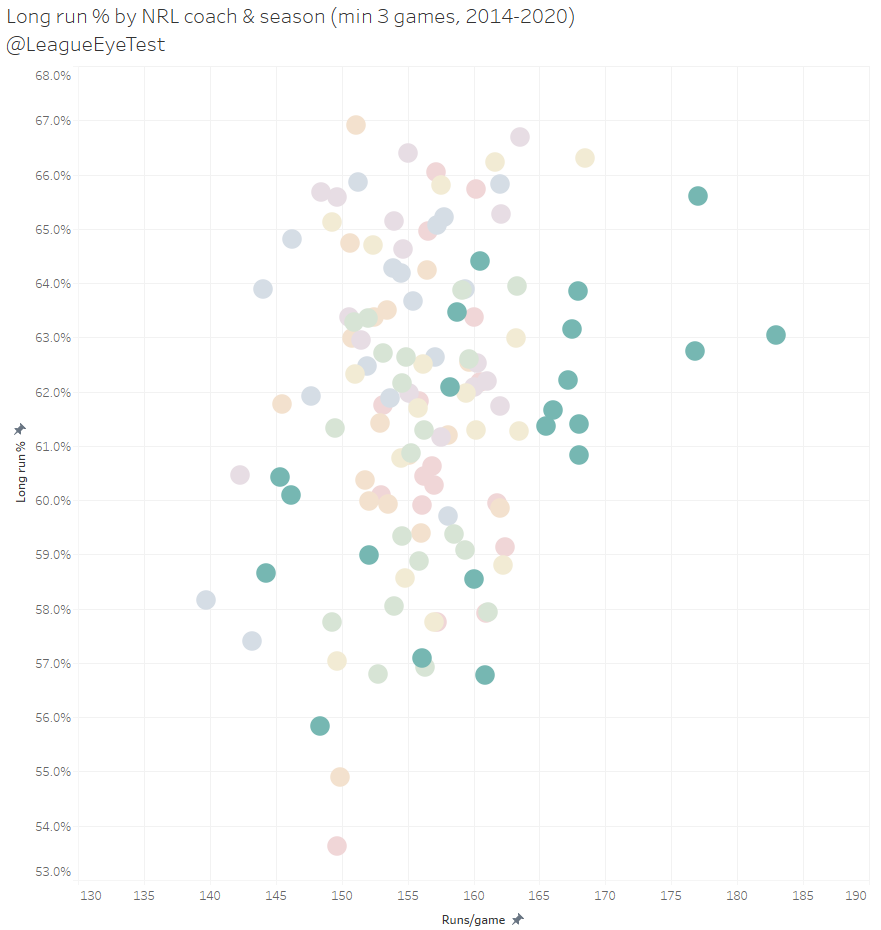
2020 followed this trend, with a scattering of coaches between 66% (Brad Arthur) and 56% (Peter Gentle). That’s not to say that longer runs were an indicator of success, as Paul Green and Paul McGregor were in the top five for 2020, both in the 63% range.
Not a lot to see here, the changes last season didn’t influence the overall frequency of long runs.
General play passing
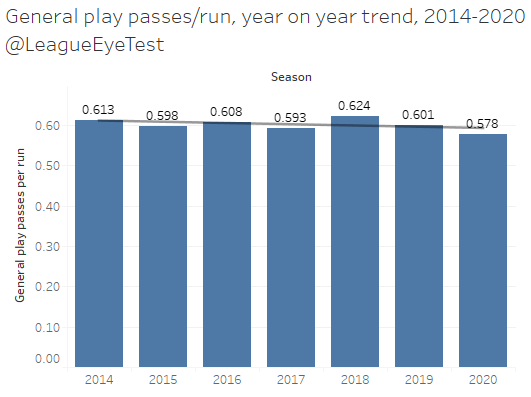
This one is pretty damning for 2020 significantly changing the style of play. As shown earlier, not only did we see more one out running, but we’ve also seen a significant decline in the number of passes per run. The number of passes per run in 2020 is nearly 10% down on the peak of passing in 2018. Not to sound like a broken record, but we’ve had more running and less passing.
This coach chart is somewhat of an inverse of the one pass run chart, with Holbrook and Cleary on the other end of the scale. Expansive passing games weren’t a feature of 2020, with most coaches from last season sitting in the bottom half of this chart for passing rate.
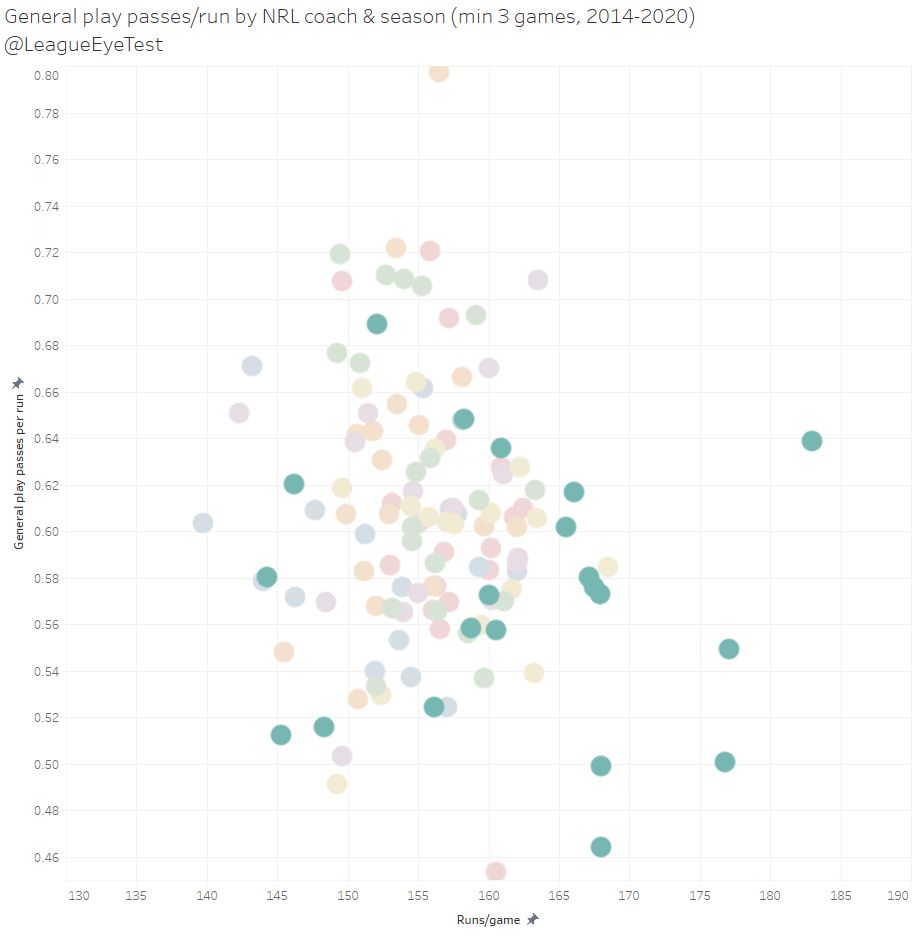
The worst offender in 2020 was Canberra’s Ricky Stuart with 0.46 passes per run only beaten by … Canberra’s Ricky Stuart in 2019 with 0.45 passes per run. It’s clearly working though, given the Raiders results for the past two seasons. In fact, Stuart holds the three lowest passes per run rates since 2014, and four of the six lowest seasons during that time frame.
Note: One thing I’d like to point out is that “General Play Passes” in the Fox Sports Stats don’t appear to include dummy half passes, so you can probably add 1 to the average number of passes per run. It doesn’t change the layout of the chart though, just the number.
Offloads
The rate of offloads has also declined each season since 2017. It’s already a low number since there are relatively few offloads per game, but they’re becoming even rarer and are 10% down since the peak in 2017.
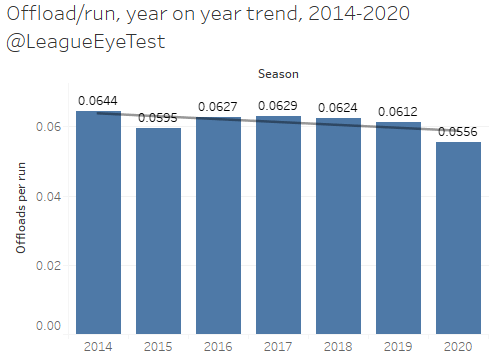
One of the biggest differences in offload rate was something I’d written about previously, with the Warriors changing their coach mid-season and being given some more freedom to offload the ball. Under Stephen Kearney the Warriors had just 0.041 offloads per run, whilst under Todd Payten that number nearly doubled to 0.072, second in the NRL only behind Brad Arthur at 0.075.
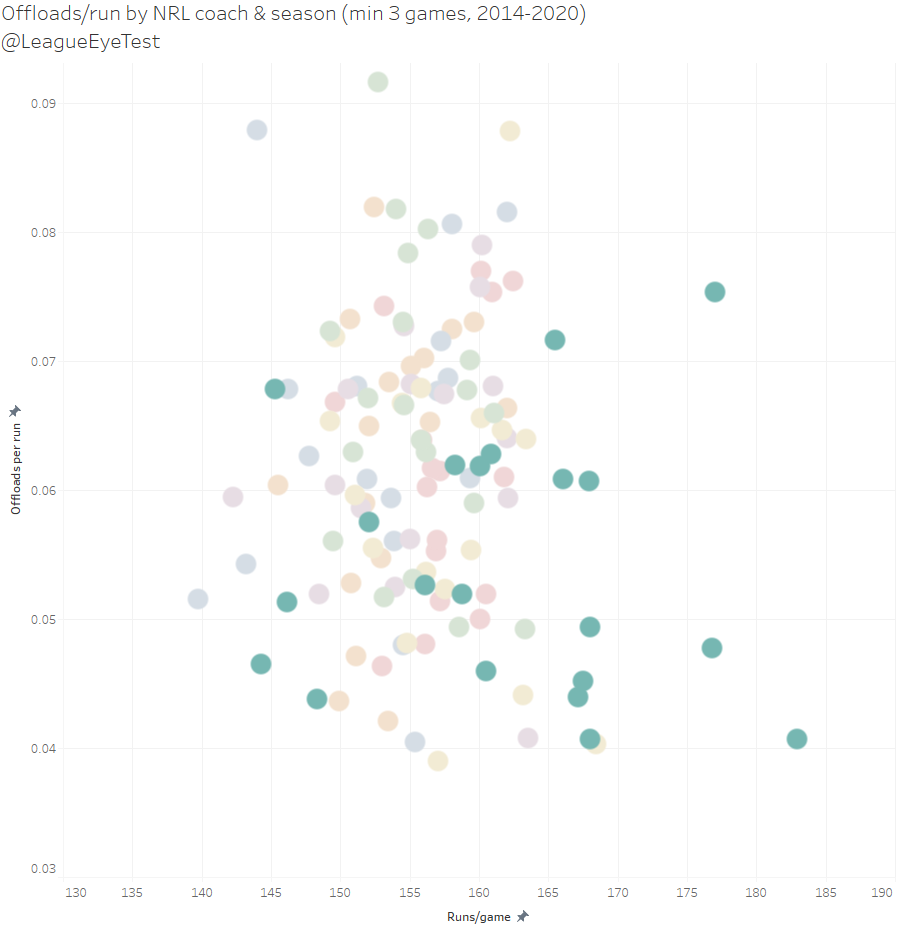
Anthony Seibold was the only other coach to approach 0.07 offloads per run, at 0.068.
There were fifteen coaches who had an offload per run rate of 0.07 or better in 2014, and that number has declined to just eight in 2020.
All of this indicates just how the style of NRL play is becoming more predictable, with basic one out running from middle forwards now not only the bread and butter of the game, but most of the main course as well.

2 Responses
[…] to Rugby League Eye Test, only two teams finished the 2020 NRL season with more than 5% of their total runs coming from […]
[…] I can’t put the impact of the six-again any better than the Rugby League Eye Test has in an incredible deep dive, but the cliff notes is “more hitups, less adventurous […]