Rugby League is back for 2021 and so is the Eye Test. Hopefully I’ll avoid the sophmore slump that follows many rookie seasons, but I can’t promise anything other than a lot of talk about Daniel Alvaro, Chrsitian Welch, and if Friday is anything to go by, Isaiah Papali’i.
Round 1 of the NRL season featured a lot of talk about how the was game marred by six again calls and that matches were too fast, but they were hardly the worst thing on the field this weekend, which would go to the Parramatta Eels horrific away jerseys. But I digress.
Let’s have a quick look at some key metrics to see if anything had changed this season given the amount of (unnecessary and untrialed) rule changes this season.
A few things to keep in mind – we’re looking at just 8 games and 16 halves of football which is an incredibly small sample size . For the first month of the season, I’ll keep harping on this until we hit about 30 games played which gives a more robust set of games to work with. Until then the changes we’re seeing in the NRL and identifying here are more indicative than representative.
The other important thing to remember is that comparisons with Round 1 2020 are pointless from most perspectives as it was nearly a different game under two referees and no set restarts. Round 3 2020 should be the direct comparison since it more closely follows whatever vision of rugby league Lord V’Landys has concocted this season. I’ll still do some direct round comparisons where I think they’re valid, but Round 3 will be the default.
Time in play has declined
The eight games in round one produced 55.5 minutes per game, up about 1.2% from 54.83 minutes for Round 1, 2020 but down 2% from Round 3, 2021 where the average time in possession was 56.5 minutes (excluding the Penrith v Newcastle golden point game, which the NRL seemed to include in their analysis).
It’s an interesting dichotomy given that the rule changes were meant to create more time in play and more attacking football. Any serious fan will tell that those two are mutually exclusive as scoring points creates stoppages. You can’t have both.
Regardless, the fact is that the ball was on the field for fewer minutes in round one. Putting that in perspective, from over 300 games since the start of 2019, only one game from the weekend (Warriors/Titans) ranked inside the top 100 for time in play, and only two of them had more than 55 minutes in play.
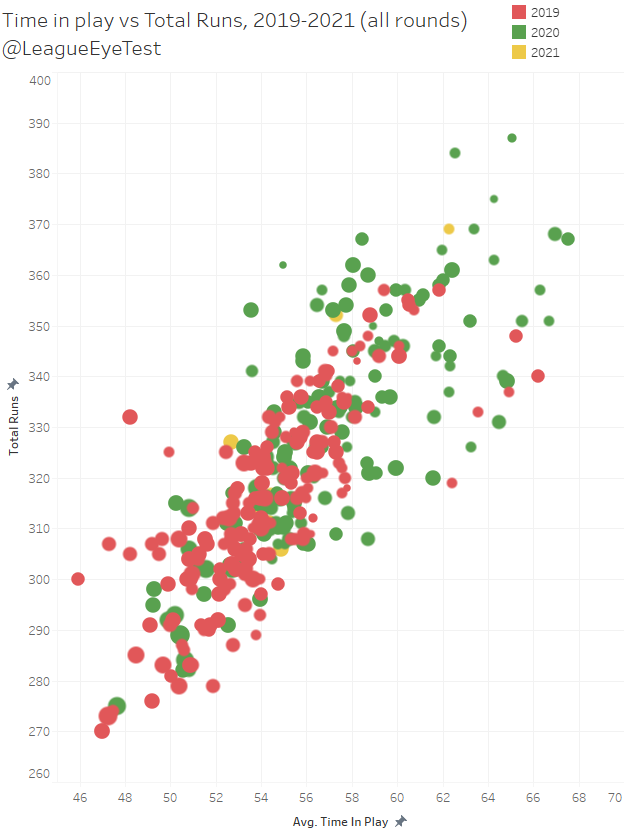
The above chart shows all rounds from 2019-2021 for Time in Play plotted against Total Runs. Red data points are 2019, green are 2020 and the few yellow ones you can see are 2021. It shows just that most of the weekends games fall right in the middle or lower half of total ball in play time for the past two seasons, and again that the more points in a game, the lower the time in play.
This is one that will be worth keeping an eye on as the season progresses and really does need a larger set of data to be statistically significant. But the reduction of penalties for ten metre infringements hasn’t resulted in an increase in possession on the field like many predicted.
Things are faster?
We’ve clarified that there’s less time in play so far this season, but is more “stuff” being done? One of my big pet peeves last season was people claiming the game was “faster”, when all that happened was more things were happening because the ball was in play more (about 6%).
This season we have the same claim that the game is “faster”, yet the time in play is down. How do we determine if it’s faster?
Unfortunately, as a layman doing this as a hobby in my spare time with whatever little public data is available, it’s hard to say. I don’t have access to the GPS tracking data or more detailed statistics that might show authoritatively that more things are being done and they’re being done quicker.
Then how can we check if it is faster? Well, If things are happening faster then you’d expect them to be happening more frequently. With that in mind, I’m going to look at the number of runs per minute. If the game is faster, there would be more “stuff” happening per minute in a game.
Looking at round one this season, there were around 5.81 runs per minute. The same number for Round 1 2020 was 5.71 and for Round 3 of that season, the true comparison as mentioned above, it was also 5.81. This would indicate that the opening round this season was operating at a similar “pace” of play to the return after the Covid 19 lock down last season.
As you’d expect there was some variation between games this round for runs versus time in play, with the Warriors v Titans game the only match to have more than 58 minutes on the field.
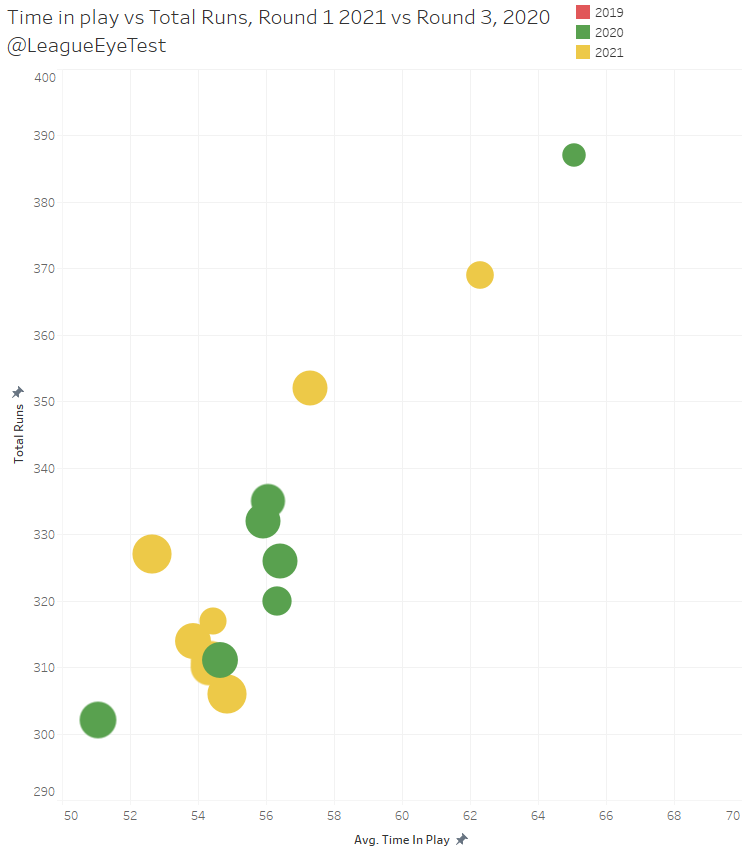
Above is the same visualisation from before showing Time in Play plotted against Total Runs from Round 1 2021 (yellow) and Round 3 2020 (green). t’s pretty clear that most of the games from Round 1 this season were higher scoring and resulted in lower time in play, which was what I referred to earlier about them being mutually exclusive.
One thing I did note from looking at this is that the rate of runs per minute increased over the course of the season. From 5.81 in Round 3, to 5.86 in Round 15 and 5.92 in Round 17 and 5.95 in Round 20. This could point to players match fitness coming along as the season progressed, as even the most arduous pre-season campaign probably cannot match the rigorous intensity of an actual competitive game of rugby league.
The other noteworthy thing that popped from trying to analyse this “faster” debate is that Round 1, 2019 had 5.97 runs per minute, higher than any rate in the 2020 season. Weren’t these rule changes trying to increase the amount of football, not decrease it? (I should note that runs per minute also declined over the course of that season with Round 24 down to 5.58 runs per minute, but that doesn’t fit my narrative so let’s forget about it for now)
That’s not to say the game isn’t faster, because at times the Eye Test seems to indicate it is and players are definitely tiring quicker. However, the time of ball in play could be classed as nearly irrelevant, as friend of the site Aaron Wallace from Fox Sports put it better than I ever could:
The game being “faster” isn’t the issue, the reduction of opportunities to recover is. With fewer stoppages the duration of a half of football is most likely appreciably shorter than it has been. Especially if you don’t count the Sharks/Dragons second half with Wade Graham’s captains challenge that would make Shane Watson blush.
Graham Annesley’s weekly review seemed to indicate this as well, as they’ve started to talk about Elapsed Time and the percentage Ball in Play of Elapsed Time. As alluded to above, the total elapsed time or total ball in play time isn’t overly relevant, what is relevant is time between whistles where players are putting in maximum effort. That is most likely longer, and the gaps between them are shorter.
Does that make it “faster”? Probably not. But it does condense a similar amount of rugby league into a smaller period of time, which is what is contributing to the increased player fatigue and resulting in something barely resembling the greatest game of all at times.
Is anything changing in the second half?
If we’ve decided that fatigue plays a part over the course of an entire game, then another way of looking at the impact of a “faster” game is how are performances in the second half this season compared to last season?
In Round 3 last year, there was a general drop in the amount of “stuff” happening from the second half to the first half, with most statistical categories declining. Average points dropped from 19 to 15.8, runs dropped from 173 per first half to 163 per second half, total metres dropped from 1,547 to 1,453 and metres per run dropped from 8.95 to 8.9.
The opposite is actually true in Round 1 2021. The majority of statistics saw an increase in the second half. Teams were scoring more points (17.8 to 22.6) in the second half, there were more run metres gained (1,389 to 1,429), metres per run increased (8.5 to 8.9). There’s also more running up the middle – dummy half runs and one pass runs (hitups) increased in the second half this season.
Completion rates increased from 74.54% to 75.87%. This led to play the balls per set increasing from 3.65 to 3.72, whilst last season they dropped after the break, from 3.88 to 3.81.
What does this mean? Again, the sample sizes are tiny but it may mean that teams are pushing the ball through the middle even more in the second half trying to wear down already fatigued opponents. And it seemed to work with scoring increasing to 22 points per game in the second half, up from 15.8 in second halves last season.
Another thing to keep an eye on.
Set restarts and penalties.
Finally, this week everyone’s favourite part of the Eye Test – referee analysis. Here’s the breakdown of set restarts and penalties awarded by referees from Round 1.

You can see from the above chart that there were three types of games in Round 1 – the ones where they “let the boys play” (Gough and Chris Sutton), the ones where the referees wanted to stamp their authority on the game (Klein and Gerard Sutton) and then the rest. Although Matt Cecchin gets points for trying to differentiate him self from the pack by blowing twice as many penalties as set restarts.
We also had the issue of inconsistent interpretations of set restarts rearing it’s head again. Chris Sutton called four set restarts in the first half but zero in the second half. Klein blew nine six agains in the first period but just two in the second. This was a bugbear of many fans last season and the change in the calendar year hasn’t appeared to make much of a difference.
However, the real damage from set restarts now being awarded on penalties doesn’t show up the numbers above. With set restarts now awarded when players aren’t back 10 metres, defensive teams now have the most minor of deterrents for deliberately being offside when a team is running the ball off their own line.
Is defending for a few extra tackles for a chance of fielding the ball inside your opponent’s half or even force a line drop out a sufficient penalty? Most coaches would (and will) be trying to push their luck with it this season. Like I said last season, if you’re not cheating, you’re not trying.
There was an instance of this in the second half on Friday evening where the Eels were clearly jumping early in an attempt to keep the Broncos either pinned down or driven back into their in-goal area. Conceding extra tackles aren’t enough of a disincentive to maintain field position.
Teams in the Broncos situation are no longer receive relieving penalties allowing them to gain 20-30 metres from a penalty for an offside infringement. The smart coaches will (or already have) adapted, and as we saw last season the pushing of boundaries is often a key to success.
The depressing thing is that yet again, we have a consequence of a rule change that any regular league watcher would was able to identify well before the season had started. But that’s business as usual under PVL.
Big bench contributions
Isaiah Papali’i was a huge factor off the bench for Parramatta on Friday in their win over the Broncos. It was such a strong performance that many were wondering how he was let go from the Warriors, and replaced by Kane Evans, who didn’t even make their 21 for the opening round.
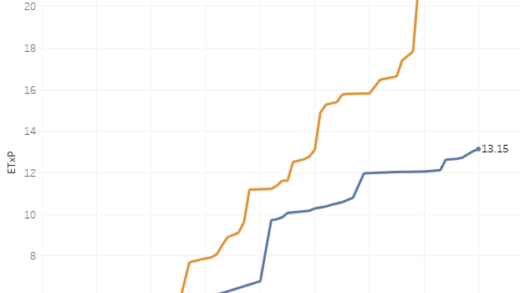
Just how impressive was Papali’i? Let’s have a look at all all interchange players minutes plotted against run metres since the start of 2020. Blue data points are from 2020 and orange data points are from 2021.
Papali’i smashed out nearly 200 metres in 56 minutes from just 18 runs, the seventh highest run metre total from an interchange player since the start of last season.
Another new signing worth noting was Jai Arrow, who also had a very strong debut for Souths as well off the bench, notching 162 metres in just 45 minutes from 19 runs.