
Two rounds of the 2021 National Rugby League season are in the books, and I don’t have a witty opening this week because my kids are sick. Let’s get right into it.
Time in play is stable for now
There was a slight increase in time in play for Round 2, which may have been brought on by the torrential rain seen across most of the eastern seaboard. The average time in possession hit 56.6 minutes, up 2% from 55.5 in Round 1, which as I mentioned last week was down almost 2% from Round 3, 2020.
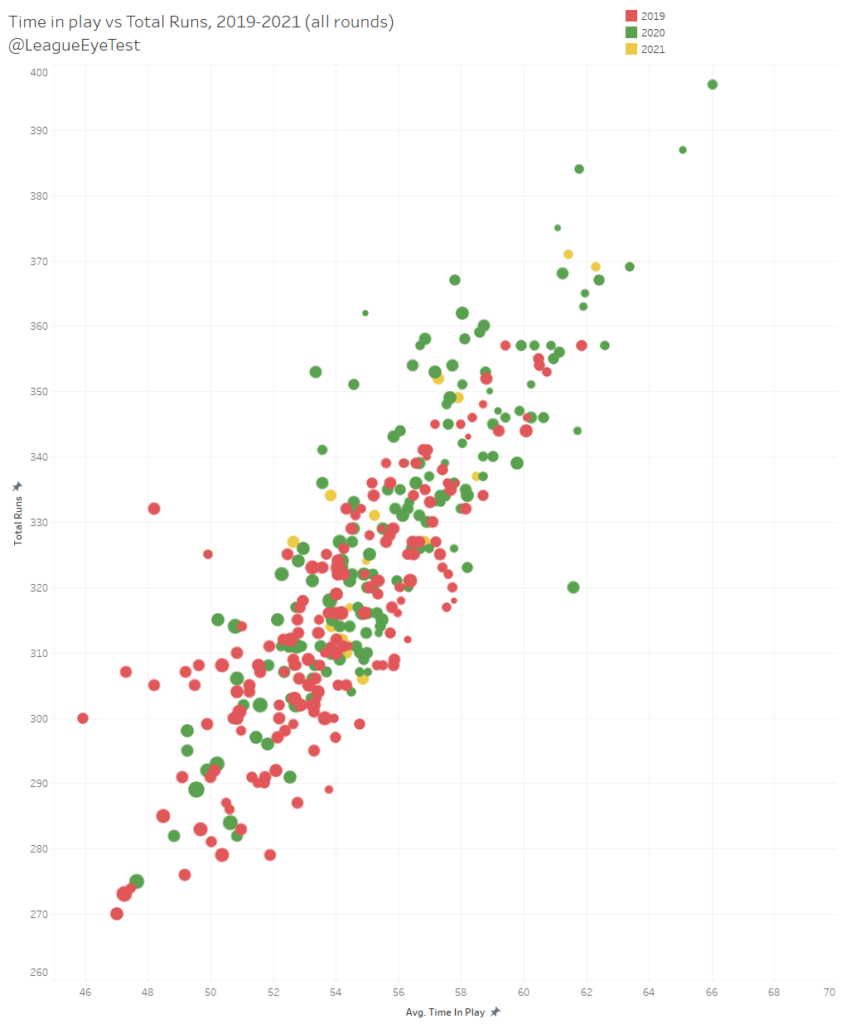
How does that Round 2 number line up with the corresponding round from 2020 (Round 4)? It’s down again, but only by 0.3% this time. Below is the visualisation of Time in Play plotted against Total Runs for Rounds 1 & 2, 2021 (yellow) and Rounds 3 & 4, 2020 (green). Most of the 2020 games are sitting below 57 minutes on field.
If we expand that out again to all of 2019, 2020 and 2021, you can see that 2021 is falling between 2019 and 2020. Still early days but there’s definitely not more football being played.
The other metric I was looking at last week as a proxy for pace was runs per minute. That hasn’t changed much either, sitting at 5.93 this round, an increase of 1%. Again compared to Round 4 last year it’s virtually the same – a change of just +0.2%. Things aren’t being played faster as we’re seeing the same rate of runs per minute as previous seasons, even if it appears that way to the naked eye.
Given these numbers, I’m again leaning to the condensed rugby league theory where the same amount of the game is being crammed into a shorter elapsed time, and the only thing being removed is the chance for players to recover. Fewer stoppages, more fatigue, more errors.
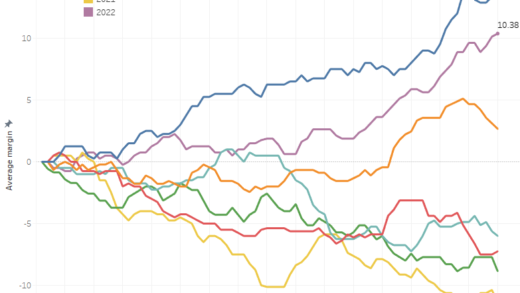
Below is a chart of errors per run from 2014-2021, comparing the number of errors per run for Rounds 1&2 (3&4 for 2020).
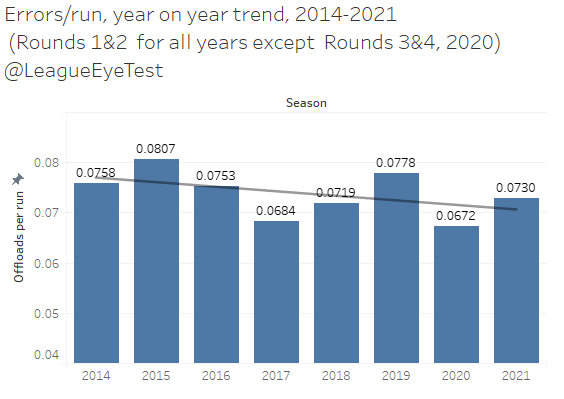
2020 had the fewest errors per run since 2014, whilst this year we’re up to 0.73 per run which is an increase of 9% and the highest number since 2016. Some of that may be due to the wet weather, but total errors for the round were down this week (average of 25 to just under 23). There’s that fatigue issue again.
The devolution of style might be continuing
If you didn’t read my post on the devolution of style in the NRL, I’d recommend going back and giving a quick look. In summary, the trends we saw last season – more one out running, less expansive passing and more conservative play – was already creeping into the game over the past 5-6 seasons and the drastic changes introduced in Round 3 just accelerated them.
With that in mind how do they look after two rounds? Like last week we’re looking at small sample sizes against previous seasons, so I’ve restricted them to just Rounds 1 and 2 (or 3 and 4 for 2020) to ensure like for like comparisons.
We’ll start with the percentage of all runs that are one pass runs (basic hit ups). It’s a good way to see if the game is being played in a simple and conservative manner.
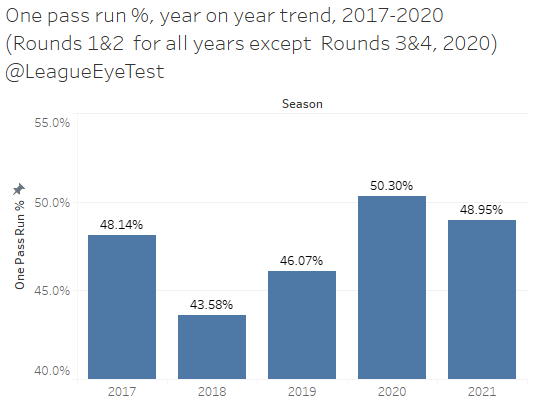
A slight decline from last year, but still hovering at around half of all runs being a hit up which was a huge feature of the NRL in a set restart world. Not the most attractive style of rugby league unfortunately unless you’re a big middle forward fan like myself (how good was seeing Daniel Alvaro run the ball in the open field on Saturday evening?)
Next up let’s examine the number of general play passes per run, to see if teams are spreading the ball instead of just smashing it up the middle of the park.
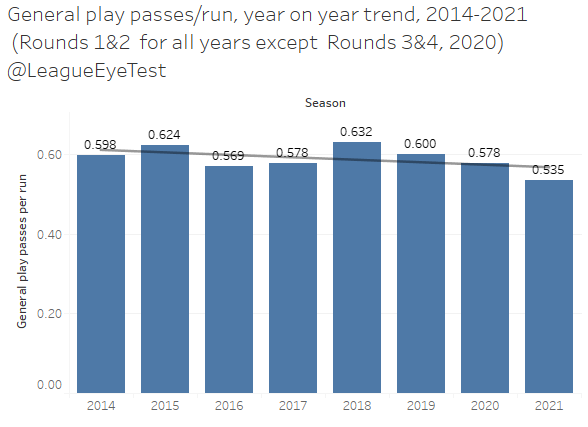
Passes per run continues to drop, down to the lowest level since 2014 of just .535. As mentioned in the article linked above these are general play passes and don’t include dummy half passes, so you can just add a 1 in front for total passes per run.
And as you’d expect with passing down, offloads per run continues to drop as you can see below.

2021 is currently only ahead of 2016 at 0.0533 offloads per run, which is a 25% decline in offloads in four years. Score another point for conservative one out rugby league. We don’t need to bring back the little man, we need to bring back the offload.
One of the reasons passing may be down in 2021 is that kicks are up from 15.9 per game to 20.4 per game. The problem is they’re all long kicks, which have grown from 15.9 to 20.4 and metres per kick is up 24.5 to 26.3. Kicks dead and forced drop outs are also down year on year. This data would suggest we’re getting more midfield rugby league and fewer plays in attacking zones, but again it’s early days and the sample size isn’t sufficient.
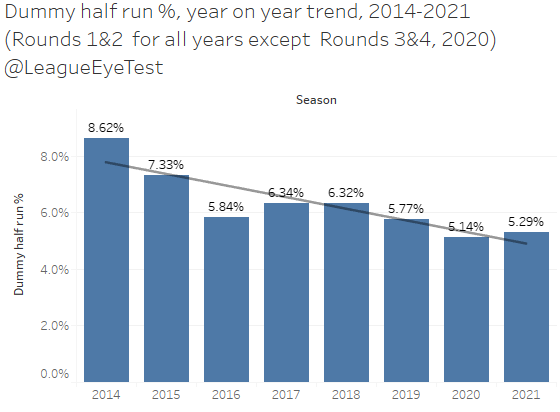
The only metric that seemed to have an increase this season was the percentage of dummy half runs, which improved slightly to 5.3% but still sits well below what it was in 2014.
A few other minor stats to note after two rounds. Play the balls per set has dropped from 3.83 in 2020 to 3.76. This makes perfect sense when you see there’s been more errors per game made (22.8 to 24.1) and completion rates have dropped from 77.2% to 76.4%. Simply put, we’re seeing an extra set per game but fewer overall runs due to extra errors.
Set restart & referee update
One thing I looked at in 2020 was the number of play the balls per “total penalty” (set restart or traditional penalty), to see how often they were being called. This year has seen that number go from 18 play the balls per penalty in first halves of Round 1, to 20 in second halves of Round 1, 24 in first halves of Round 2 and up to 29 in second halves of Round 2.
That’s nearly one every five full sets, up from three full sets in the first half of the opening round. Last year the highest first half rate was a penalty or set restart every 19 play the balls. There wasn’t a single first half above 20 play the balls per infringement called, and we’ve already breached that mark in 2021.
Is that a good or bad thing? Depends on how much influence you want whistle blowers to have. Some like a tightly controlled contest while others like it to be more free flowing. Here at the Eye Test, all we like is consistency. If it’s a penalty or set restart 2 minutes in, it should be with 2 minutes to go no matter the margin. But it isn’t.
The chart below shows big drops in infringements called by half, larger than we’ve seen previously.
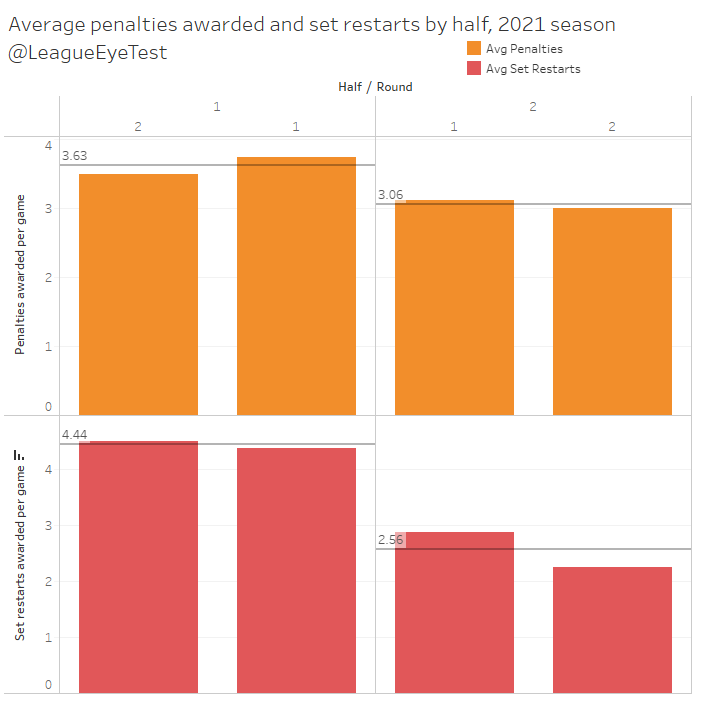
Penalties aren’t dropping that much – 3.6 to 3.1 from first half to second half. The biggest drop is for set restarts, which go from 4.4 to just 2.6 in second halves. We’ve all seen it happen – a rush of set restarts in the opening 20 minutes before a period where you can lie all over the ruck and not get called, followed but a scattering of them in the second half.
And you can see from the below table showing half splits per referee it’s happening largely across the board this season.

Only Matt Cecchin with a 0.5 difference in restarts per half bucks the trend, maybe he didn’t get the memo? I’m also very concerned that Adam Gee isn’t calling the most set restarts per game anymore, hopefully this is another thing I can attribute to small sample size.
Luke Keary doing Luke Keary things
Whilst I hold no interest in the outcome of the Dally M awards, it’s becoming increasingly noticeable that there are players being awarded votes who have no business receiving them. Voters are trying to play the smartest person in the room card by handing out one vote to a player who did well on a team that got thumped, even if they were the 14th best player on the field.
Case in point is Luke Keary, who sits on zero Dally M points after two rounds, despite adding +20 Net Points per game when looking at average Net Points Responsible For (NPRF). Players who have more votes than Keary include Matt Moylan, Benji Marshall and Jack Bird. I’m not suggesting they didn’t deserve points, but for Keary to fail to register any votes highlights the flaws in the current system.
I don’t like looking at individual player stats after just two games because it’s such a small body of work, and opponent strength can play into it significantly. That said, Keary is in a class of his own so far as you can see from the table below showing average NPRF from the two rounds played in 2021.
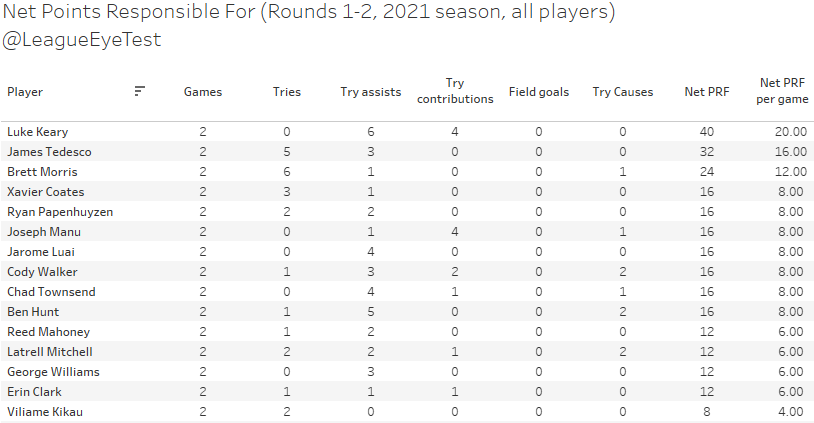
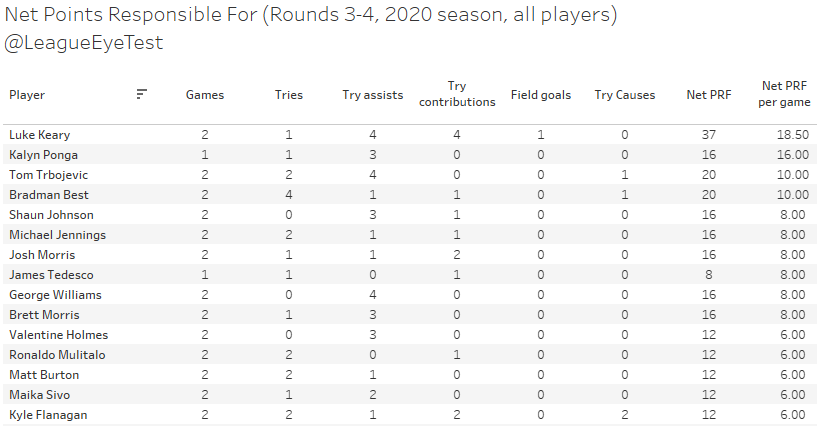
The amazing thing is that Keary did the exact same thing last season after the return from the Covid 19 lockdown, adding +19 per game in Rounds 3 & 4.
There’s no perfect system to fix the voting issue, but the only thing I’m sure of is that the current system doesn’t work.


Great Analysis