
We all know the Raiders have had some shocking second halves this season, and Round 11 was no different.
It’s been documented a number of times and it’s not any ground I’m going to attempt to cover. The Raiders are very, very bad in the second half, I can’t provide any new information here. This article on NRL.com goes into great detail of the changes in the Raiders stats after half time.
What I am going to look at is how their second half struggles compare to the rest of the league to see if there’s anything that stands out. Are they the only team having bad second halves or are there other teams suffering alongside them from the 41st minute onward?
To start, let’s look at the average margin by half and NRL team for 2021 after 11 Rounds. Quick reminder that I’m using Fox Sports stats which will have a very minor difference to the official NRL statistics.
The chart is below – green dot represents first half margin, red dot represents second half margin and the line between shows the size of the gap. The chart is sorted by second half margin (red dots).

As you’d expect it’s not a pretty sight for the green machine. They are next to last in average second half margin at -10.5, over fifteen points fewer than their first half margin. You can also see by the size of the bar between the red and green data points that it is the largest gap between halves this season, over double that of the next worst second half performer, the Gold Coast, at a difference of -7.2.
How does that rate in context of recent seasons? The worst second half margins since 2014 are in the chart below.
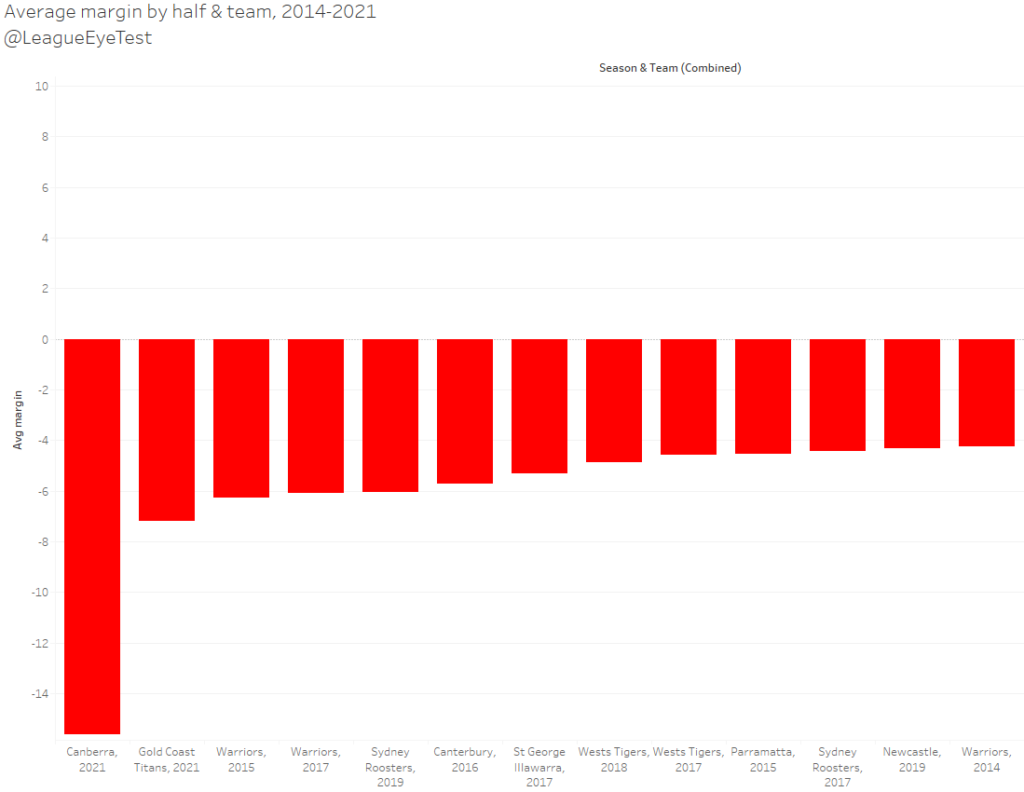
The previous worst second half teams by margin were the 2015 and 2017 Warriors. The Raiders are on track to beat that record handily. The Titans should be very happy the Raiders exist because otherwise we’d be talking about their second half capitulations instead.
Slightly concerning is the fact that that the worst two sides are from this season. It’s another data point highlighting the increasing inequality that rule changes in 2021 have caused.
Moving back to the 2021 chart, North Queensland might be faring a bit better on the ladder if they weren’t giving up so many first half leads, as they sport the biggest increase from first to second half margin. It should also surprise no one that Melbourne and Penrith are the top two teams in either half and their margin barely differs.
But back to the Raiders, let’s delve into some more statistics to see where they sit and try to get an understanding of just why their second halves are so putrid. First up is run metres by team.
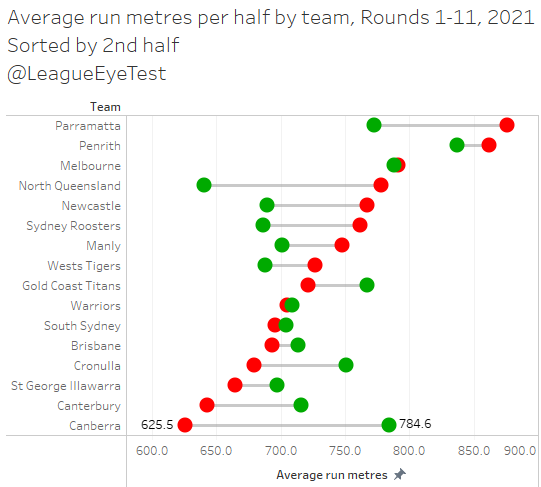
Another woeful chart for Canberra, going from third overall for first half metres to dead last in the second half. Again the largest gap between points. And if you flip things around and look at teams playing the Raiders, it’s a similar story.
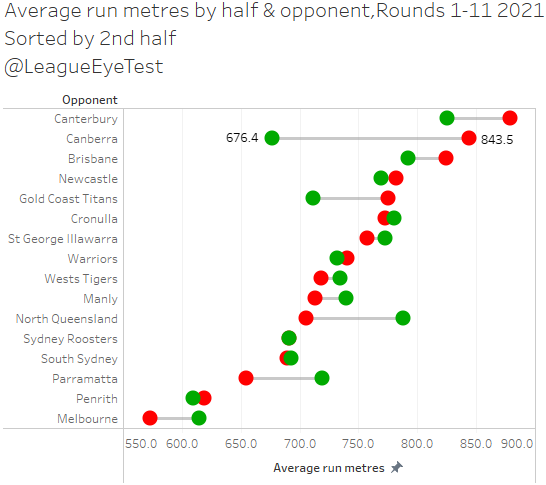
Second most metres given up in second halves, only ahead of the tragic Bulldogs. The sorting of this chart somewhat reflects the NRL ladder just inverted, with the top 5 giving up the fewest run metres per second halves. Again it would indicate the Cowboys could be playing in September if they sorted out the start of games.
Let’s move on to metres per run and see if Canberra is giving up more metres per carry in the second half.
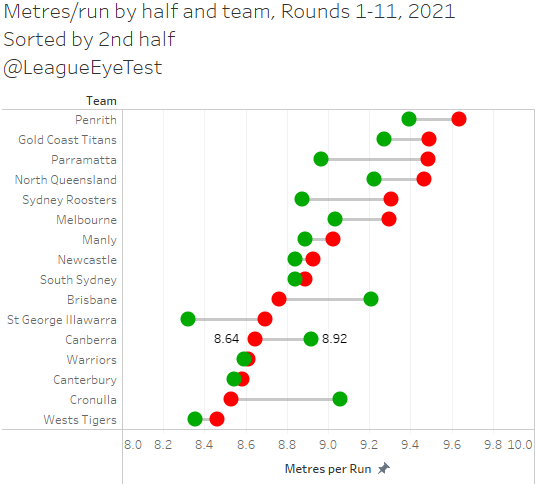
They are, but not to the extent of other teams, at just an extra 0.3m per run. The Sharks fare the worst here, giving up an extra 0.7 metres per run after half time. If you flip the data to look at opponents, teams playing Canberra sit around mid-table.
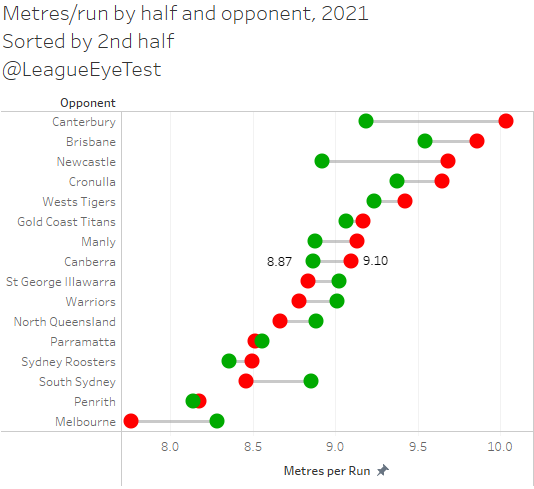
The increase is smaller, from 8.9 to 9.1 but it’s still there although not as concerning as it would be for teams like Newcastle and Cronulla, who can’t hold on to attackers after the break.
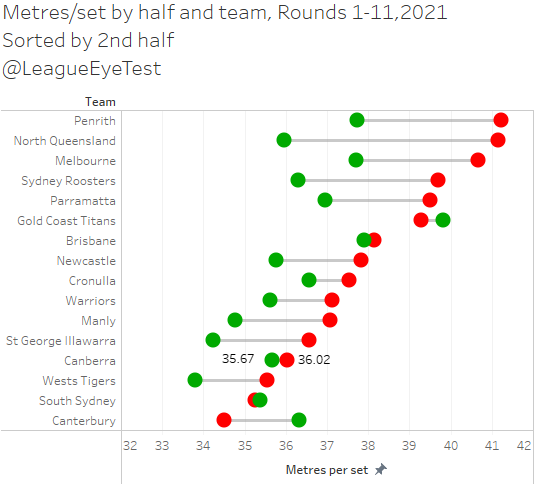
There’s not a lot of change if you look at metres per set. Most teams in the NRL gain more metres per set in the second half, but the Raiders sit fourth from the bottom and have one of the smallest changes from first half to second half.
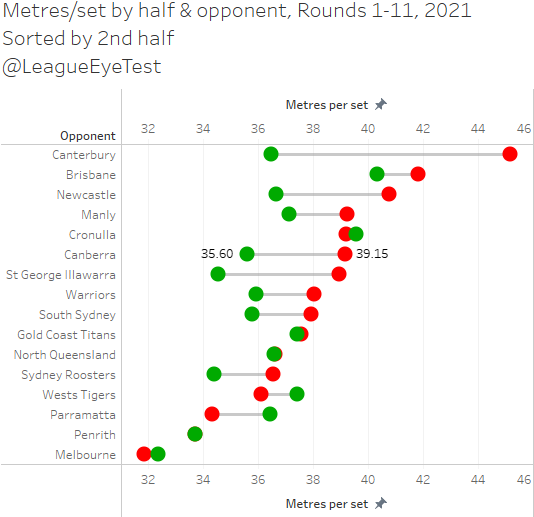
Flipping that chart to look at data by opponent tells the same tale, with Canberra sitting in the wrong half of the ladder and conceding more metres per set than in the first forty minutes, almost four extra metres per set, on par with Newcastle and St George and only ahead of Canterbury.
I’m sure you’re getting the idea now. The Raiders are giving up significantly more metres in second periods and can’t generate it themselves. The bigger issue is their inability to maintain possession and hold onto the ball, making them by far the worst performing club in the NRL for second halves. This last chart summarises their plight well, and it’s all about possession and their inability to complete sets.
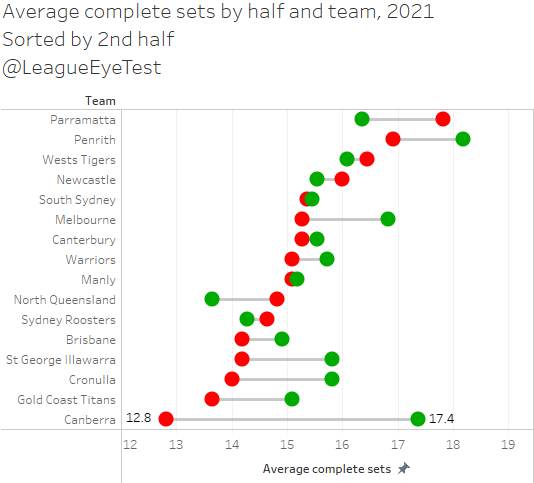
After only trailing Penrith in first half complete sets at 17 per game, the Raiders drop to dead last in complete sets in the second stanza at under 13 per game. Penrith and Melbourne also suffer declines in complete sets, but they’re still in the top half of the competition for that stat in the second half.
You might argue that I’ve stated that complete sets don’t matter, to which I’d reply you’re half right. Completion rates don’t matter, but complete sets do. 90% of 10 is nine, but 70% of 20 is 14. If you can’t control the ball and field position (something I covered last week), you are always going to struggle.
The Raiders second half struggles are mainly due to their inability to hold the ball, and they can’t compete against the increased possession. If it continues at this rate then they will be crowned the worst second half team in the NRL since 2014.
Are teams throwing the ball around more this season?
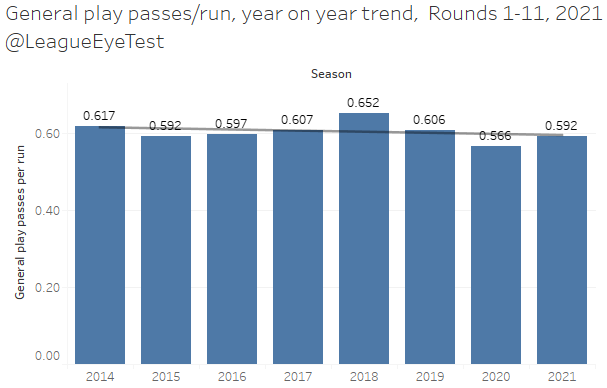
In looking into the Raiders struggles at holding the ball, I started looking into how often teams were passing and offloading this season compared to previous seasons. It turns out the rate of passing is up but very slightly but still below previous years compared to the same point in previous seasons.
The NRL average this season is 0.66 general passes per play the ball. That number doesn’t include dummy half passes, so just add a 1 in front for total passes. Still, that rate is down on 2018 and 2019 as you can see below.
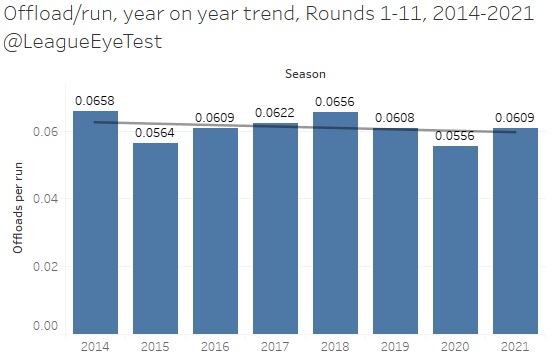
Offloads per play the ball are following the same trend of peaking in 2018 and dropping until a slight uptick this season to just over 0.06 per play the ball.
Given this increase, which teams are driving the changes? Here’ how the sixteen NRL clubs rank using the same rate of general play passes per play the ball.
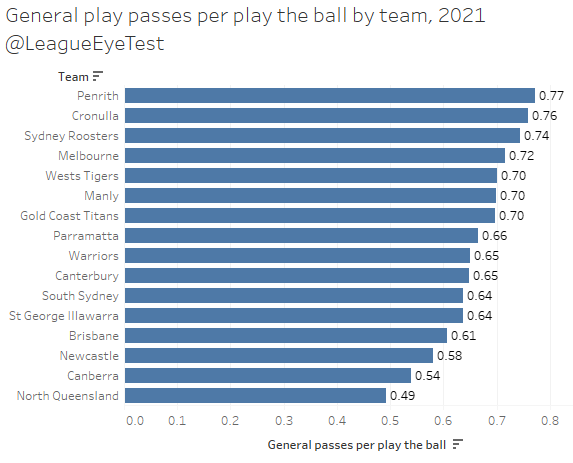
Penrith take top spot with 0.77 passes per play the ball (remember to add +1 for total passes), slightly ahead of Cronulla and the Roosters. At the other end of the scale is North Queensland, passing just 0.49 times per play the ball.
Switching it to an opponent view below, there’s two things that stand out.
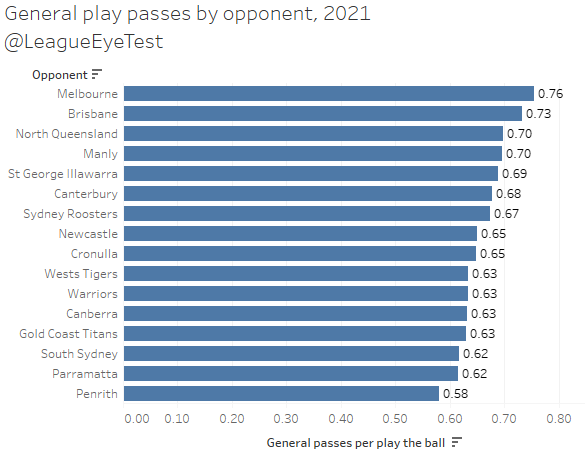
The first is that to no one’s surprise, Penrith and Parramatta allow the lowest pass rate against them this season, although there isn’t much separating second through thirteenth. It appears as if teams are playing extremely cautiously against the Eels and Panthers, with more one out running and trying to play mistake free.
The second part that is probably more surprising is Melbourne allowing 0.76 passes, by far the most in the NRL. Teams either believe they need to move the ball more to unsettle Melbourne’s defensive line, or the Storm are giving them opportunities to do so and are backing their defense.
The year on year change for offload rate tells another story.
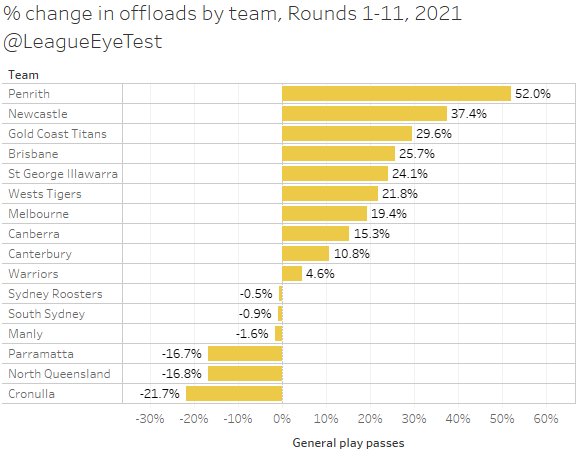
Penrith have focused strongly on promoting the ball and are offloading at a rate 52% higher than last season. And North Queensland have tucked the ball away under Todd Payten, with 17% fewer passes, despite their coach letting the Warriors off the leash last season to promote second phase play, which the Eye Test picked up early on.
Bringing this together, how does it look when you compare passing rates to offload rates? Are teams that throw the ball around also likely to offload more? To check I’ve plotted both passing and offload rates for each club and broken them down into expansive and basic passing, and high and low second phase play. The size of each data point represents total margin for the season to show if it’s successful. Whether or not more passing is expansive or not is an assumption I’m making, and it may not reflect reality, but generally more passes indicates spreading the ball. Anyway here are the results.
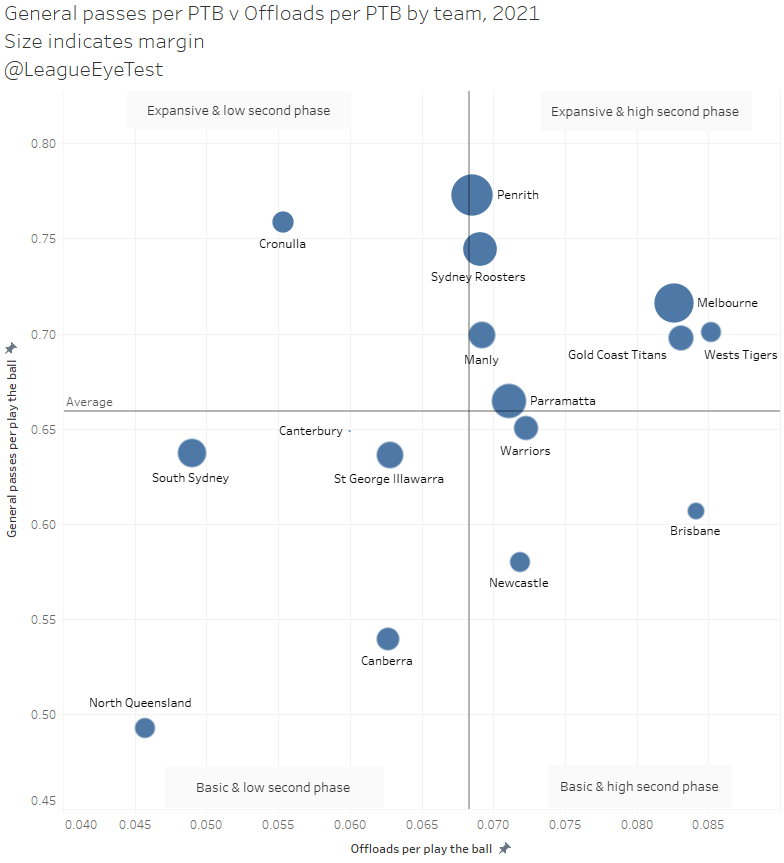
Most of the top eight sides sit in the “Expansive & high second phase play” quadrant, with six of the current top eight dwelling here, indicating that if you’re willing to distribute the ball more and are able to offload then you’re most likely sitting among the more successful clubs. Or it may be that these clubs are the best at exploiting tired defenses and are pushing the ball wider and faster when they have an advantage.
Cronulla sit alone as a team that passes the ball regularly but doesn’t offload at a high rate, while the Warriors, Knights and Broncos all aim to promote second phase play but spread the ball less than the NRL average.
The bottom right quadrant with a basic passing game and low offload rates contains the safe and cautious approaches, which isn’t overly surprising that it is where Wayne Bennett’s Rabbitohs are placed. The risk adverse Bulldogs also reside here (I assure you that’s a data point and not a mark your screen), as do the Dragons and struggling Raiders.
Again, the Cowboys are an anomaly this year, playing an extremely safe brand of rugby league which goes against the free flowing attacking style of football that Payten encouraged at the Warriors last season. It’s a sign of a good coach that he’s modified his style to suit his players, and if it weren’t for some bad opening losses and giving up early leads they’d be firmly entrenched inside the top eight.
Error rate
As mentioned above the Raiders have had a terrible time holding the ball this season, and it shows when you look at individual error rates.
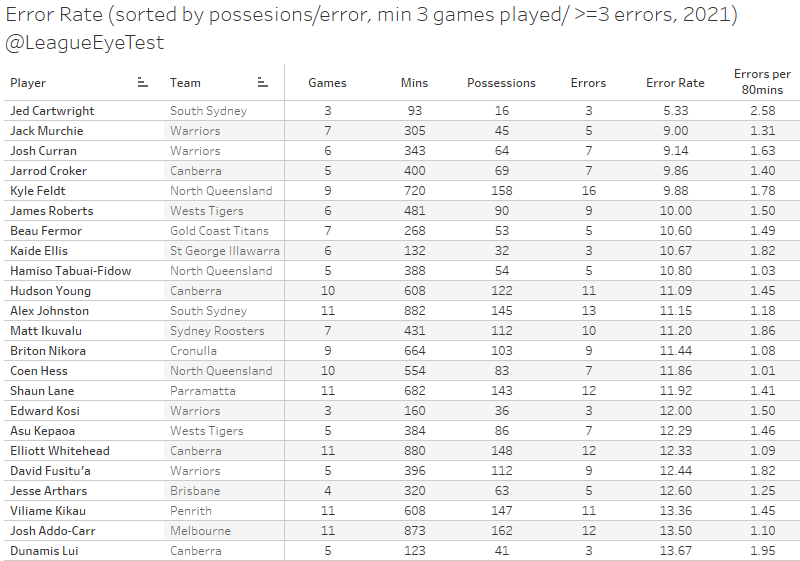
South’s Jed Cartwright sits in first place with three errors in just sixteen possessions, for a rate of one error every 5.33 touches. He’s followed by a pair of Warriors, Jack Murchie at 9.0 and Josh Curran at 9.14.
Next up is Raiders centre Jarrod Croker, who has committed 7 errors at a rate of one every 9.86 possessions. Four other Raiders also feature inside the Top 30, with three of them – Hudson Young, Elliott Whitehead and Jordan Rapana – sporting errors rates lower than 15 and raw error totals in double digits. Meaning not only are the Raiders committing errors at a higher rate, but they’re also being committed by players who touch the ball more frequently. A surefire recipe for disaster.
Tigers cult hero Zac Cini would actually top the chart with 7 errors this season from 34 touches, for a rate of 4.86. Unfortunately, or fortunately if you value the ball, he’s only played the two games and doesn’t meet the games played threshold.
If you enjoyed this post please consider supporting The Rugby League Eye Test through one of the links below.
Scan the QR code or copy the address below into your wallet to send some Bitcoin to support the site Scan the QR code or copy the address below into your wallet to send some Ethereum to support the site Scan the QR code or copy the address below into your wallet to send some Litecoin to support the site Scan the QR code or copy the address below into your wallet to send some Bitcoin cash to support the site Select a wallet to accept donation in ETH BNB BUSD etc.. Donate To Address
 Donate Via Wallets Bitcoin
 Ethereum
 Litecoin
 Bitcoin cash
Support The Rugby League Eye Test
Support The Rugby League Eye Test
Support The Rugby League Eye Test
Support The Rugby League Eye Test
Donate Via Wallets


Brilliant. Would you prescribe this to bench talent levels or style? I could see an argument for either.