A week off was all I needed and I’m back on my bullshit. Or is that the NRL’s bullshit? Stay in your lane, kids.
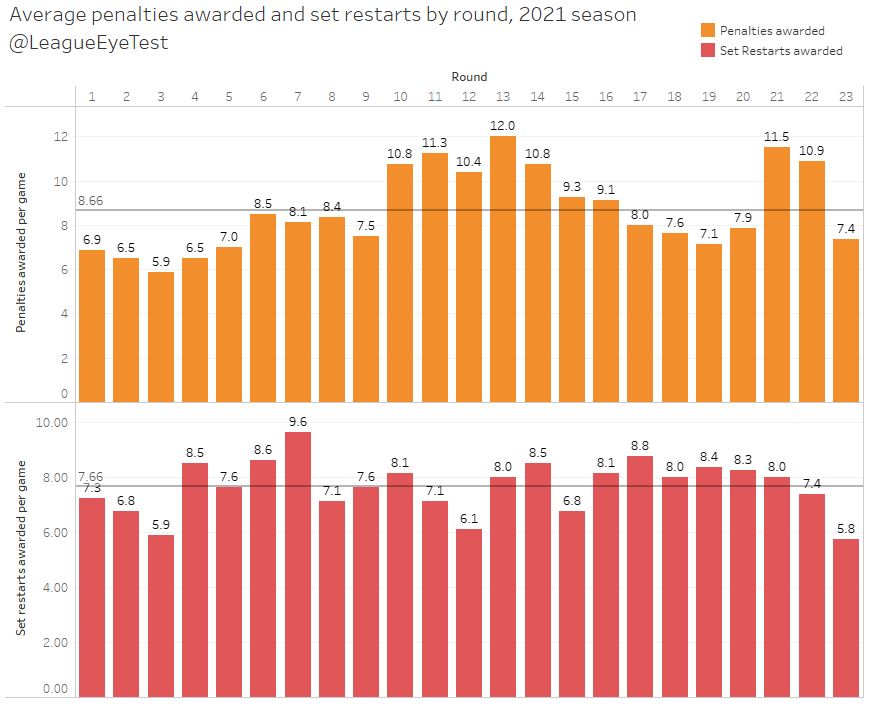
Round 23 saw the equal fewest set restarts awarded in NRL history, going back to the rule being implemented from Round 3, 2020. Just 46 set restarts were awarded, at an average of 5.75, beating the previous (full round) low of 47 in Round 3 which had an average of 5.88. Below is the chart for average penalties and set restarts awarded by round this season.
You will note I said equal fewest, but the round that shares that honour wasn’t mentioned. That’s because it occurred in Round 4, 2020, which was the last round before coaches realised the new rule could be gamed to their advantage.
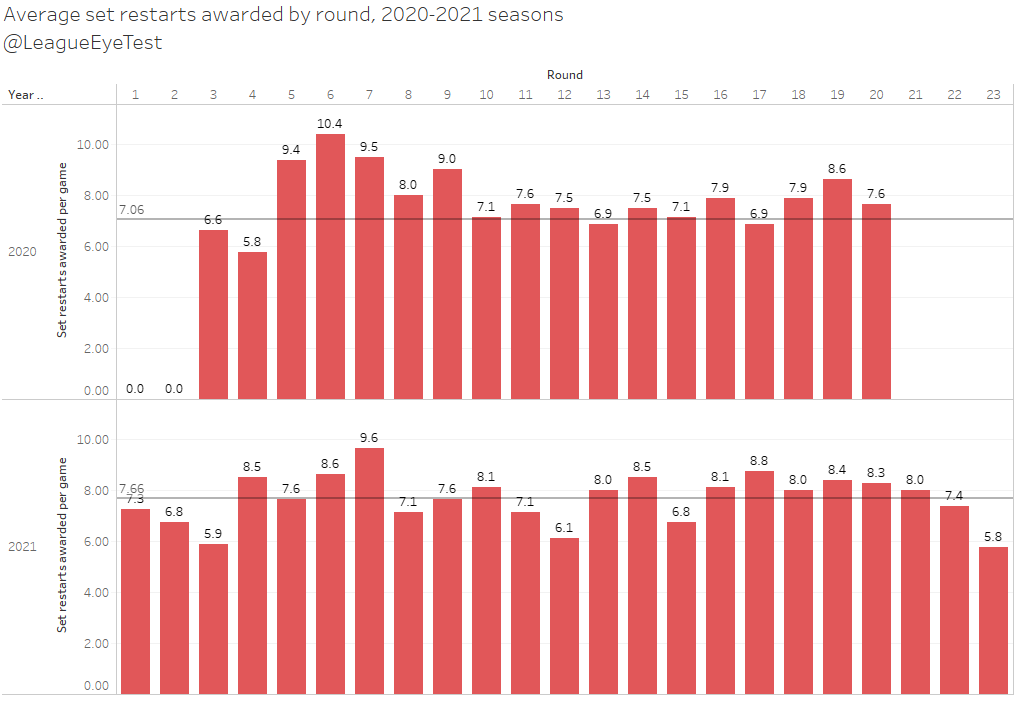
Those three rounds (4 in 2020, and 3 and 23 in 2021) are the only rounds thus far to have an average number of restarts awarded fall under six. You can see below the average of set restarts called per round in 2020 (top row) and 2021 (bottom row), with the three rounds with an average under six sticking out. You can also see the previous 5.8 average in Round 4, 2020 right before the average nearly doubled to 9.4 and then 10.4 in Rounds 5 and 6 of that season.
The fact it’s equal with Round 4 from last season is ridiculous, considering we have six again now being called for being inside 10 metres at the play the ball. This would require me to believe that teams are infringing in the ruck less, which the Eye Test will tell you is a tall tale.
We’ve mentioned previously how set restarts are inconsistently called between halves, rarely called late in games and if so only to losing teams, are only awarding 2.3 extra tackles and are called mostly in teams own halves. The Sydney Morning Herald had a recent story showing data that teams leading don’t win set restart counts.
I can believe that they’re inconsistently applied and there may be some unconcious bias towards losing sides. What I don’t believe is that players are interfereing in the ruck at a lower rate than they were twelve months ago. If anything it’s gotten signifcantly worse.
I’m also not going to draw conclusions on the integrity of referees. Despite being a set restart truther, I feel that the referees are (largely) doing a good job but are hamstrung by some poorly implemented and untested rules that were thrust upon them alongside a 50% reduction in their workforce. And they’re regularly thrown under the bus but their own administration. Given the hand they’ve been dealt they’re doing a great job undermined by some inconsistent interpretations.
The other trend that’s appeared over the past few weeks, which matches up with last round’s record low, is the slow decline of restarts being called over the past month. The average has dropped from 8.4 per game in Round 19 to 7.4 in Round 22 and 5.8 in Round 23.
Still, it’s an interesting trend as we progress towards the pointy end of the season. A more cynical person than myself might suggest that they’re deliberately being downplayed to prevent any drama in the finals. I’d like to see another week or two of declining restarts before saying it’s a larger trend, but I’ll certainly be keeping watch on this moving forward.
One thing we can take solace in is that the six again king has returned. Thanks to Grant Atkins calling just three restarts in the Souths v Penrith match on Friday evening, Gee has now pushed ahead of Atkins for the highest average of set restarts awarded among NRL referees this season. The full chart is below.

Tackle busts and long run analysis
Earlier in the season there was a near regular section on the Eye Test every week talking about how great Brian To’o is. It’s been a while since we looked at those charts, and with the season winding down and To’o on the sidelines it’s a good time to check back and see if he ended up dominating the competition as it looked like he would back in May.
First up is average runs plotted against average tackle busts. This chart is a great way to identify high volume runners of the ball (further to the top of the chart), impact runners (further to the right), or players who do both (the top right). The size of the data point indicates the amount of run metres, the larger the circle the more metres gained over the season.
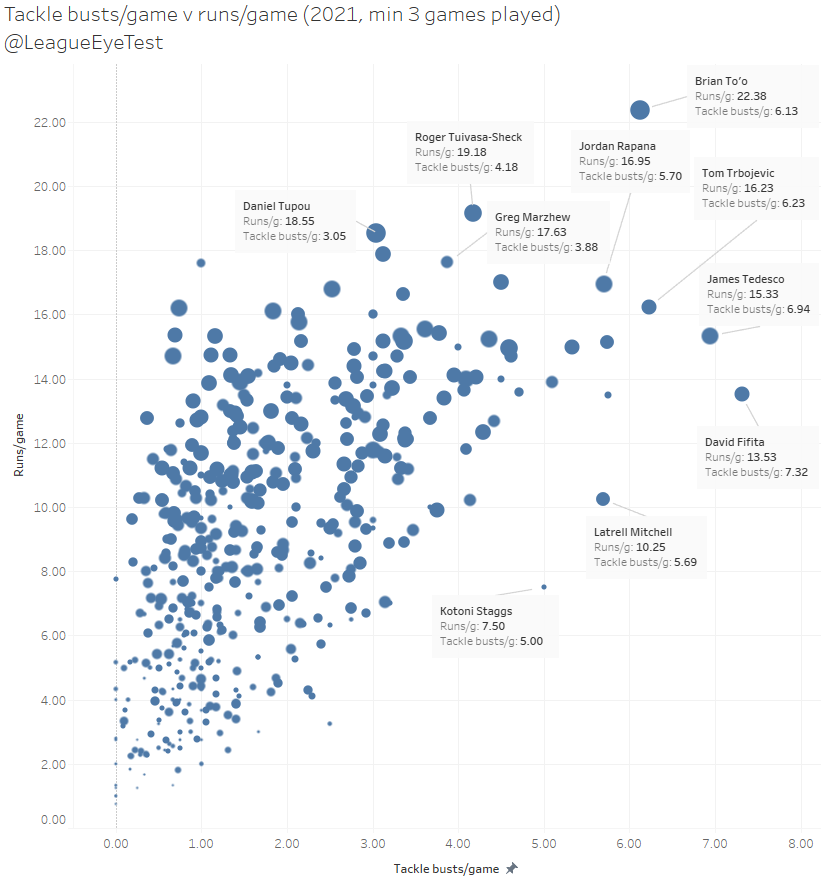
It’s evident here just how dominant To’o was and it’s shame his (regular) season performances were curtailed by a syndesmosis injury a few weeks back. At 22.4 runs per game, he’s at least 3 runs per game higher than his nearest rival, Roger Tuivasa-Sheck. To’o’s 6.13 tackle busts per game place only behind David Fifita, James Tedesco and Tom Trbojevic. That’s incredibly elite company.
It’s also worth noting that Latrell Mitchell breaks just one half tackles fewer than To’o, but does so on more than half as many runs. This is what’s known as picking your spots, and when Latrell picks one, he usually makes sure it counts. Kotoni Staggs isn’t far behind Mitchell, but his 5 tackle busts per game from 7.5 runs occurred in only four starts, which is bordering on small sample size territory.
Moving on to the average number of long runs (more than 8 metres) v average number short runs (less than 8 metres) this season and To’o is still streets ahead. Performances for this are split between interchange and starting spots, which is why David Klemmer appears twice.
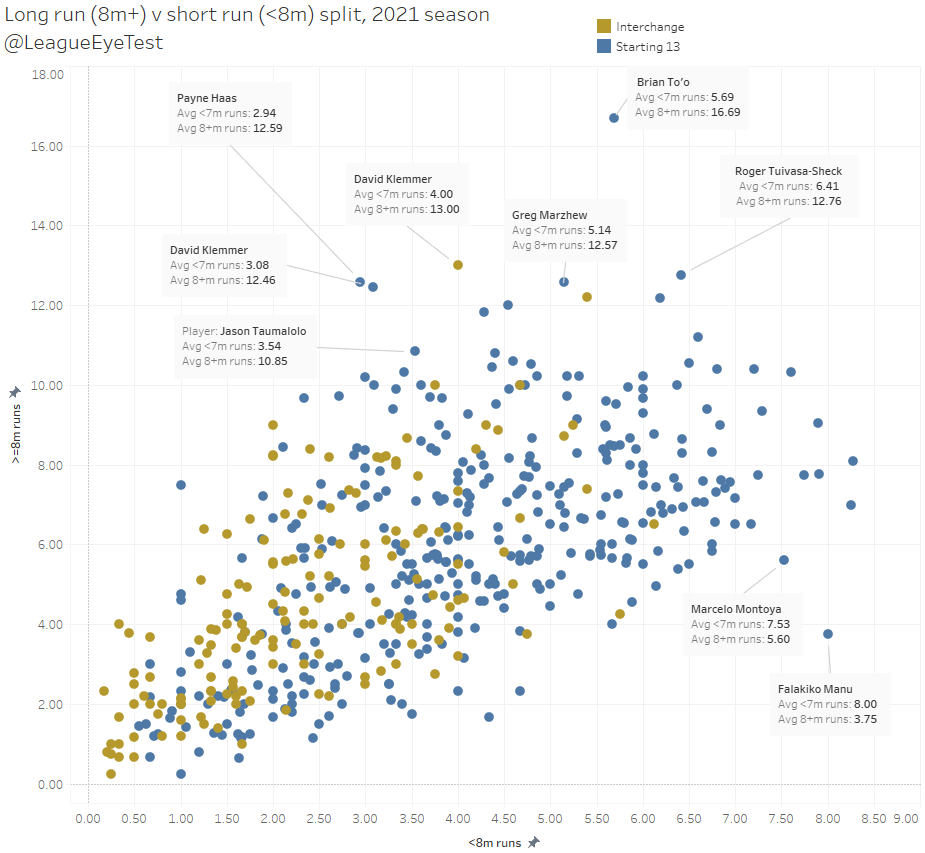
75% of his 22 runs per game pass the eight metre mark, which places him inside the top 30 among all NRL players this season. None of them complete the same volume of runs as To’o though, the closest being Payne Haas, at 82% of his 15.6 runs per game passing 8 metres.
The other big story from this chart is just how much of a down season Jason Taumalolo is having. This chart used to be owned by the Cowboys backrower, who averaged 15+ runs per game over eight metres in 2020. This year that has dropped by almost a third, down to 10.8 per game, with his sub eight metre run average nearly identical.
Regular Eye Test readers will remember Marcelo Montoya being possibly the least effective runner in the NRL last season. This year he’s improved to 45% of his runs over 8 metres, up from 41% in 2020. He’s not even the worst outlier anymore, that crown has been taken by Bulldogs rookie Falakiku Manu, who passes eight metres on just 32% of his runs.
Is Greg Marzhew in for a huge 2022?
One last name to note on the previous runs v tackle bust chart is the Titans Greg Marzhew. His numbers sit near the top at 17.6 runs per game and 3.9 tackle busts in his 8 appearances this season. Why am I bringing this up?
Because if you look at the same chart for 2020, his numbers aren’t that different from To’o, as seen below.
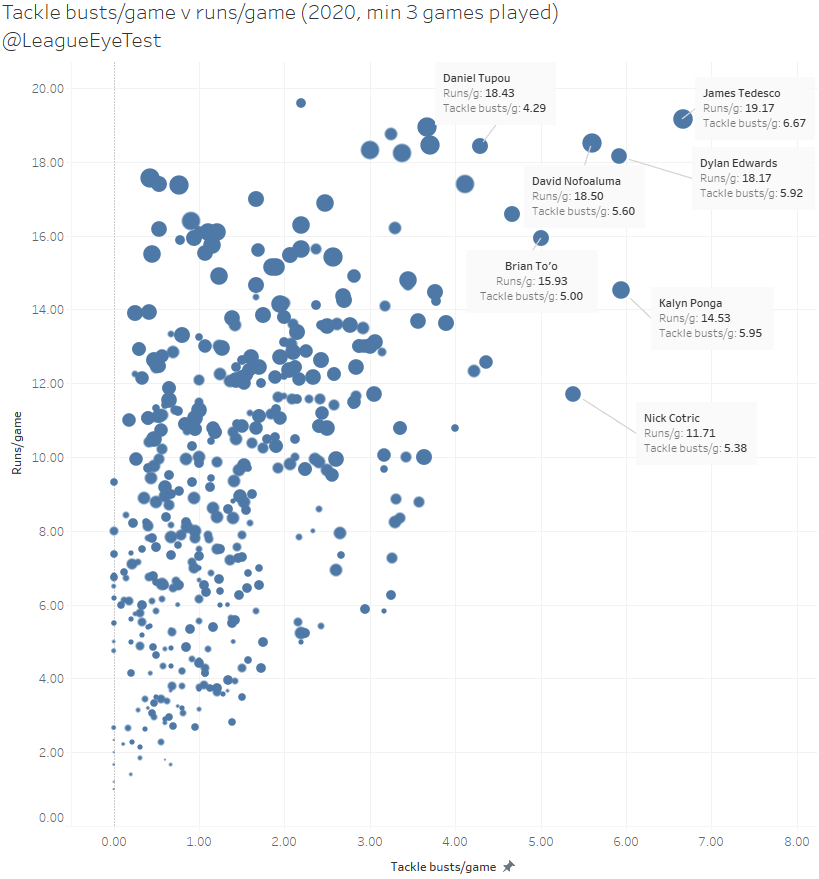
To’o averaged 15.9 runs and 5.0 tackle busts in 2020, which is about 2 runs and 1 tackle bust fewer than Marzhew this season.
You could also bring up their similar physical dimensions, but the similarity in numbers doesn’t stop there, because when you look at the percentile ranks of To’o for 2020 compared with Marzhew for 2021 compared to all outside backs from 2014-2021, the similarities continue.
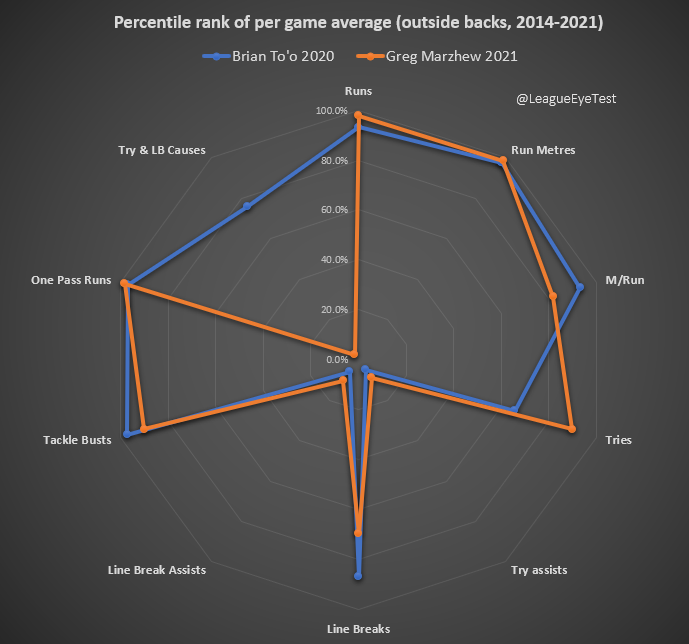
Their radar chart shows a very similar profile in per game averages for runs, metres, tries, line breaks, tackle busts and one pass runs. In 2020, To’o sat above the 90th percentile for runs, run metres, metres per run, tackle busts and one pass runs. Even their try assists and line break assists sit in similar areas, which would be expected playing on the wing.
Marzhew in 2021 sits above the 90th percentile for runs, run metres, tries, tackle busts and one pass runs. He’s actually in the 98th during that time span for percentile for runs, run metres, one pass runs, which sits him firmly among the game’s elite.
There’s one massive difference between them though and that’s defensively, with Marzhew which probably should be expected. To’o has been an integral part of one of the best defences in the NRL over the past two seasons, while Marzhew sits on the outside of a team that has given up some very large scores of late. As always there’s context needed for every statistic and these try and line break causes are usually more a factor of team defense than necessarily any individual deficiency. They’re indicative rather than representative.
It’s unlikely that Marzhew has a break out season in 2022 like To’o is having this year, especially with the chasm of talent between the Panthers and Titans. Although if you look at with that gap in ability in mind, maybe Marzhew is actually having an even better year than previously thought? Either way, if he continues his current run of form he may end up as exciting to watch in 2022 as To’o has been this season.
If you enjoyed this post please consider supporting The Rugby League Eye Test through one of the links below.
Scan the QR code or copy the address below into your wallet to send some Bitcoin to support the site Scan the QR code or copy the address below into your wallet to send some Ethereum to support the site Scan the QR code or copy the address below into your wallet to send some Litecoin to support the site Scan the QR code or copy the address below into your wallet to send some Bitcoin cash to support the site Select a wallet to accept donation in ETH BNB BUSD etc.. Donate To Address
 Donate Via Wallets Bitcoin
 Ethereum
 Litecoin
 Bitcoin cash
Support The Rugby League Eye Test
Support The Rugby League Eye Test
Support The Rugby League Eye Test
Support The Rugby League Eye Test
Donate Via Wallets