A few weeks ago, I debuted Eye Test Expected Points (ETxP) on the site, with the intent to use it for analysing team performance throughout the season. Ideally it would give us an indication of which teams are outperforming or underperforming the expected points from their field position as a proxy for how a team is travelling.
If you need a refresher on ETxP there’s a substantial post on the site going into detail of how these expected points are calculated and how they can be applied, as well as some possible drawbacks from using this method.
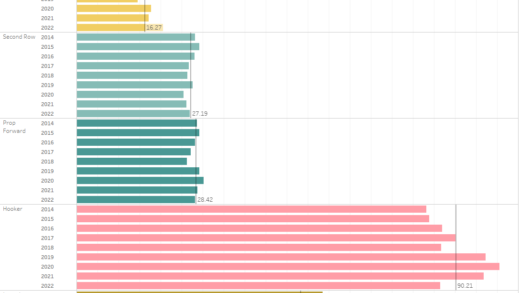
For those of you, much like myself, who are time poor here’s the elevator pitch – I’ve broken down a rugby league field into 4 metre by 4 metre squares, and for each individual possession (not set) inside a particular 4x4m zone we’ve assigned a point value based on the historic probability of scoring points from that location. From that we determine which teams are over or under performing expectation.
Need an even shorter pitch? Look at it as how many points an average team would score if they had the exact same field position and possession.
If you follow the world game, you’ll know about xG (expected goals) and how it is transforming analysis in football. The theory behind ETxP is similar. If you’re new to the concept, this short video below is a great explainer.
With that in mind, how did NRL teams fare by expected points in Round 1? The clubs with an edge in total ETxP for their matches won 5/8 games this weekend, that 62.5% is in right line with the historical winning percentage of 62% for teams with higher value field position. There was also what will likely be the lowest combined negative percentage under average game of the season this round.
We can also look at the percentage that teams scored over or under their expected total. For reference, here’s a breakdown of how every team performed against their ETxP average for 2021.
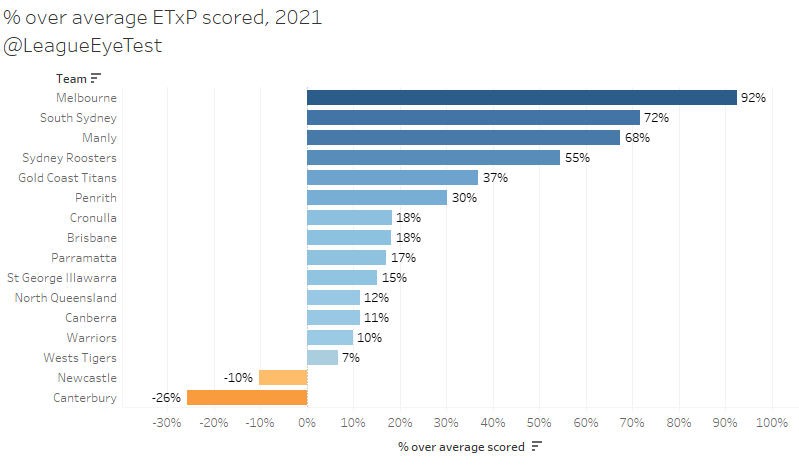
And here’s the same chart again, just for Round 1 2022.

There’s some big changes from last season and some teams had some extremely worrisome debuts (*cough* Souths). However we are talking about very small sample sizes here so anything you can draw out of it is indicative and not representative. I’d also mention the caveat that just over performing expectations doesn’t always guarantee a win and the percentage needs some context of field position.
Outscoring good field position is usually good, under performing with good field position is usually bad, and not having good field position to begin with is usually bad, unless you’re Melbourne or Manly and can manufacture points from nearly anywhere on the pitch.
A perfect example came on Sunday with the Gold Coast Titans +179% on their expected points in their game against the Eels. The problem was that their expected points total was just 10.44, and the Eels had an ETxP of 22.72 which they beat by 41%. Simply scoring more than expected isn’t going to help if you’re allowing more points over what an average team would in the same situation. Being able to control field position with and without the ball is important.
Since we’re early in the season and don’t have enough data for trend analysis, let’s take a look at the minute-by-minute breakdowns of each game from the opening round. As the season progresses, ETxP analysis will move more to percentage over average for the season or last 5 games, and analysis of individual games will only occur when something interesting pops up.
Penrith v Manly
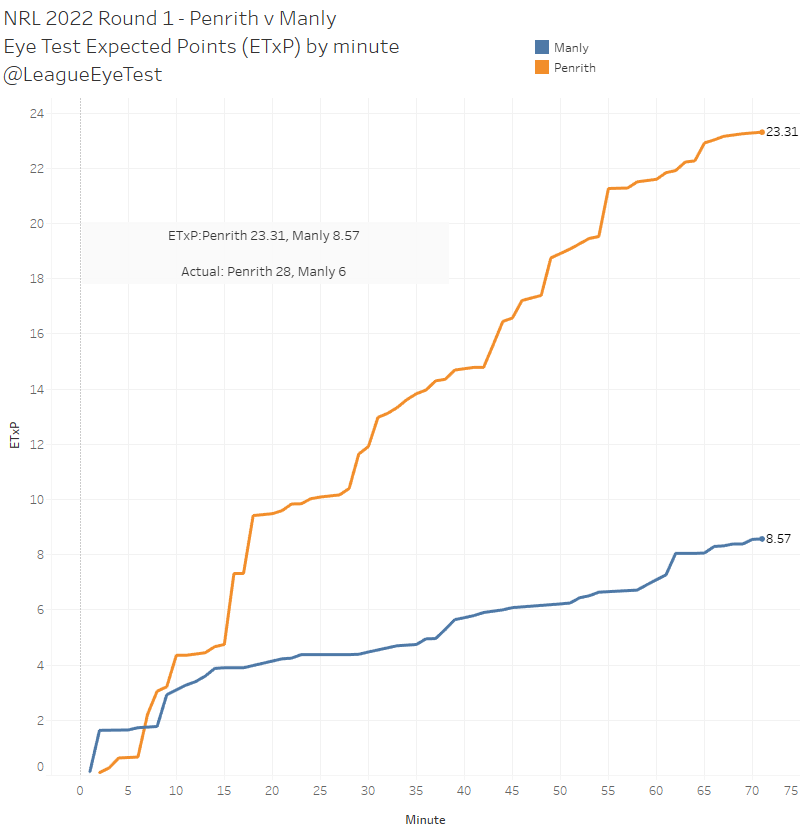
The first game of the season was somewhat of a letdown as the Panthers romped away with the game, beating the much favoured Manly 28-6. The score is reflected in the expected points for both sides as well. The game looked to be close based on field position until the 15th minute when Penrith took the reins and ran away with it.
Penrith has been historically elite at converting their field position to points and this game was no different as they ended up +20% on an already high expected point total. At the other end of the field the Sea Eagles were unable to get the ball downfield and routinely saw Daly Cherry-Evans kicking the ball on the last from well into his own half of the field.
It wasn’t until late in the game that Manly had enough quality ball to push above the eight-point mark in ETxP, but then only added another 0.57 ETxP in the final 15 minutes and ended up -30% against expected.
Interestingly the largest margin and only real blowout of the weekend came from this opening match, where set restart king Adam Gee partied like it was 2021 on route to awarding nine set restarts. The combined total of the rest of the round was eighteen, and six of those were awarded by Ashley Klein in the Brisbane/Souths game.
Those nine set restarts on Friday evening was more than 146 games in the 2021 season, despite being able to award one in just 60% of the field in 2022.
But it wasn’t the rules, there’s always been bad teams.
Canberra v Cronulla
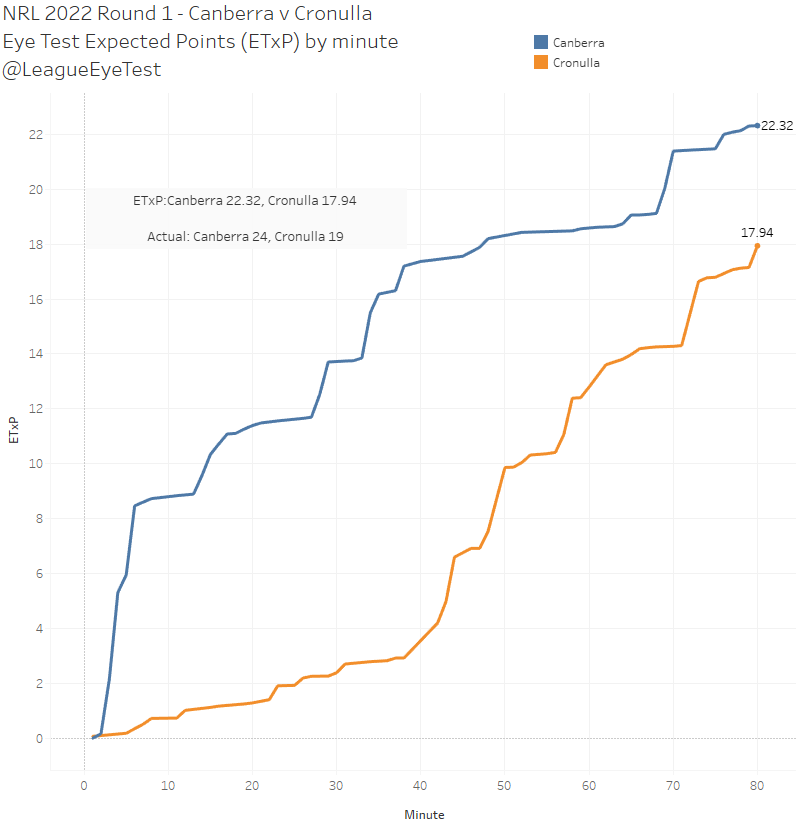
After the blowout in the first game, the early Friday night game produced a much closer game that was in the balance until the final minutes. Looking at the ETxP chart for the game, the Raiders (+8% on expected) ability to put points on the board early was on the back of some high value field position, and they were able to keep Cronulla (+6% on ETxP) out of the same high value possession until just before half time.
But then the shackles were off, and the Sharks found their groove. Here’s the same ETxP chart for this game but only showing the second half.
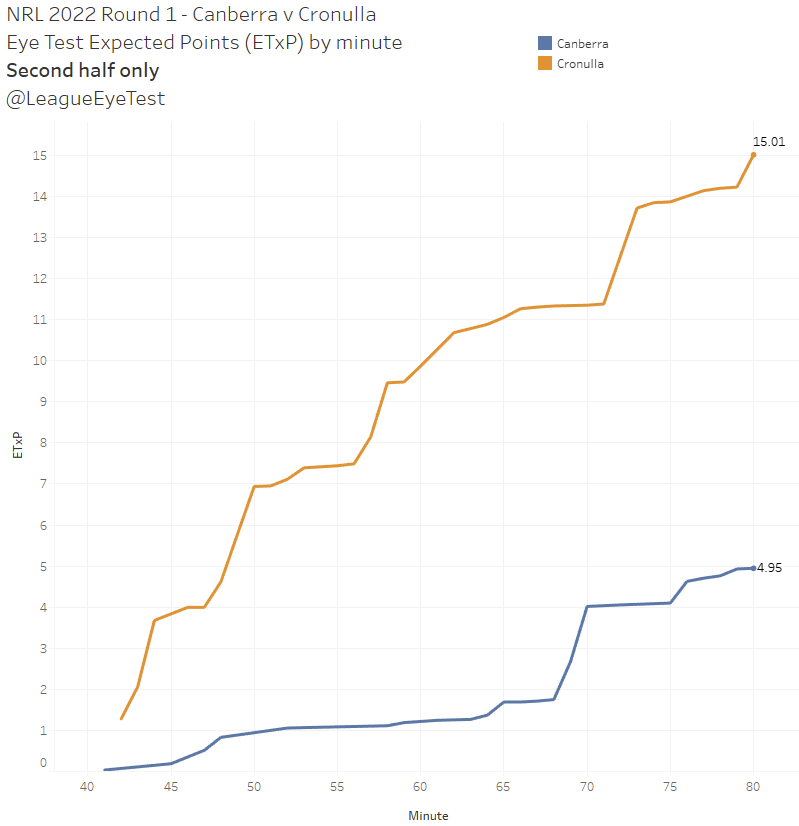
Just before the half the ETxP was 17.2 for the Raiders to 2.9 for the Sharks. The tables turned in the second half though with Cronulla having most of the field position, leading the Raiders 15.01 to 4.95 in ETxP. They managed to claw back a 18-6 deficit to a 19-18 lead before allowing a late try to Hudson Young. A faster start next round against the Eels will be needed to ensure they don’t fall into a similar deficit.
Brisbane v South Sydney
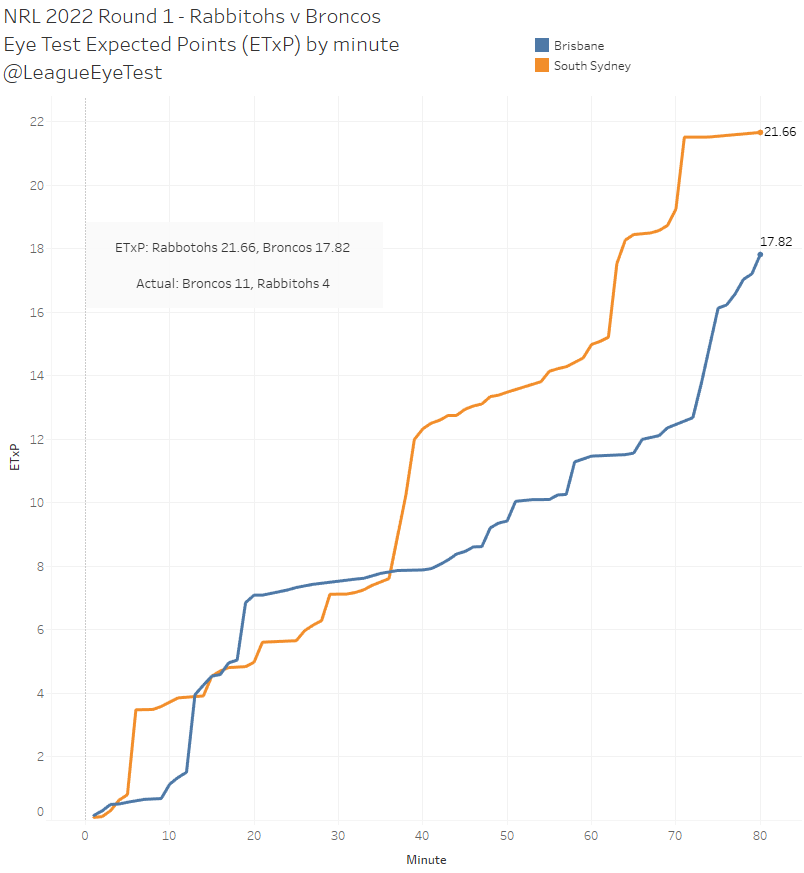
The first major upset of the season and one that I’m sure Souths and Jason Demetriou would like to have back. The Rabbitohs were unable to convert any early possession inside the Broncos half whilst Brisbane took the lead at the half on the back of an Albert Kelly intercept, which is a low value in expected points.
Souths had by far the better field position for most of the second half but a number of factors including an apparently immobile and disinterested Cody Walker and his half partner who looked like he’d never met Walker before resulted in the Bunnies failing to capitalize on some excellent field position.
They had three sustained periods with high value possession after the 30th minute, one just before half time, another in the mid-60s and another at the 70th minute but failed produce any points from those sets and ended up -82% below average, the lowest % under average of the round.
That’s not to say the Broncos were much better, scoring -38% fewer points than a team with the same field position and possession would have during the match. From the 70th minute they had by far the better field position of both sides yet could only muster a Kurt Capewell field goal to ice the game. Hopefully things improve this week with the return of Adam Reynolds.
Sydney v Newcastle

The second major upset in a row from the opening round, but this one was the complete opposite of the Souths/Brisbane game that preceded it. The Knights dominated ETxP over the course of the whole game and never trailed based on the value of their field position.
Even more importantly for Knights fans, they were +10% on their ETxP score, something they were unable to do in 2021 where they finished second last in the NRL at -10%.
Just as impressively was their defense against a high-powered Roosters team, conceding 62% fewer points than expected. Such a number would usually indicate a strong defensive performance and will be interesting to see if Newcastle can continue this against the Tigers in Round 2. It’s very early days but this didn’t look like the Knights of yore. Or you know, yesteryear.
New Zealand v St George Illawarra
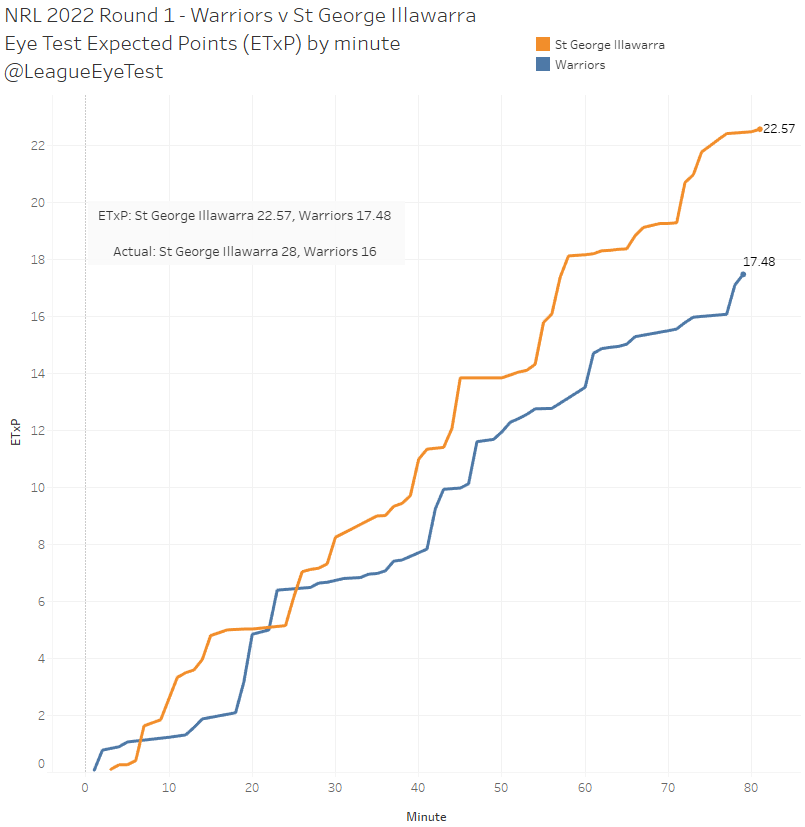
This game was relatively close (especially compared to last season) until the last 20 minutes and the expected points reflects that. The Dragons outpaced their ETxP (+24%), whilst the Warriors were slightly below their expected output (-8%) based on where they had the ball. Given the Dragons domination of possession, especially in the second forty minutes (60% to 40% for the Warriors) the divergence in their ETxP lines and the final result wasn’t that surprising.
Melbourne v Wests Tigers
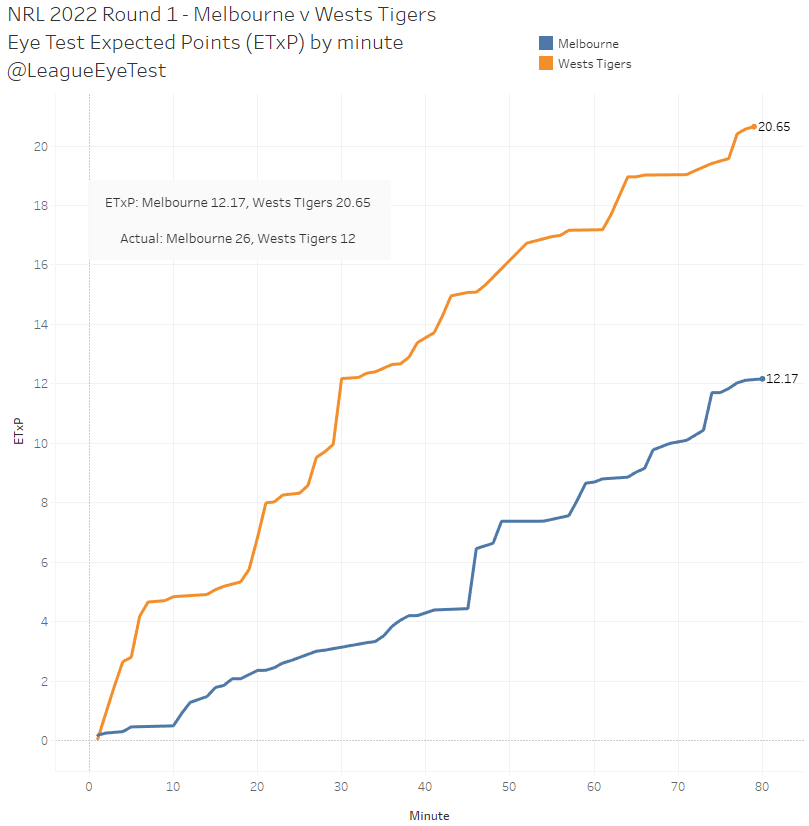
Another case of the Tigers (-42% on expected) being unable to finish a game they should have won. By ETxP they led the whole game, highlighting just how much quality field position they had and how little they afforded Melbourne (+114% on expected).
But as has been the case for a few seasons, when the game was winding down the Tigers were unable to take advantage of their possession and allowed Melbourne to sneak in four second half tries from relatively low value field position. Some of it is (bad) luck, some of it is execution. Again like the Knights, this didn’t look like the Tigers of the last decade and there were some very positive signs. A game to focus on the process over the outcome.
Parramatta v Gold Coast
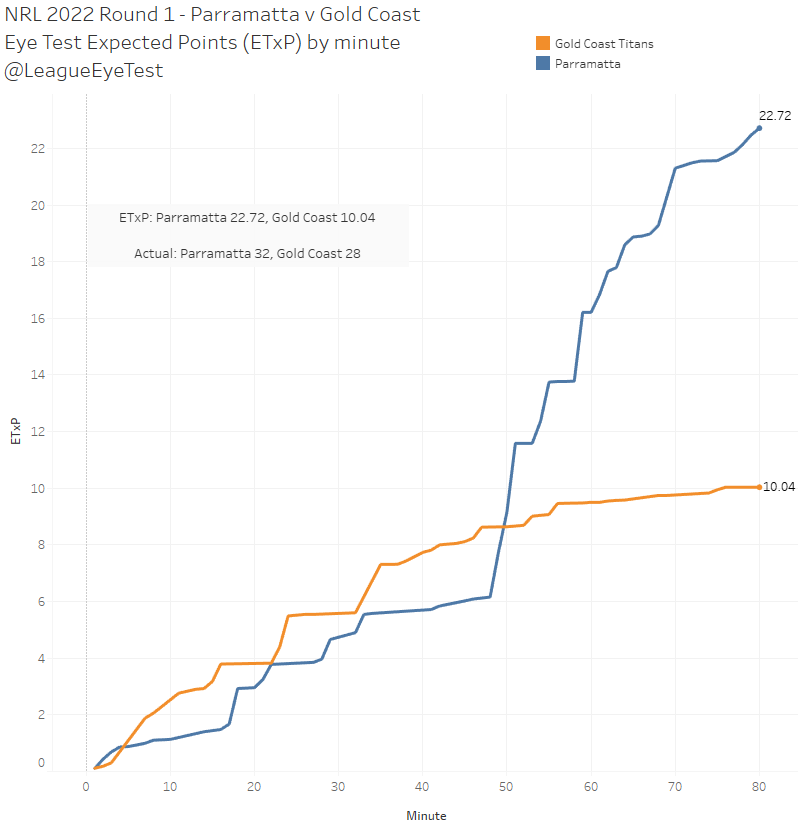
After a proliferation of points in the first half, both teams shut up shop and there was only one try and a handful of goals scored after intermission. The Eels (+41% on expected) certainly look to have had the bulk of field position after the 48th minute whilst the Gold Coast were unable to sustain any meaningful field position after the long break. Maybe trying to taunt the King on his home turf wasn’t the best idea?
That said, they still vastly outperformed their expected points, at a whopping +179% thanks to a number of first half tries. Unfortunately, just outdoing expected points isn’t enough to guarantee a win.
The difference in field position can be seen from the divergence in ETxP lines in the chart above. This is also borne out in the tackled inside 20 metre stats – Parramatta led the Gold Coast 26-3 for tackles inside 20 metres in the second half alone and 34 to 17 for the whole game.
Canterbury v North Queensland
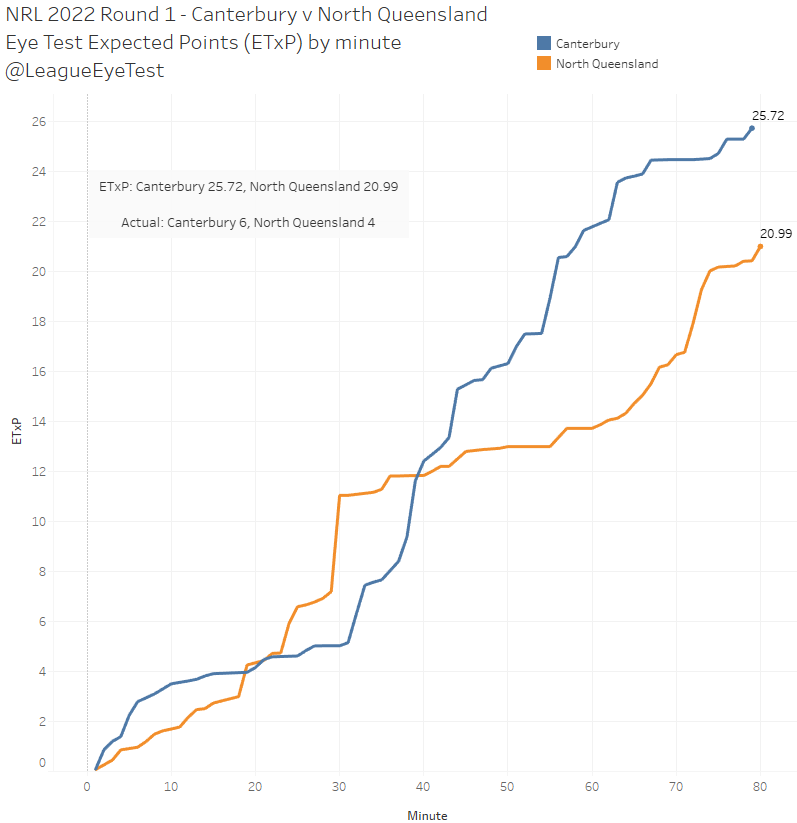
The less said about this game the better. Both teams under performed their expected points by significant amounts (Canterbury -77%, North Queensland -81%) and this should easily be the highest combined percentage under for the season.
If you enjoyed this post please consider supporting The Rugby League Eye Test through one of the links below.
Scan the QR code or copy the address below into your wallet to send some Bitcoin to support the site Scan the QR code or copy the address below into your wallet to send some Ethereum to support the site Scan the QR code or copy the address below into your wallet to send some Litecoin to support the site Scan the QR code or copy the address below into your wallet to send some Bitcoin cash to support the site Select a wallet to accept donation in ETH BNB BUSD etc.. Donate To Address
 Donate Via Wallets Bitcoin
 Ethereum
 Litecoin
 Bitcoin cash
Support The Rugby League Eye Test
Support The Rugby League Eye Test
Support The Rugby League Eye Test
Support The Rugby League Eye Test
Donate Via Wallets