
Round 3 of the 2022 NRL season gave us one of the worst executed games in recent memory on Friday evening when the Warriors squeaked home against the Tigers. The less said about the final 10 minutes of this game the better, with one particular halfback (let’s call him L. Brooks – wait that’s too obvious. Let’s go with Luke B) throwing two ill advised passes inside his own 40 metres and turning the ball over both times despite only trailing by a single score.
This brought out the old trope of “there’s not enough players to support 17 teams”, despite the fact Melbourne consistently find new first grade players hiding in plain sight and Parramatta plucked 28-year-old Makahesi Makatoa out of NSW Cup and he’s now firmly entrenched in their 17.
Anyone who has watched NSW or Queensland Cup games recently would attest to that statement being inherently false. Even just focusing on NRL clubs, casting your eye over both team lists on Friday in the Warriors/Tigers game, shows an incredible amount of talent, especially young talent, sprinkled across both clubs. What they’re regularly missing proper development, execution and making the right decisions. This likely points to the ability of the coaching staff to get the best out of their squads.
Which led me to think about evaluating coaches using the Eye Test Expected Points model. If we look at which coaches were scoring more or fewer than expected, and conceding more or fewer than expected, would it identify any coaches who may have been unlucky during their tenure? Could it show some coaches who have the ability to get the best out their teams despite results going against them?
If you’ve not kept up with the Eye Test on twitter, you’re probably doing the right thing because that app is a cesspool at the best of times. However, I did make the announcement last week that ETxP is (unfortunately) being shelved indefinitely due to the data source I use no longer containing enough information to calculate it.
It’s disappointing but one of the unfortunate realities of using someone else’s data. If that data were to return ETxP could be resurrected quite easily, so hopefully one day that might happen.
Just because I no longer have current season data from Round 2 onward doesn’t mean we still can’t go ahead with some of the analysis I’d planned this season. The first is looking at how coaches performed over a longer period of time than a season. The ETxP explainer (well worth a read if you haven’t looked at it already) and Round 1 2022 recap will give you a good idea of how teams have performed historically and over the opening weekend of this season.
But what if we looked at an extended period of time and coaches performances irrespective of the team they were leading? Does coaching performance translate across teams? Obviously some of this is influenced by players available but looking over a longer period of time should hopefully limit some of that bias.
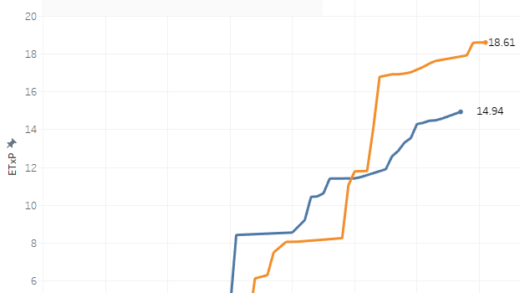
Let’s look at the percentage scored over expected for all NRL coaches who have lasted at least 10 games since 2016. Below is the chart of each coach’s percentage above or below expected during that time period, of which +9.7% was league average. Some of that is due to the 2021 season (which boy looks pretty ridiculous in hindsight given how good the football has been this season). If you take out 2021 the league average is +6.8%.
But back to the analysis, here’s the chart for percentage scored above average by coaches (higher is better).
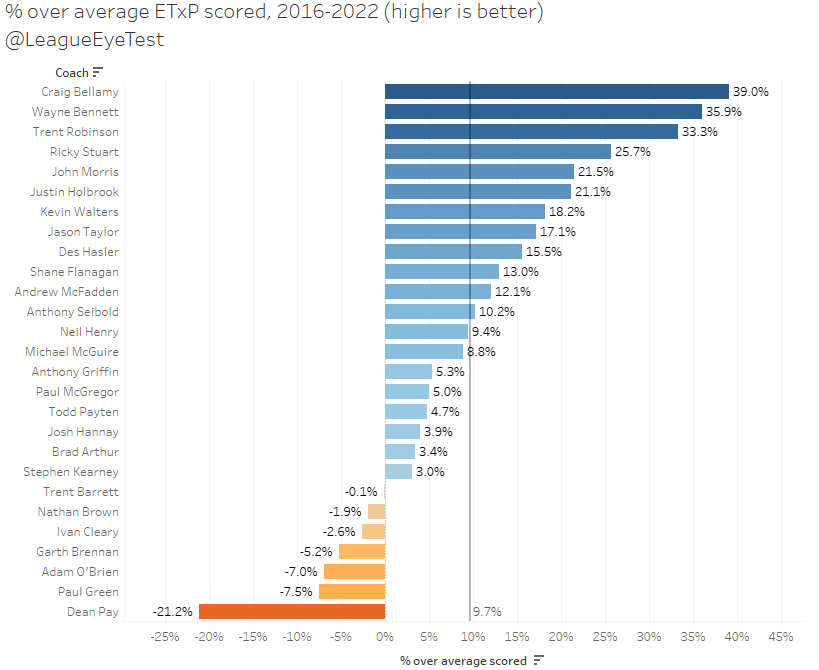
Anyone with the remotest interest in the NRL wouldn’t be surprised by the top three, with teams coached by Wayne Bennett, Craig Bellamy, Trent Robinson all scoring at least one third more than expected over the course of 110+ games during this time period. Raiders coach Ricky Stuart isn’t far behind the top three either at +25.7% scored over expected.
What might be surprising to some is John Morris coming in 5th with +21.5% scored over expected, only well ahead of the man who replaced him (Josh Hannay below league average at +3.4%), but it’s also ahead of premiership wining Sharks coach Shane Flanagan (+13%).
At the bottom end of the scale, Dean Pay is in a league of his own with the Dogs that he coached scoring at a disgraceful -21.2% below expected. Current Canterbury coach Trent Barrett basically scores what is expected of his sides, sitting at -0.1%, which is fine in a vacuum. But if you recall the league average of +9.7% mentioned previously it looks a lot worse and is only ahead of six other coaches during that period, which includes Pay.
Ivan Cleary might seem surprising on this list sitting fifth from the bottom but there’s a few factors at play. The first is that it includes his stint with the Tigers, where his scoring was -4% on expected, whilst his Panthers run sits at 0.0%, or right on expected.
Which brings me to the other factor – the expected points are based on values assigned to field position. If a team has excellent field position and scores from it, then they’re like to match or only slightly vary from their expected points output. Craig Bellamy ends up at +39% as the Storm routinely score from low value field position, whilst the Panthers generally play a possession game and put themselves into strong field position which they’re able to convert into points. It’s why looking at percentage over expected in isolation is a good guide but doesn’t always tell the true story (very few statistics will).
Now we’ve seen which coaches can outscore their expected totals, what does the defensive side of the equation look like? Are the best defensive teams the ones who also come out on top here? Let’s flip the above chart and look at points over expected conceded by coaches (lower is better).
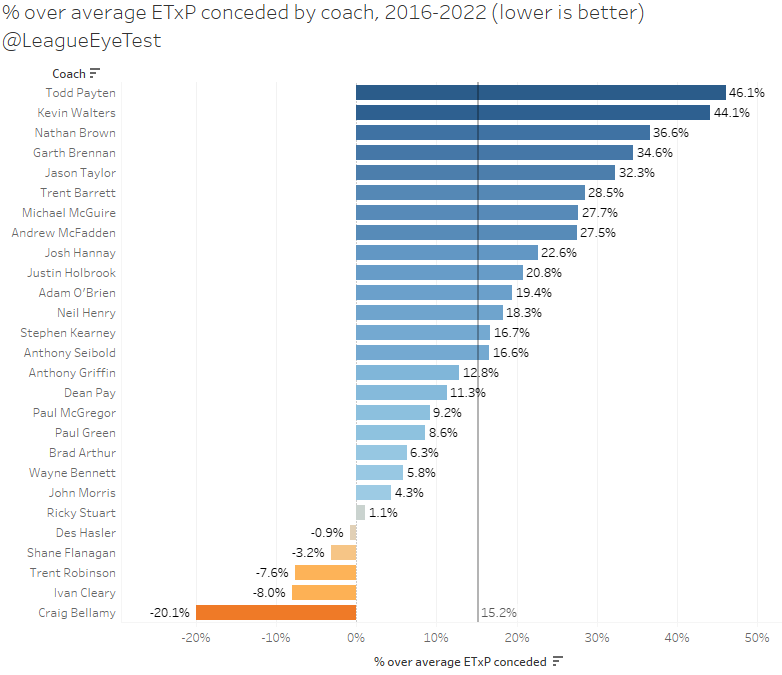
The bottom end of the scale is where the elite coaches sit, and it’s not a shock to see Bellamy at -20% under expected, or Cleary (-8%) and Robinson (-7.6%) in the next two positions. Other coaches with success over this period – notably Flanagan and Des Hasler – also have negative points conceded under expected, while Ricky Stuart sits just over expected at +1.1%.
Again, though John Morris sits in the in upper echelons of NRL coaches in the past half decade conceding just +4.3% over expected, well below the +15% league average conceded since 2016. His replacement Hannay allowed +22.6% over expected, although his predecessor Flanagan did have a stronger defensive tenure at -3.2%.
At the other end of the scale there’s some ugly looking numbers for quite a few current NRL coaches, albeit with some caveats. Todd Payten (+46% conceded) and Kevin Walters (+44%) conceded are comfortably ahead of rebuild merchant Nathan Brown at +36%, however both Payten and Walters suffer from having coached in the one-sided points fest that was 2021. If you take the 2021 season out of Payten’s results, he ends up at a more respectable +21% from 14 games.
Michael McGuire’s defensive numbers with the Tigers aren’t pretty either, having gone from +9% in 2016 with Souths to +18% in his first year with the black and gold and a woeful +56% in 2021.
Justin Holbrook’s numbers in attack aren’t too bad with +21% scored over expected sitting him sixth among all coaches with at least 10 games during this time frame. Yet as Saturday’s capitulation to the Raiders showed, it’s not that part of the game that Holbrook and the Titans have struggled with. Defensively he has the ninth worst record with +20.8% more points conceded than expected, which is worse than the Stephen Kearney and the much-maligned Anthony Seibold (whose numbers were actually right on average). If Holbrook was coaching in Sydney the media would be on his case more than McGuire, and you have to wonder how many big leads Holbrook’s team can bottle before a change will be made.
Canterbury’s Barrett couples his teams below average ability to score points with an above average tendency to concede them, giving up 28% more points than a team defending the same field position would be expected to. Taking out his 2021 doesn’t make as much as a difference as it did for Payten though, as he was still conceding +22.5% more than expected before last season.
To tie this all together we can plot the variance from points scored and points conceded to group coaches into four quadrants – above average attack and defense, above average attack and below average attack above average defense and below average attack and below average attack and defense. This chart is below and highlights where the coaches sit relative to others.
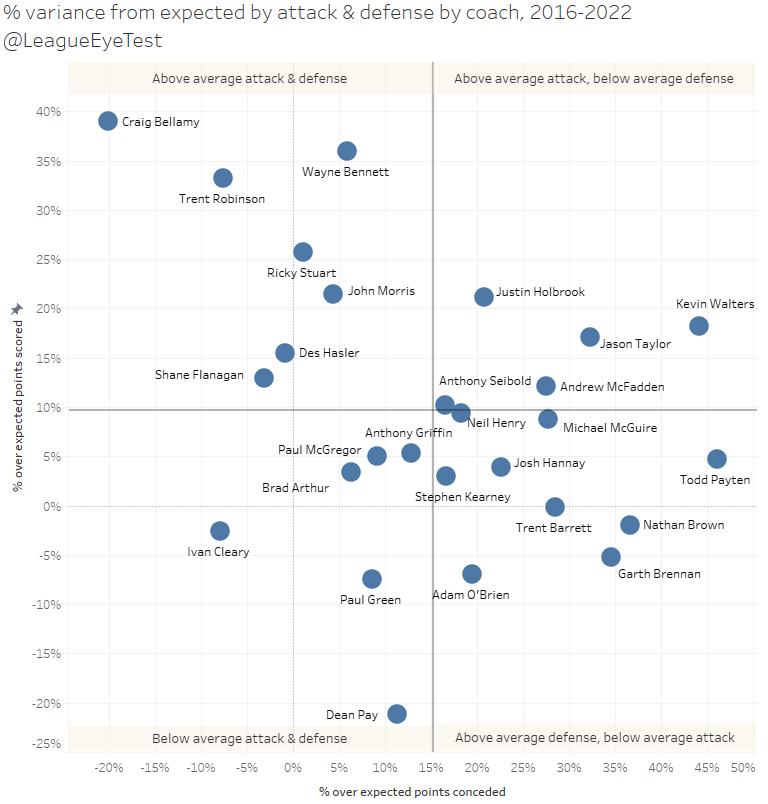
Again it highlights how there’s been half a dozen high quality NRL coaches over the past six seasons and the rest all have their own flaws. Again keep in mind that this also has removed any coaches with less than 10 games since their sample size.
There’s also a huge number of coaches with very ordinary records during this period. Some of that is due to the bizarro world that was 2021, but some of them (Nathan Brown for instance) weren’t coaching last season and their results stand on their own. Yet they’re given chance after chance to despite all evidence to the contrary.
Then you have the case of someone like Morris, who has easily outperformed the vast majority of his peers during this time frame yet was ousted from his position with Cronulla. Given Craig Fitzgibbon’s success so far with the Sharks in 2022 it’s difficult to say they made the wrong call, but it’s not hard to see that Morris was a quality NRL coach during his time and delivered more than expected. His results against expected points are in line with the likes of Stuart, Hasler and Flanangan which is strong company to sit with.
Circling back to the start of this post, it’s not the lack of first grade players that is the concern with expansion. There’s not a shortage of quality players. If anything, there’s a lot of fringe first grade and squad players sitting in the tier below the NRL as Melbourne consistently has shown.
What there is a shortage of is quality NRL coaches who are able to develop players. There’s only 17 spots available and openings seem to go to those who failed the loudest previously. Chasing short term results over the process of development plays a huge factor in this. A number of clubs this season look like a coaching change would be for the best and they could (and most likely will) do significantly worse than putting Morris at the helm.
Error Rates after Round 3
Before we finished this week let’s have a quick look at error rates after Round 3. Unfortunately, it’s not good reading for Broncos fans. The Eye Test defines Error Rate as how many possessions a player has before committing an error, and this years chart sits below.
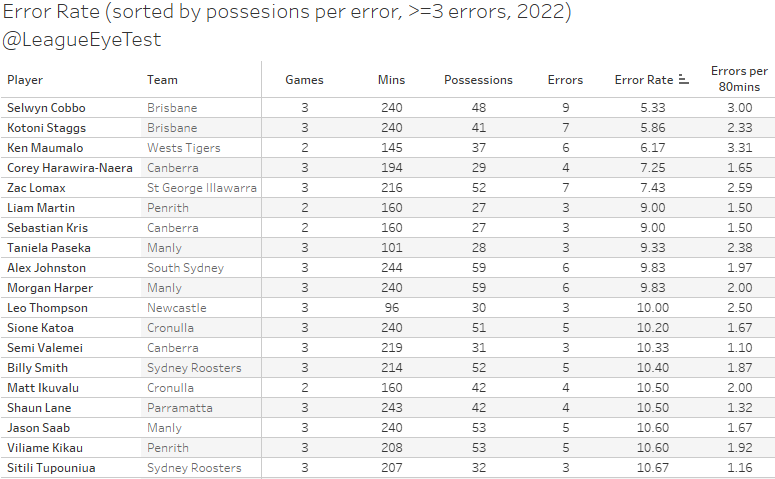
Selwyn Cobbo (9 errors at a rate of one very 5.3 possessions) and Kotoni Staggs (7 errors at a rate of one every 5.86 possessions) lead the way here. Anything lower than an error every 10 touches is a rate I would consider diabolical, and the Broncos have the two worst in the league so far. Whilst they’ve managed to win two from three so far this season there’s a few factors in their game that are concerning long term, and this is one of them. The Tigers Ken Maumalo rounds out the top three with an error every 6.17 touches.
If you enjoyed this post please consider supporting The Rugby League Eye Test through one of the links below.
Scan the QR code or copy the address below into your wallet to send some Bitcoin to support the site Scan the QR code or copy the address below into your wallet to send some Ethereum to support the site Scan the QR code or copy the address below into your wallet to send some Litecoin to support the site Scan the QR code or copy the address below into your wallet to send some Bitcoin cash to support the site Select a wallet to accept donation in ETH BNB BUSD etc.. Donate To Address
 Donate Via Wallets Bitcoin
 Ethereum
 Litecoin
 Bitcoin cash
Support The Rugby League Eye Test
Support The Rugby League Eye Test
Support The Rugby League Eye Test
Support The Rugby League Eye Test
Donate Via Wallets


Good analysis. But unfortunately this analysis does not account for the disparity in playing talent across the NRL.
It’s no surprise that most of your highest rating coaches are those from clubs with the biggest cheque books and brown paper bags.
If you developed a reliable model that also incorporated on field player production then that would go a long way to addressing this flaw.
Even something as simple as using NRL supercoach values could be useful.
Sorry to hear about your data source folding.
Just a bit further on incorporating player values in determining coaching performance. I think the basic formula should be:
Coach performance = team performance / sum player values