A few weeks back the following excellent question was asked to the Rugby League Eye Test account on twitter.
It felt like something obvious that I’d missed so I wanted to check and see the results. I’d spent the weekend putting together the numbers to check this and see if anything had changed this season with the reintroduction of penalties for a ruck infringement or straying offside inside 40 metres.
In an amazing co-incidence, the number of touches by players became a talking point this week thanks to an incredibly astute question from friend of the site Mike Meehall Wood. If you haven’t heard it yet, I’d suggest watching the clip below immediately to hear Mike ask a legitimate question to Canterbury coach Trent Barrett after the team’s loss to Penrith about the number of touches Kyle Flanagan had. Ignore the irrational tweet and just watch the video.
Let’s not dwell on the fact that it’s far from a ridiculous question, that it’s extremely valid and the sort of questions coaches should be getting asked, or that Barrett wasn’t prepared (or was unable) to answer this question. If you’ve not been reading Mike’s work on The Roar this season you’re missing out and it’s refreshing amongst the rumour mongers and crisis merchants in the traditional rugby league media.
This now gives us two questions to look at – has the number of touches changed by position this season, and was the number of touches Kyle Flanagan had during the Bulldogs loss on the weekend low?
First, we need to establish a few baselines to tell if certain positions are touching the ball more or less or getting involved more or less frequently.
The first ones were touched on in last weeks post about the changes so far this season. We know time in play is down slightly, which is resulting in the ball being in play for less time and there are fewer play the balls and sets. This instantly sets the baseline – if there’s less play then you’d naturally expect there to be fewer chances for players in ever position to touch the ball. If you haven’t read last weeks post, I’d suggest going through it to see what has changed.
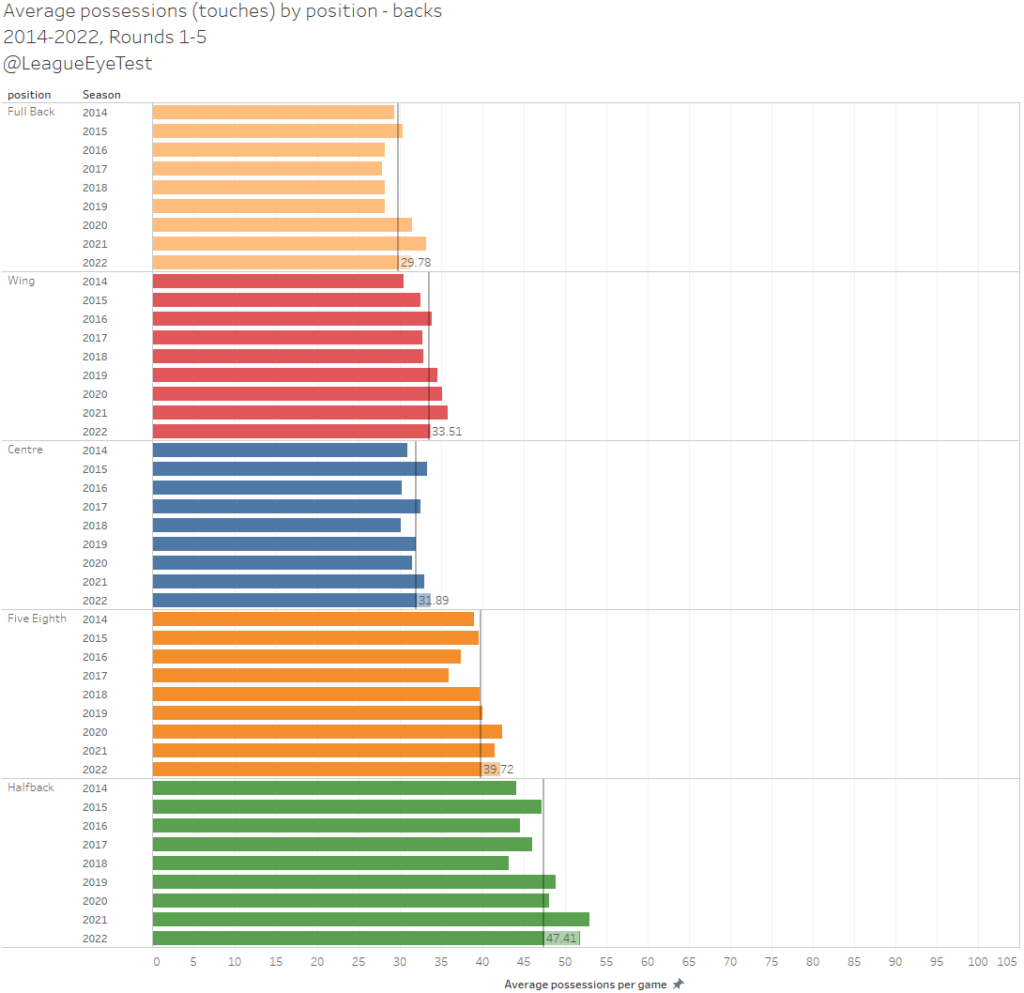
Next, we’ll check to see if players are touching the ball more or less. Here’s a breakdown of average touches per game by positions. These are broken down by starting positions, not necessarily where they play on the field or what is their natural or normal position.
Keep in mind that for some positions – second row, centre, wing and interchange – these average number of touches are the total of two players (or 4 in the case of interchange) at this position. The trends are still relevant though. Finally all comparisons are for Rounds 1-5 for the last eight seasons. I’ve split up the chart in half to make it easier to see
First up the backs.
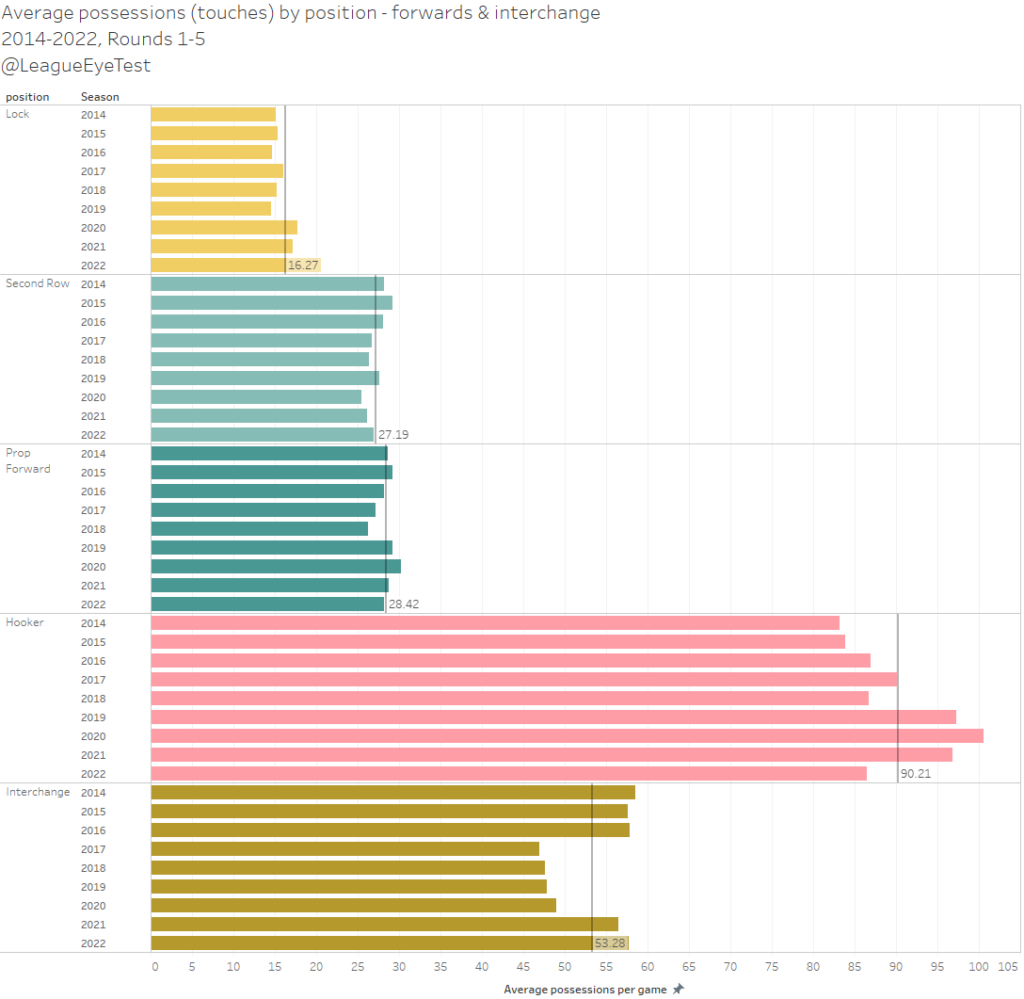
And now the forwards and interchange
There is a general trend of touches going up for spine players over the eight years covered in this data as ball in play increased. And in 2022 as ball in play has started to decrease it’s trending back slightly, but still ahead 2014.
Starting hookers have gone from 83 touches a game in a peak of 2014 to 100 in 2020 but have dropped back to 86 touches this season. Part of this is due to the increased use of utilities on interchange benches and some dummy halves rotating through the middle as a lock.
Halfbacks have increased from 44 to 52 touches per game over the past eight seasons, while their halves partners have grown at a slower rate, moving from 39 to 42. Fullback touches grown very slightly, from 30 in 2014 to a peak of 33 in 2021 before dropping slightly to 31.3 in 2021.
If you’re enjoying the content on this site please consider supporting The Rugby League Eye Test by donating through one of the links on the support page or at the end of this post. You choose the amount to donate based on the value that you feel this site provides.
One of the only positions not to see a set restart induced bump to their number of touches per game over this period is second rowers, dropping from a high of 29 per game in 2015 to 27 in 2022. Keep in mind that for some positions – second row, centre, wing and interchange – these average number of touches are the total of two players (or 4 in the case of interchange) at this position, so two second rowers are spitting 27 touches a game, whilst one halfback has 52 possessions.
We’ve now established that there’s slightly fewer chances in a game for player to touch the ball, but some positions are getting more possessions. This whole time we’ve been talking in volumes here and you know that’s not how we do things at the Eye Test. How do we judge if players are touching the ball more or less if the baseline number of plays is changing every year?
To solve this, instead let’s look at the share of possessions by position groups, which you can see below. I’ve grouped some positions together (centres and second rowers as edges, props and locks as middles) as they’re performing similar roles with the ball and to make the share of touches clearer over time.
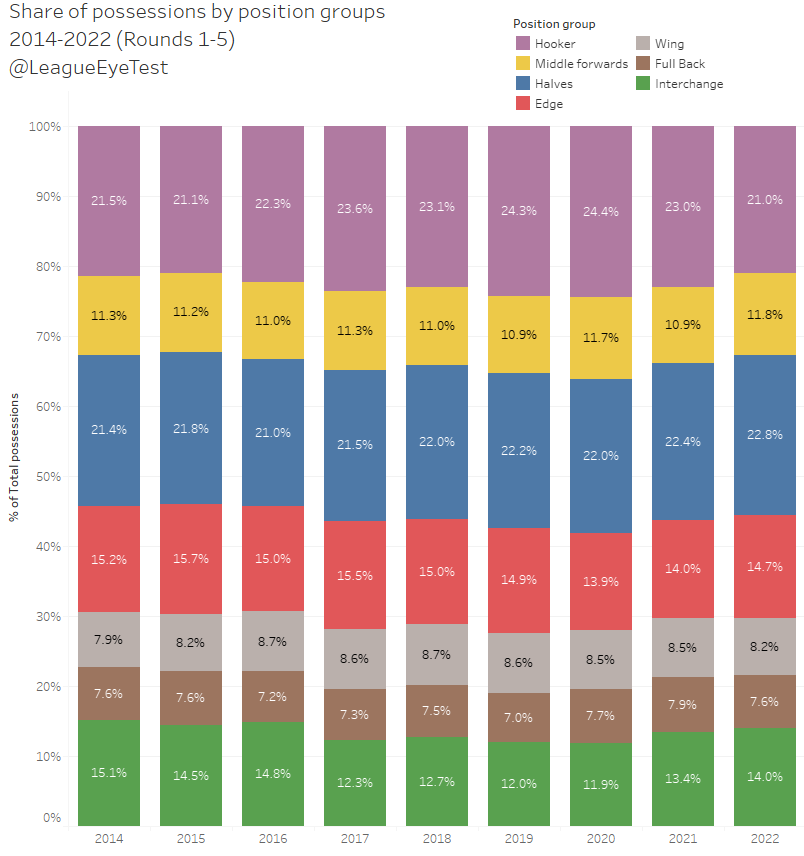
Here we can see that halves (blue) really aren’t touching the ball any more or any less than they have previously. The last eight seasons have ranged from 21.4% to 22.8% of all touches coming from halves. That 22.8% is the highest in the last eight seasons, so as much as “the wrestle” is (incorrectly) claimed to be back, both half positions are still getting involved at the highest rate they have in years.
Fullback possessions have dropped by 0.3% so far, which is an insignificant amount and still very much in the range of their historic share (7.3-7.9%). Again the peak for fullbacks was in 2021 under a different rule set, but their touches are steady.
Hookers had increased from a low of 21.1% to 23% in 2020 but with the drop in touches we mentioned before, their share has dropped from a peak of 24.4% in 2020 down to just 21% in 2022. The lack of increase to second rowers has been offset by an increase in share for centres. This is mostly due to backrowers becoming less hardman workhorses like Josh Jackson and Beau Scott to more attacking strike weapons like Viliame Kikau that don’t have a high work rate.
Meanwhile due to the increased fatigue facing the bigger men closer to the middle of the field, centres and wingers are being called on to run the ball back more in situations where a backrower or middle would have previously.
So, whilst there have been fewer sets and play the ball, halves have seen have had an increased share of touches of the ball whilst fullbacks touches are largely in line with previous seasons.
And with that resolved, it is now time to circle back to just how few touches do the Dogs halves have compared to the rest of the league? And did Kyle Flanagan touch the ball enough on the weekend against Penrith?
Thankfully, we’ve done the basis of the analysis already. From earlier we know that on average, both halves will touch the ball about 94 times a game in 2021. Last season the Dogs halves touched the ball about 93 times a game.
Again, that is just on a volume basis and doesn’t adjust for possession. If we look again at the percentage share of touches shown above, the average pair of halves took 22.4% of possession in 2021. How did the Dogs halves rate over the past eight seasons?
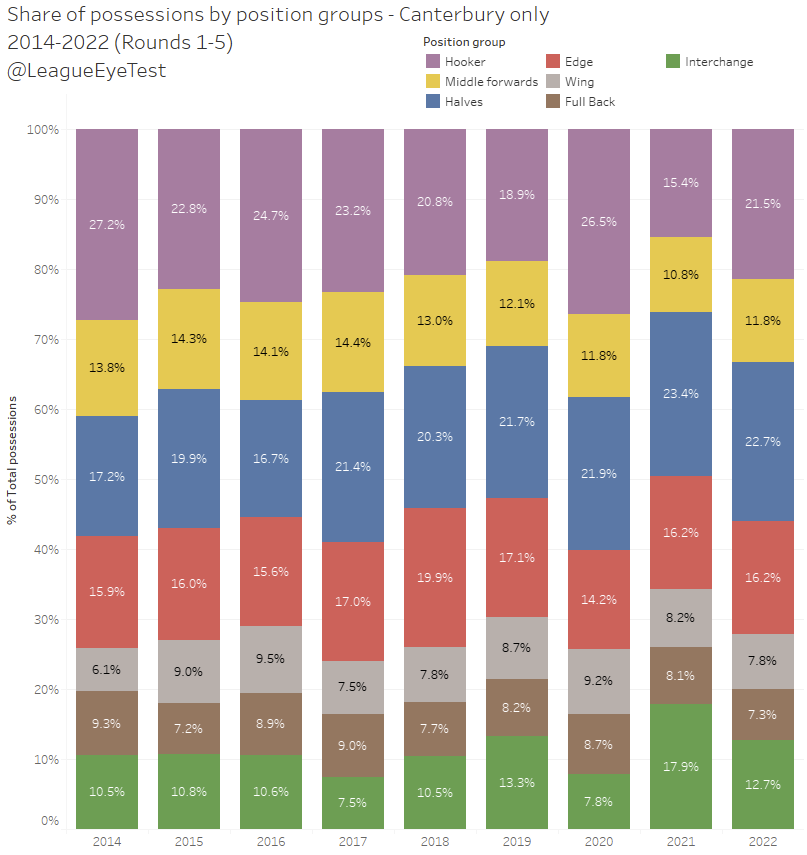
22.7% of touches in 2022, almost exactly on the league average. Although if you look back to prior seasons, other than 2018, Canterbury halves have consistently had fewer touches than the league average.
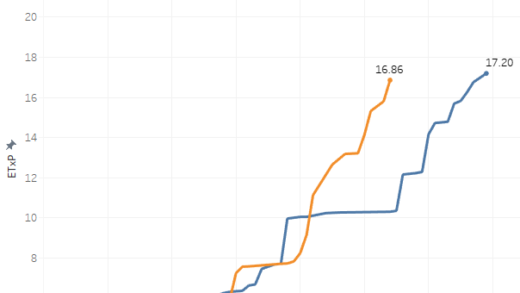
We have also established previously using the Eye Test Expected Points (ETXP) model that the Bulldogs have one of the worst percentage of points scored versus expected over the past few seasons, and last seasons scored 26% fewer points than a team with the same field position would be expected to score. In Round 1 this season they were -77% against their expected score. Their inability to put points on the board despite good field position has been well documented.
Going back to Flanagan’s touches, Fox Sports Stats have him with 23 possessions against the Panthers. It’s only one game so not representative, but there’s only been two other games all season where a half had fewer than 23 touches. The first was Matt Frawley for the Raiders who had 21 touches in Round 2 covering for Brad Schneider, and the other was Albert Kelly in Round 4 who had 5 possessions before leaving the field injured.
No other Canterbury half this season has had fewer than 41 touches in a game, which was Brandon Wakeham in Round 3. It was the lowest number of play the balls the Dogs have had all season at 108.
Let’s now look at how their #6 and #7 fared for touches this season, using the same chart above just for 2022 but splitting halves into halfbacks (blue) and five eighths (pink).
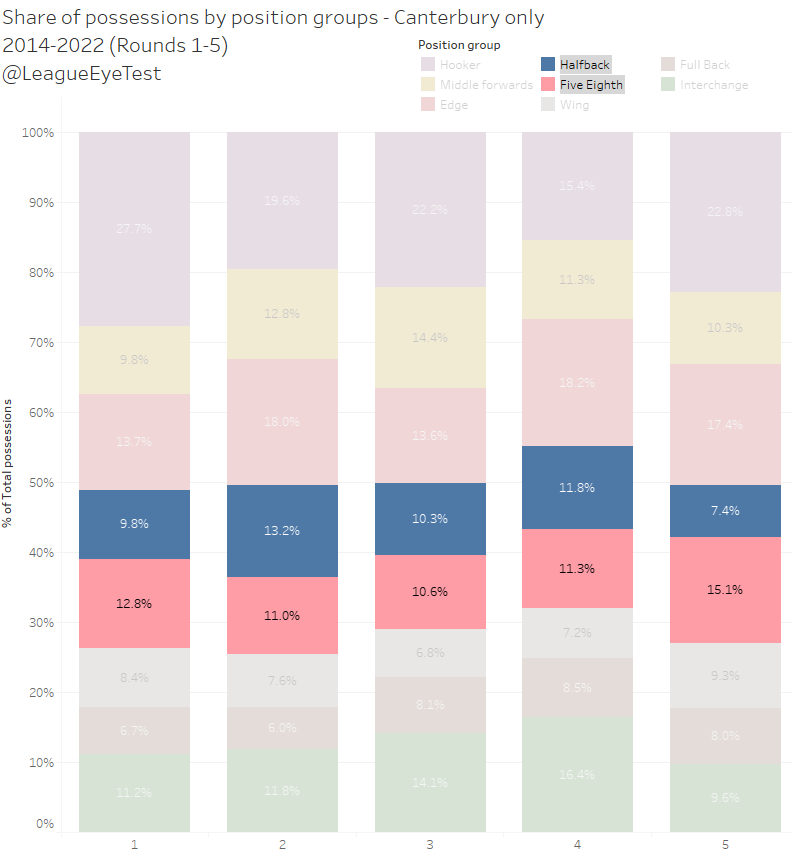
It’s clear that Burton took on a more controlling role this week as his share of touches increased from 11% to 15%, whilst Flanagan only had 7.4% of touches, well below the 12% average that Dogs halfbacks had in the first four rounds of this season. This makes sense given the Dogs insistence on heading down Burton’s side, hoping to link up with Josh Addo-Carr at some stage. However it mostly results in the Bulldogs predictable style becoming even more so, even if they have made some minor improvements of late. An interesting point is that the Dogs are just one of two teams this season where their #6 touches the ball more than their #7. The other being Canberra, where Jack Wighton commands more of the ball. Unlike the Wighton, Burton is a running and ball playing half and a the controlling or general play kicker.
It also means that Meehall Wood was on the money when putting the question to Barrett – Flanagan touched the ball considerately fewer times than Wakeham or Averillo did when they wore the #7 jersey. Regardless of Barrett’s answer, calling it a ridiculous question shows just how out of touch the legacy media are with what fans want from their rugby league coverage. We should be demanding more.
The Tigers struggle for metres continues
The more things change, the more they stay the same. About 18 months ago there was a post on this site about how toothless the Tigers middle forwards were and how their pack was unable to generate metres, especially through contact. They relied heavily on their back three at the time (Adam Doueihi and David Noafoluma especially) to generate those metres early in a set off the back of a kick.
Fast forward to Round 5 2022 and the club is in the exact same situation, just with a few different faces.
The Tigers are averaging -66.2 net post contact metres (post contact metres gained minus post contact metres conceded), second lowest in the NRL behind the Warriors (-67.4m/g). Below is every team’s net post contact metre performance this season.
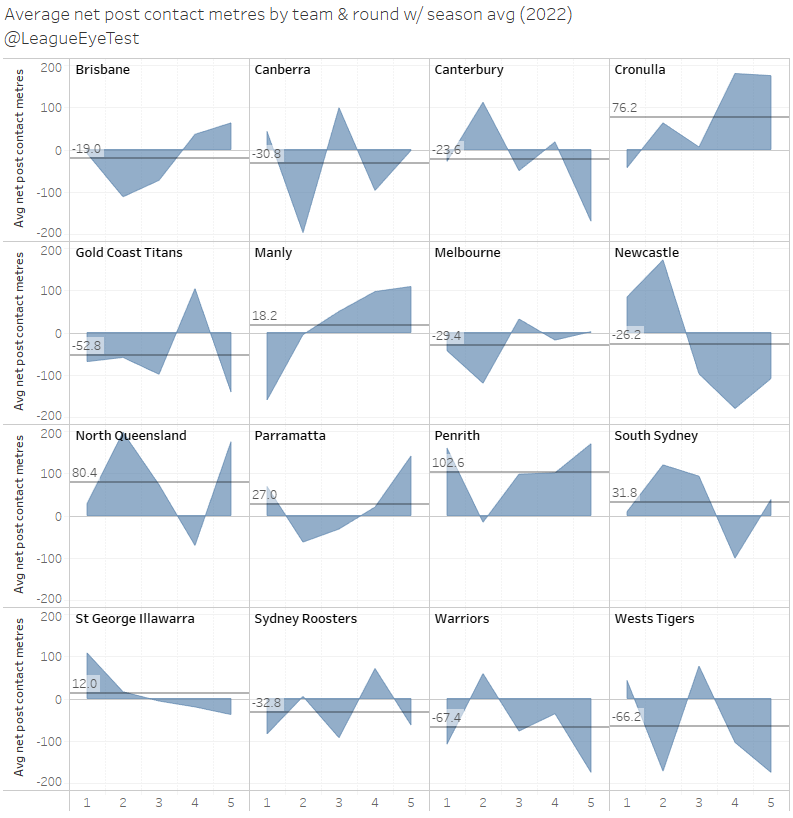
This stat isn’t necessarily a leading indicator – the Storm have won just two post contact metres battle this season – but generally is a guide over the course of a season as to how well teams control the battle in the middle of the field. One look at how Cronulla and Penrith on this chart can show you why.
They’re also getting some of the smallest contributions in the NRL from their starting front rowers as well.
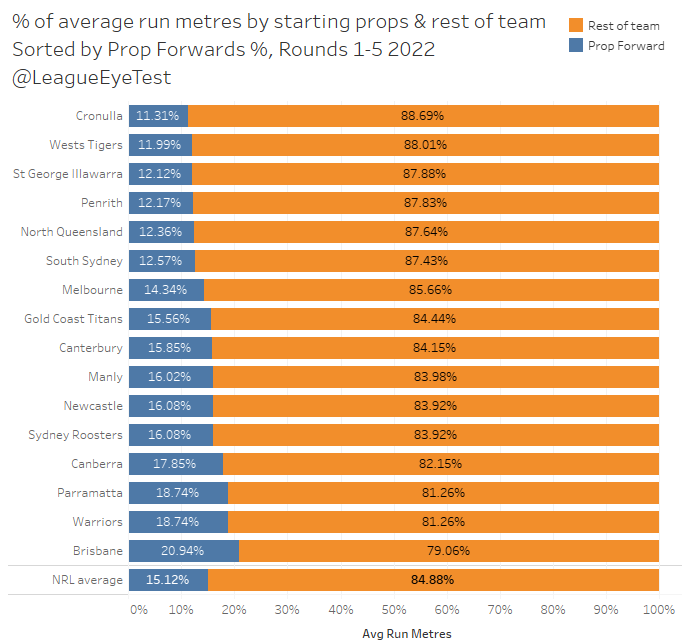
Only the Sharks get a lower percentage of run metres from their starting front rowers, at just 12% of total metres. That’s well below the NRL average of 15.1%, and lower than the Tigers already low numbers in their previous two seasons (13.45% in 2020 and 13.63% in 2021).
If your 8 and 10 aren’t contributing metres, then it puts a lot of pressure on the rest of the team to push the ball forward and the Tigers are suffering because of it. Teams like Penrith can survive it as they generate metres from other positions and trust their defense to help them recover field position.
When you look at how their forwards compare to the rest of the competition it’s pretty dire stuff. Other than Luciano Leilua, who ranks in the 92nd percentile for metres per run and practically carries their pack, the next highest Tiger is little used Thomas Mikaele, who sits in the 68th percentile. No other Tiger sits above the 50th percentile in metres per run. Alex Twal is in the 12th percentile, which means at 88% of NRL forwards average more metres per run than him.
For post contact metres it’s much worse. Kelma Tuilagi ranks the highest for post contact metres per run, but sits in just the 68th percentile, which means that 32% of all NRL forwards achieve more post contact metres per run than the best Wests Tigers forward. Every other team has at least one player inside the top 22%. Think about that. At least Twal fares somewhat better looking at post contact metres per run, sitting in the 48th percentile here, however that still places him in the bottom half of NRL forwards.
The Tigers inability to push through contact and control the middle of the field isn’t the sole reason for the their dismal start to the season, but when you compound it with the struggles, they’ve had defensively it creates a very big hole for them to have to dig out of.
Scan the QR code or copy the address below into your wallet to send some Bitcoin to support the site Scan the QR code or copy the address below into your wallet to send some Ethereum to support the site Scan the QR code or copy the address below into your wallet to send some Litecoin to support the site Scan the QR code or copy the address below into your wallet to send some Bitcoin cash to support the site Select a wallet to accept donation in ETH BNB BUSD etc.. Donate To Address
 Donate Via Wallets Bitcoin
 Ethereum
 Litecoin
 Bitcoin cash
Support The Rugby League Eye Test
Support The Rugby League Eye Test
Support The Rugby League Eye Test
Support The Rugby League Eye Test
Donate Via Wallets