
There’s been a lot of chatter recently from coaches and media that games aren’t called fairly by referees, specifically that teams at the bottom end of the table aren’t treated fairly opposed to those at the top of the table.
North Queensland Cowboys coach Todd Payten was the first to speak out about perceived referee bias after his side lost handily to the Sydney Roosters.
“Teams that have been up the pointy end of the competition for a while now, or have high-profile players get the benefit of the doubt too often, and that’s frustrating.
“That’s my opinion over watching footy for a long time.”
Gold Coast Titans coach Justin Holbrook was another to raise the issue.
“I’m not here to take anything away from Parramatta, good luck to them, but it’s about us as a club not being one of the big clubs and not getting anything [from the referees].”
Paul Kent further inflamed the discourse around this subject on Triple M radio recently.
“I have been saying it for years, I believe it and I don’t think it is anything sinister from the referees, I think it is just an unconscious bias,” Kent said on Triple M.
“They tend to think that the better teams are going to perform better and so therefore they are a little bit damning of what the lower ranked teams are”.
NRL head of football Graham Annesley spoke about this growing trend in his weekly media briefing, giving a very simple reason for it.
“I want to put to bed this theory that’s floating around, that somehow if you’re at the bottom of the end of the table, or towards the bottom end of the table, or not considered to be one of the big clubs in the game, that you’re going to get some kind of worse deal. It makes no sense to me.”
“You are much more likely to commit offences when you are defending than when you are attacking – you will be offside more, and you are much more likely to be committing offences in the rucks.”
So naturally I thought I’d investigate this and see if the theory had any legs. To do so we’ll break it down into two parts – do lower placed teams defend more often, therefore increasing more chances to incur penalties? And do those lower placed teams in fact give away more penalties because of this?
All penalty and set restart data is taken from Fox Sports Stats, and all ladder positions are taken from the wonderful Rugby League Project run by friend of the site AndrewRLP. Please support them if you can, they provide a valuable resource to the rugby league community.
To check this theory, we’re going to look at the ladder position of teams in every game from 2014 to Round 6 2022 and see if those at the bottom not only defend more, but also concede more penalties than their higher placed opponents. Aggregating these results over this period of time also reduces the impact of the one-sided 2021 season that will (hopefully) never be replicated again.
Please note this is the ladder position for each team at the time of the game being played, not the teams ladder positions at the end of the season. For this reason, all Round 1 games are excluded as there are no ladder positions at that point.
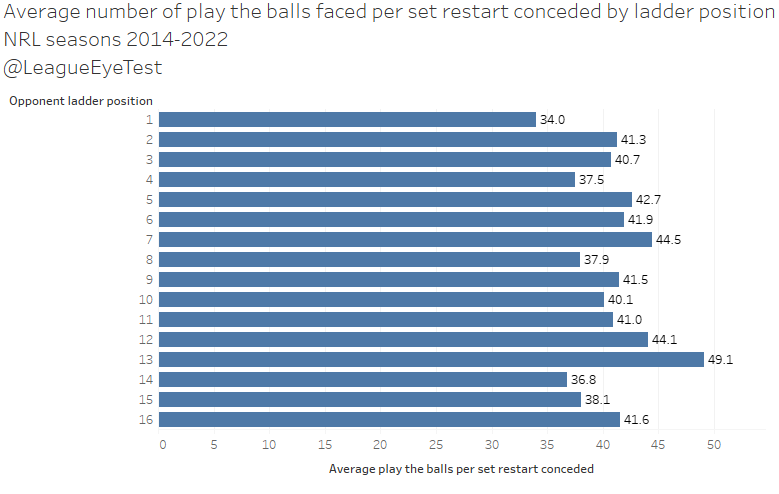
Firstly, we’re going to set the baseline – how many play the balls do teams face broken down by ladder position. Here’s the average number of play the balls face by teams in each of the sixteen ladder positions since 2014. No fancy graphs this week, just a lot of simple bar charts.
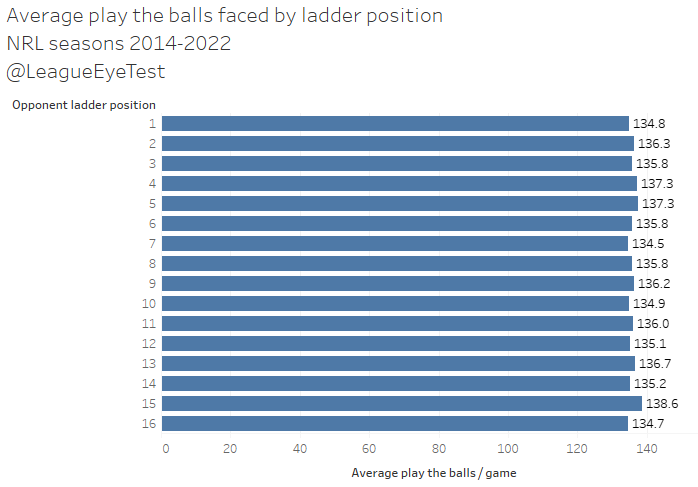
The average across that period of time is 136 play the balls faced per team. Knowing this, there’s very little variance from that across the sixteen ladder spots, ranging from 134.5 for teams in seventh place, down to 138.6 to those in 15th position. Interestingly teams in first place faced a similar amount of possession to those in 16th (134.8 to 134.7). Obviously there will be games where these numbers have a huge variance, but over time it does even out.
All of this means that on average there is a difference in possession faced of approximately four play the balls between the highest and lowest ranked teams. This really isn’t enough extra defense to concede more penalties, however we’ll get to that later.
Now we’ve identified that teams lower in the ladder don’t really face that much more possession on average. But do they concede more penalties and set restarts? Here’s the chart for penalties.
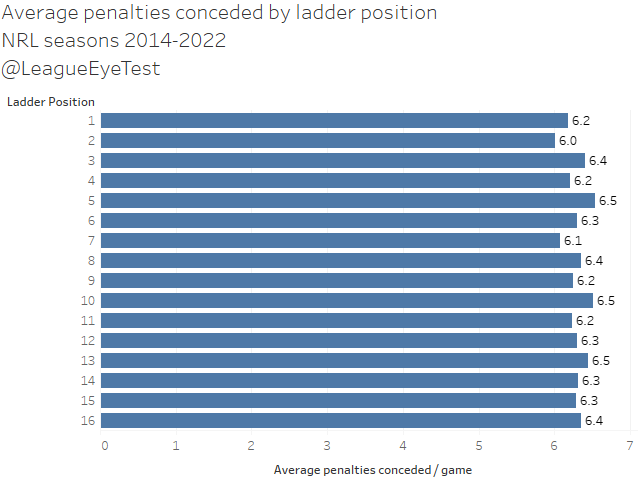
The average number of penalties conceded over that time is 6.3 per game, and it ranges from 6.0 given away by teams in second position up to 6.5 by a number of ladder positions (5th, 10th and 13th). Again, not necessarily enough to warrant outrage from coaches alone. The gap from first to last position on the ladder is just 0.2 penalties per game, an insignificant amount. Of course not all penalties are created equally, but over time higher placed teams aren’t really receiving more of them than lower placed teams.
It does tend to indicate that teams concede roughly the same number of penalties regardless of ladder position, with a very slight increase towards the lower end of the table. Not enough to launch a refereeing conspiracy theory on though.
And it’s a similar story for set restarts, when looked at from 2020-2022.
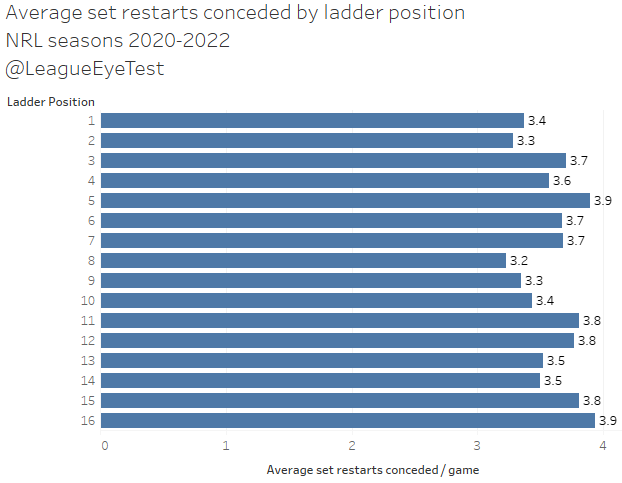
There’s a difference of just 0.7 set restarts between the lowest team (8th at 3.2) and the highest team (16th at 3.9 per game). There is slightly more of a trend for lower placed teams to concede them than there was for penalties. First place is only 0.5 restarts per game conceded ahead of last place on the ladder.
Regular readers may be saying to themselves “this is all good but what about possession adjusted numbers”? If you did say this, then I’ve trained you well. We already identified there wasn’t much difference in possession faced but for the sake of completeness let’s run the penalties and set restarts again but adjusting for the amount of possession faced. First up, the number of play the balls needed to concede a penalty.
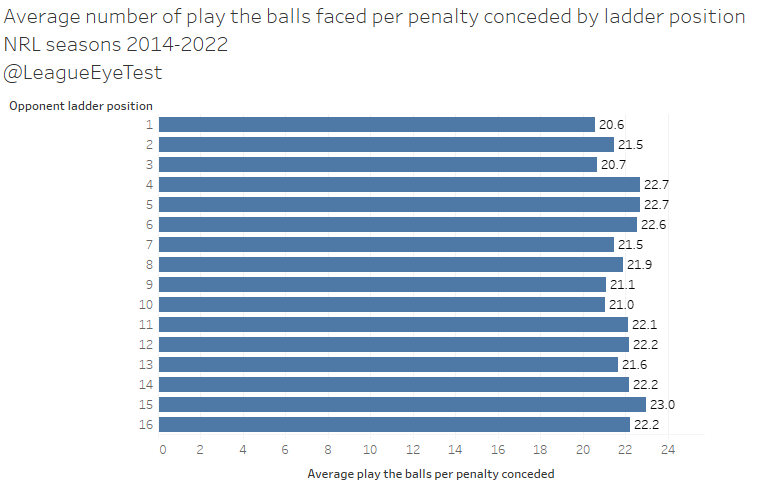
Again, there isn’t a huge spread – from 23.0 play the balls per penalty from teams in 15th to 20.7 from teams in second place, a span of 2.3 play the balls. Overall these numbers show that there’s not a large gap from top to bottom.
Let’s move on to set restarts adjusted for possession. This is where things get a little different, but most of it is due to the insanity of 2021.
Team in first place only concede a set restart every 34 play the balls, the lowest in the NRL. The highest was one every 49 play the balls by teams in 13th place, giving is a range of 15.1 play the balls. Or two and a half full sets difference. This passes the Eye Test as well, given that we know the higher placed teams from 2020-21 were willingly giving away restarts early in tackle counts and with favourable field position. We’ve talked previously about the statistical inflation that 2021 caused and this is another example of it.
This is all very straight forward so far. Teams face the same amount of possession regardless of ladder position and concede penalties at roughly the same rate. Of course, individual games will buck these trends dramatically, but largely the better teams usually come out ahead.
Does it change for penalties awarded? The results can be seen below.
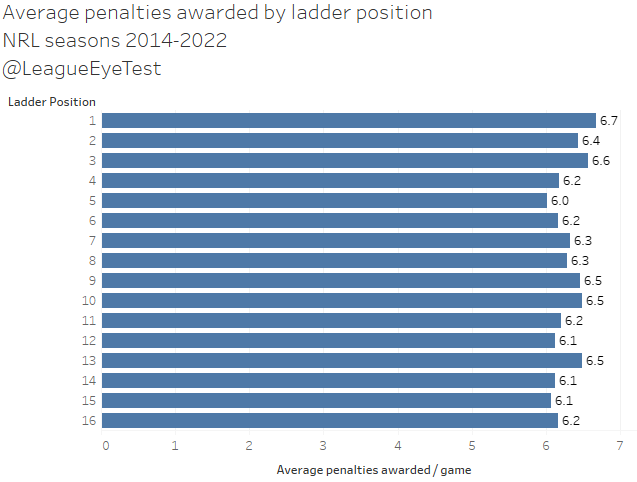
Not really. The range from first to last isn’t huge (0.7 from high to low), but the trend is a tiny bit clearer than it was for conceded. Teams at the top of the ladder are receiving slightly more penalties than their lower placed opponents, with 13th place being the outlier at 6.5 per game. I’m not going adjust these results for possession as we’ve seen before it made a minor difference for penalties and the case is the same here.
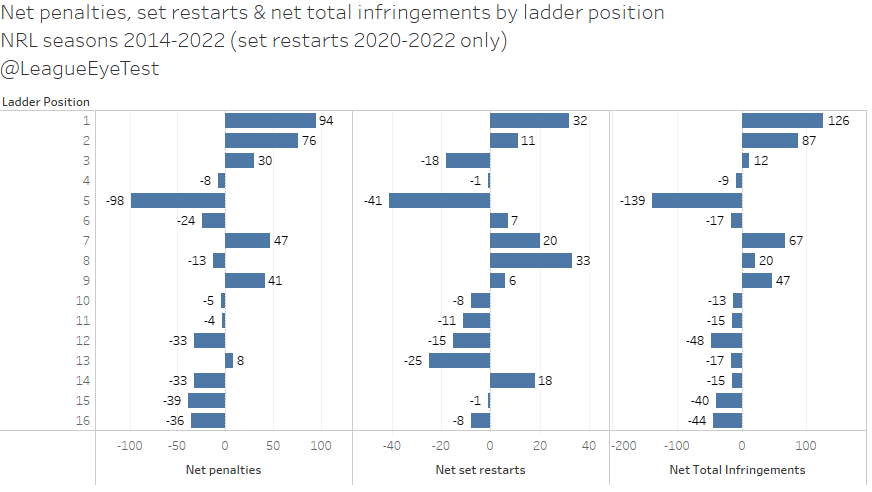
All of this led me to look at net penalties, net set restarts and net total infringements (penalties plus set restarts) to see if there were trends by ladder position. Once again, I’m not adjusting for possession as we’ve shown that doesn’t affect trends for penalties. Below are the net penalties, set restarts and total infringements by ladder position.
The numbers are net totals over the past eight seasons (or three for set restarts), not per game numbers. Teams in first position may be +94 in penalties, but given these are over the course of 180+ games across eight seasons, that is only around +0.5 net per game more. And that is the extreme end of the scale, third place being +30 is around +0.15 net penalties per game, an almost negligible difference.
I firstly need to address the elephant in the room which is the number for 5th place, which are completely out of line with the rest of the league. Here’s the same chart from above just for 5th place and broken down by team.
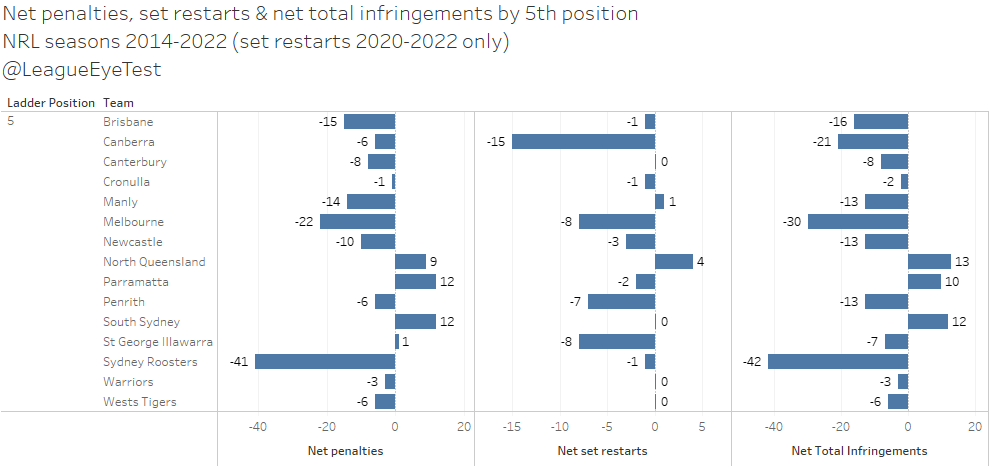
Most of the high penalty numbers are due to the Sydney Roosters, known penalty conceders, having spent 34 games in 5th place over this time, the longest they’ve spent in any position over the past eight seasons. It also includes the Melbourne Storm, known boundary pushers, who spent 23 games in fifth spot, more than they’ve spent in third (19 games) or fourth (15). Once you take this into account, the numbers for 5th spot make perfect sense.
Now that we’ve addressed that we can look at the overall trends. It’s very clear that the teams at the top of the table are generally receiving more restarts and penalties than they’re conceding, and those at the lower end are conceding more than they’re given, as you would expect.
There are some differences in there when you look at just restarts or just penalties, other than the Roosters and Storm anomaly as noted above. Eight teams had a negative set restart differential over this time, and 10 teams had a negative penalty differential.
What conclusions can we draw from this? At an aggregated level, teams are facing roughly the same level of possession and conceding penalties at the same rate. Teams are conceding slightly more set restarts the lower they are on the ladder when adjusted for possession, however this is tainted by the results from 2021.
Most importantly, ladder position doesn’t appear to play a huge part in teams conceding penalties, plays some part in set restarts, which we’re meant to be seeing fewer of this season.
Where it does seem to play more of part is in teams being awarded penalties, which results in a chicken or the egg conundrum. Are the better teams “better” because they receive more penalties, or do they receive more penalties because they’re “better”? Probably a bit of both, however I’ll lean slightly towards the latter.
Next week’s post will break this down in a more meaningful way, by whether the team leading or trailing is more likely to be awarded a penalty. Unfortunately, due to the short week and other various commitments there just wasn’t enough time.
However we have looked at this previously for set restarts. For a recap, last season I looked at when and where set restarts were awarded, the minute they were awarded and was the team they were awarded to winning or losing. If you haven’t read it, the link is below.
The numbers were only up to Round 18, 2021 but it painted a pretty strong picture. Ignoring where on field they were given, set restarts were handed out reasonably evenly between both sides to start games. As you hit the 25th minute that started to creep up and from that point on well over half of set restarts were awarded to sides trailing.
That increased to over 70% of restarts awarded to teams trailing after the 57th minute, and 92% of all set restarts in the final eight minutes of a game being awarded to the team behind on the scoreboard.
This shouldn’t be framed as referees were consciously awarding these six agains to trailing teams. I’m not calling their integrity into question. I believe that they are doing a tremendous job despite being chronically understaffed and presented with ever fluctuating interpretations and rule changes. I’d never suggest they’re doing anything, but their best given a set of circumstances that doesn’t favour them. Now, The Bunker on the other hand… that’s a different topic all together and one best left alone.
What was (and still is) happening is that the well-coached teams, who were often leading in a one-sided 2021 season, were pushing the envelope and putting referees in more instances where they had to call an infringement.
I’d expect similar results for penalties, although without the steep drop in the second half, but I haven’t had a chance to pull the numbers together. Hopefully that changes next week.
If you’re enjoying the content on this site please consider supporting The Rugby League Eye Test by donating through one of the links on the support page or at the end of this post. You choose the amount to donate based on the value that you feel this site provides.
Scan the QR code or copy the address below into your wallet to send some Bitcoin to support the site Scan the QR code or copy the address below into your wallet to send some Ethereum to support the site Scan the QR code or copy the address below into your wallet to send some Litecoin to support the site Scan the QR code or copy the address below into your wallet to send some Bitcoin cash to support the site Select a wallet to accept donation in ETH BNB BUSD etc.. Donate To Address
 Donate Via Wallets Bitcoin
 Ethereum
 Litecoin
 Bitcoin cash
Support The Rugby League Eye Test
Support The Rugby League Eye Test
Support The Rugby League Eye Test
Support The Rugby League Eye Test
Donate Via Wallets


Thorough and well-done research.
These results do not surprise me. I’ve done my own research on penalties & restarts and found weak or virtually no correlation between them and Margin of Victory as well as points scored or conceded.
My gut feeling is what these coaches are actually complaining about are refereeing decisions at key moments in games where penalties & restarts awarded or not awarded change the momentum of a match.
This of course is hard to measure statistically; what makes one penalty or restart more important than others? How do you define a key moment in the game? Further, how do you identify crucial non-decisions where a penalty/restart should have been awarded but wasn’t (lots of video logging that still involves a degree of subjectivity).
I haven’t got answers to these questions, but I know a key moment coupled with a bad (or non) decision when I see one and know how critical these can be to the outcome of a match.
Whether these happen to bottom of the table teams more than the top of the table teams I’m not sure. But what I am quite sure of is the uncanny number of times Melbourne get a penalty or restart late in a set when they really need one; that is, when they are deep in their own territory and struggling to make ground and the opposition is on top.
Good work.. but one key metric is… field position. The field position in which infringements are occurring. I can tell you, even with my one-eyed support, my club cop a disproportionate amount of penalties whilst trying to keep a team pinned in their own half. Field position relieving penalties.
The other thing… I understand you have to be objective… the assertion is the teams position on the ladder is the main factor in the supposed bias.
But again, one-eyed about a general perception of my club by referees, regardless of success or failure… representing the statistics by league position, which obviously varies a lot round to round, seems to me to obfuscate the bigger picture.
In fact, noone ever wants to talk to the phenomenon of there being a single, or set of, “most hated” clubs, and how that might impact impartiality. For example, if you are reading this, and you immediately have an answer to “which is the most hated NFL club?”, do you ever ask yourself, well is that reasonable that, even if I know only a small number of NFL clubs, I know that there is a definitive answer for that.
And I know it’s a tough ask…. but doing it by a round-by-round methodology seems to me to mask both the *lag* element, whereby a top team retains a favourable perception even as the slip down, whilst it’s hard to shake off a perception of a previously bottom team, as they climb… or *inertia* element, whereby a teams position in recent seasons is their perceived current quality.