After a one week dalliance with meme posts in last week’s sock height analysis, which surprisingly resulted in the largest weekly audience for the site in history, the Eye Test is getting back on brand this week.
Recently a suggestion was posed to the Rugby League Eye Test twitter account by friend of the site Elliott Richardson, who publishes Rugby League Monthly. He was wondering how many tries a team leading would score before they conceded one in 2021 and then for 2022.
This idea really piqued my interest. We all know 2021 was absolutely cooked as a competitive season and the statistical inflation it caused will be a burden on the game for the few seasons.
As an aside – please check out Rugby League Monthly. Elliott puts together some tremendous interviews and stories for the site, which has a very affordable premium subscription. It’s the type of positive, uplifting and thoughtful rugby league content many complain doesn’t exist. Independant rugby league content needs your support.
Getting back to the suggestion, it did get my brain spinning. Just how many points were teams scoring unanswered last season and this season? We already know from prior analysis in 2022 that the average margin is down from last year’s season of condensed rugby league, and the games are much closer over the course of 80 minutes than in many years.
I’m putting words in Elliott’s mouth here, but I believe he was of the opinion that teams who were able to grab an early lead in 2021 were able to continue to score points without much resistance, and that that trend hasn’t continued into 2022.
After hearing the suggestion, my initial thoughts were similar, especially as mentioned that I’d established earlier this season that games were closer, which would indicate that trailing teams are able to put up more of an effort.
But we don’t do things half arsed here at the Eye Test so let’s get some data to prove it.
To do so we’re going to look at the average number of total points scored in an NRL games, but the margins and average points scored when a team was leading or trailing. Are teams with a lead continuing to pile on the points as they did in 2021? And just how far removed from reality was 2021? Are teams behind on the scoreboard able to claw back a deficit better than they have been?
First up we’re going to set the scene by looking at total points scored in a game for the past eight seasons up to Round 11.

2022 is far more in line with other seasons after eleven rounds, with the total points line declining by nearly 11%. The typical game in 2022 has 40.31 points scored, the third highest since 2014 but well down on the ridiculous 44.66 in 2022. The only other season it trails is 2016 where 40.44 points were scored on average during a match.
We’ve established that total scoring has dropped by 11%, let’s get an update on average margin by minute over the course of an NRL game to check if it’s still as close as it was earlier in the season.
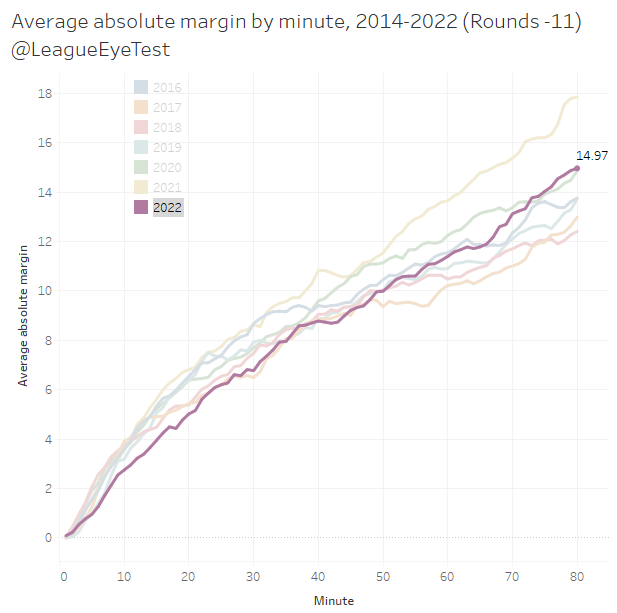
The average margin at the end of a game this season after eleven rounds is now 14.97, the second highest since 2016 and almost identical to 2020 (14.86). That sounds bad, but the average margin is one of the lowest up until around the 65th minute where the scores become more one sided. The game is still a much closer and more engaging product than it was in 2021, which is incredibly important for a sport that relies so heavily on television revenue.
Now that we know there’s fewer points being scored this season, and games are closer well into the second half this season, let’s get into the meat and potatoes of Elliott’s thought bubble. Here’s the breakdown of average unanswered points scored by teams leading and trailing (even scores have been removed) from 2016 to 2022.
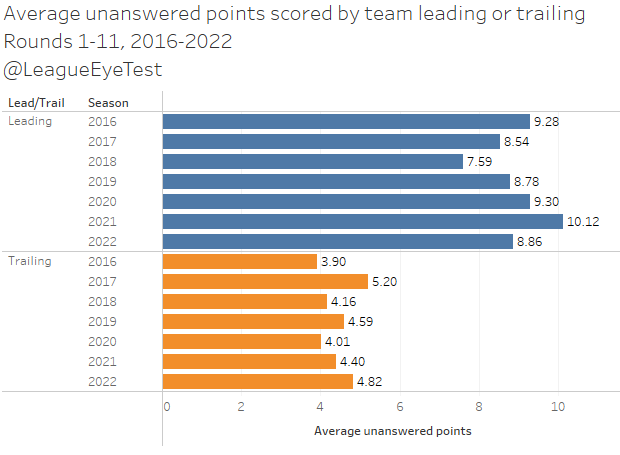
There are some really interesting things to note here. The first is that 2022 has an average of 8.86 unanswered points being scored by the leading team, which is right at the same level as 2019 (8.78). Teams trailing are also scoring the second highest amount of unanswered points at 4.82, only behind 2017 (5.20). Rugby league is healing.
Simply put, teams in the lead aren’t piling on as many points and those trailing are coming back at one of the highest rates since 2016. More proof that the games are closer and that the rule change this season has had the desired effect in rolling back last seasons one sided beatdowns.
The 2018 numbers need to be clarified here and exist somewhat as an outlier. The first half of 2018 included the great penalty crackdown, which resulted in a significantly higher amount of penalty goals being attempted. This naturally brings down the number of unanswered points being scored and is why the average for leading teams is just 7.59 points without a response, the only season lower than 8 points unanswered.
The next thing that is abundantly clear is that 2021 (and 2020 to a lesser extent) were completely ridiculous seasons, with an extra unanswered point per run in 2021 and a whopping 10.12 points before the opposition scored in 2021.
Trailing sides in 2020 scored at one of the lowest rates (4.01) and 2021 didn’t fare much better (4.41), and when you look at the ratio of points scored by teams lead to teams trailing it’s even worse. Both 2020 and 2021 seasons had teams leading outscoring those trailing at a rate of 2.3 to 1, which again is no surprise when you saw how easily teams were running away with leads last season.
Thankfully this season has wound this back considerably, with leading teams only outscoring trailing teams at a rate of 1.84 unanswered points to one.
Now lets look at which teams are scoring the most unanswered points in 2022.
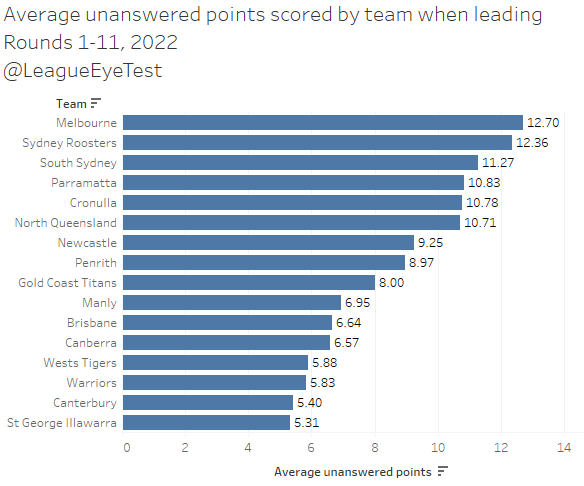
As most would have expected Melbourne at the best frontrunners in the competition scoring an average of 12.7 unanswered points. Surprisingly the Roosters sit second, with an average of 12.36 points scored when leading before their opponent responds. And even more surprisingly Penrith sit mid table, only scoring 8.97 without reply when leading this season, down from 11.13 in 2021. Is this a sign they’re beatable this season?
At the bottom end of the scale there are four teams who average less than a converted try unanswered – the Tigers, Warriors, Bulldogs and Dragons – all of whom who sit in the bottom half of the ladder. Again no real surprises here a.
Lastly lets flip things around and look how many points a team gives up when they’re leading.
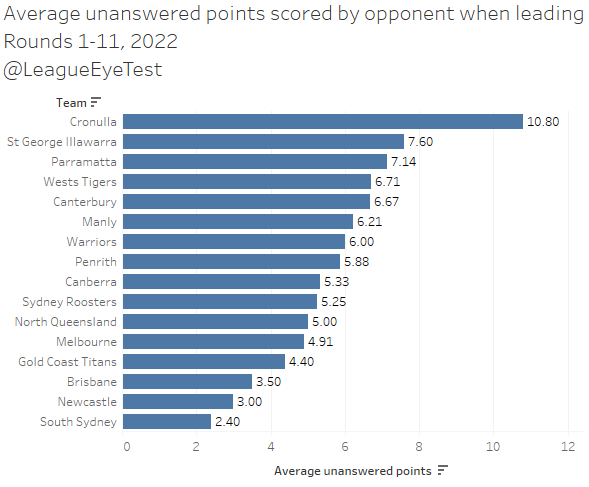
Here’s a real shocker and it’s not pretty reading for Sharks fans. Cronulla are are allowing 10.80 points unanswered when leading which is by far the worst in the league and well ahead of second worst St George Illawarra at 7.60. Hopefully Craig Fitzgibbon can work on their defense whilst leading in the second half of the season, as the better teams will exploit this in the finals.
Eels fans who know the anxierty caused by Parramatta holding a 10-12 points lead will understand how the club gives up the third most amount of unanswered points when leading.
Strangely enough the two best teams at preventing runs whilst in the lead are South Sydney (2.40) and *checks notes* Newcastle (3.00)?
The Knights can be easily explained by them having a low incidence of leading games, and that the floodgates open once they lose the lead where they give up an average of 12.15 points without a response, third worst in the NRL.
The Rabbitohs are a slightly different case. They don’t give up big runs whilst leading (2.40) or trailing (7.79). Their issue has been scoring points themselves, which is something that was raised here two weeks ago. When they do score, they’re able to put on tremendous runs, and their average of 11.27 points unanswered when leading shows they’re one of the best frontruners in the league. But when they fall behind, they struggle to get the ball over the line. It is going to be a struggle for them to hang onto the top half of the league if they continue to hand over large leads early in games.
Brisbane’s abiltiy to control the scorboard and not allow huge runs has been a part of their success this seaosn and it shows in these numbers, with the Broncos only giving up 3.5 points on average before replying themselves.
Circling back to the original comment, Elliott was clearly on to something. The conclusion that we can draw from this analysis is that once again the 2022 season has been far more competitive and enthralling that the two previous seasons. Games are closer and more importantly teams ahead on the scoreboard aren’t running away with games, and those with a deficit actually have a chance of clawing it back.
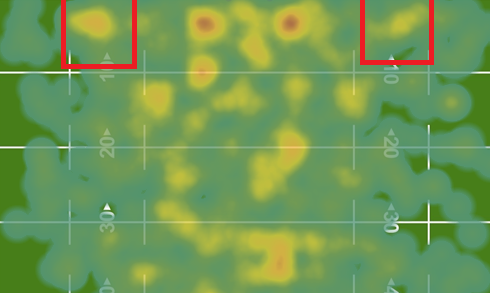
Where did all of Manly’s touches go?
Late last season the Sydney Morning Herald posted an article by Roy Masters that claimed Manly coach Des Hasler and his innovation consultant (and former NRL Economist) Ramy Haidar had found a statistic that correlated with winning more than any other, and it was one of the keys behind their strong second half of the season in 2021.
The story stated that the number of touches (“receipts” in NRL statistics, “possessions” in Fox Sports vernacular) correlated highly with winning. Ergo, if your players touched the ball more often, you’d be more likely to finish ahead after 80 minutes. Keep in mind this is individual touches, not number of tackles or play the balls, and unrelated to completion rate which I’ve already debunked as an indicator of success.
My assumption of the theory behind this is that they believed that consistently moving the ball laterally would tire out their opponents, enabling them to find gaps in the defensive line. And if you watched the Sea Eagles romp through the middle of the field in 2021, you’d think that they’d found the silver bullet that solved rugby league, as if such a thing could ever exist in any sport.
There was always the concern that this style of play was only conducive under a 100% set restart environment, which is no longer the case. You can’t build up the same level of sustained, fatigue inducing possession when penalties are awarded inside 40 metres.
Manly’s current run of dreadful form was enough reason for me to have a look at this again for 2022 and see if they were still playing with the high volume of touches or their style had changed, and just how much reverting to penalties inside 40 metres had affected them.
First up, we know that the number of actionable “plays” (tackles, play the balls, whatever term you want to use) are down this season as mentioned before. Time in play is down on last season, there are more penalties and more stoppages, so there are fewer opportunities to pad your number of touches.
That means to analyse this, we’re going to look at possession adjusted numbers. Instead of just looking at total touches/possessions/receipts, we’re going to analyse the average number of them per play the ball. That will negate any increases or declines based on a team having more of less of the football.
Below is a chart of the average number of passes per play the ball, which also takes out any bias from an inflated number of play the balls in 2021. I’ve also chosen only to look from Rounds 14-25 in 2021 and 1-11 in 2022.
Why 14-25 last season? As usual we’ll set the scene first.
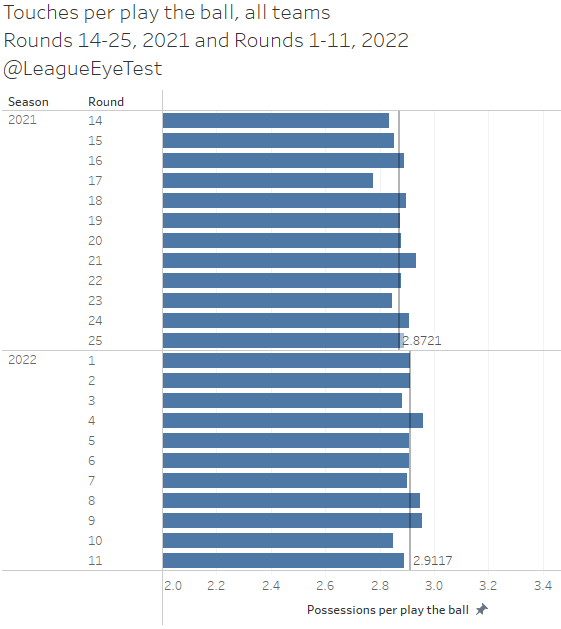
The NRL average touches per play the ball for Rounds 1-13 was 2.86 and for Rounds 14-25 it was 2.87, right on the full season average of 2.87.
However, for the Sea Eagles in Rounds 1-13 in 2021, Manly averaged 2.89 touches per play the ball, slightly above average. Yet in rounds 14-25 increased that to 3.10 per play the ball, a 7% increase on league average. Penrith were the only other in that range with an average of 3.00, nearly 4% above league average. In Round 20 last season when Manly defeated Cronulla 40-22, they generated an incredible 3.49 touches per possession.
Fast forward to 2022 and the number of touches per play the ball has increased very slightly 2.91, indicating that teams are moving the ball more than they were last season in an attempt to create space.
And comparing 2022 to last season, 15 of the 16 NRL teams have either increased their number of touches per play or are within 1-2% of their mark from last season.
There’s no prizes for guessing who the team is that hasn’t matched the trend.
It’s the Sea Eagles.
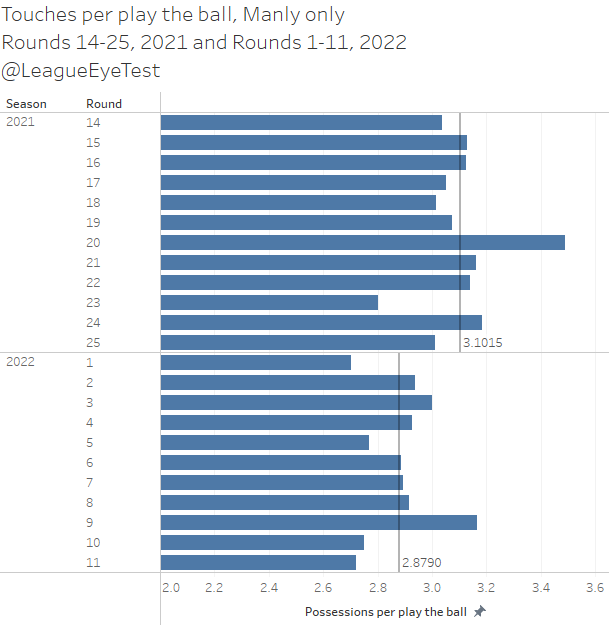
They have dropped from 3.10 passes per play the ball in Rounds 14-25, 2021 to just 2.88 thus far in 2022, a drop of 7%. Their master plan of generating more touches has either been thwarted by opponents who know their game plan, or to use a rugby league cliché, the ruleset no longer favours spreading the ball wide without having earned the right to do so.
The’ve only had one game this season above las seasons average (Round 9’s win over the Tigers), and the last two rounds have been well below their season average, which as noted above was already below last years mark.
This has neutered their ability to pile up points when leading. If we reference the data from above, Manly scored an average of 12.31 unanswered points when leading in 2021, third in the NRL. This season it has nearly halved, dropping down to 6.95. They’re clearly not the team they were nine months ago.
It’s unlikely that this is a major reason for the club reverting to the mean this season, but it’s strong evidence that the change in rules have likely affected Manly far more than any other club this season. Haidar isn’t at the club anymore, maybe he was actually too innovative for them?
If you enjoyed this post please consider supporting The Rugby League Eye Test through one of the links below.
Scan the QR code or copy the address below into your wallet to send some Bitcoin to support the site Scan the QR code or copy the address below into your wallet to send some Ethereum to support the site Scan the QR code or copy the address below into your wallet to send some Litecoin to support the site Scan the QR code or copy the address below into your wallet to send some Bitcoin cash to support the site Select a wallet to accept donation in ETH BNB BUSD etc.. Donate To Address
 Donate Via Wallets Bitcoin
 Ethereum
 Litecoin
 Bitcoin cash
Support The Rugby League Eye Test
Support The Rugby League Eye Test
Support The Rugby League Eye Test
Support The Rugby League Eye Test
Donate Via Wallets