With Round 12 ending on Sunday half of the NRL has already passed. Some clubs might wish the whole season is over. And as we did last season, the half way point is time for the regular review of the Eye Test’s advanced statistical leaders over the first half of the season.
New readers to the site may not be familiar with some of these metrics, and if that is the case, I’d highly recommend reading the explainers on some of them to get a better understanding of what I am trying to capture with these measurements.
If you’re enjoying the posts on this site and want to support independent rugby league content, please consider donating to The Rugby League Eye Test of a value of your choosing via the link below.
But I know many of you are as time poor as myself, so I’ll give you the cliff notes here before we dive into the numbers.
Net Points Responsible For (NPRF)
Elevator pitch: A per game metric that shows the points a player contributes from both attack and defense.
This is mostly a playmakers statistic, and came about through friend of the site Clearing the Obstruction dissecting Scott Drinkwater’s play in 2020 for the Cowboys. He was instrumental in setting up a number of their tries but he was throwing the pass before the try assist and wasn’t showing up among league leaders in try assists.
The NPRF equation adds up all positive live ball scoring contributions (tries, try assists, try contributions – the “hockey assist” if you will, and field goals), minus any try causes (where the defender is deemed to have allowed a try). We sum those numbers up and then divide it by games played.
I’ve also added in try causes, because what good is having someone who can create 6-8 points per game but also costs you? Matt Dufty ranked 9th in 2020 if you looked purely at points created, but ended up 45th once you took into account his 21 try causes. Both sides of the game are equally important, but unfortunately there’s not a lot of available metrics to quantify the latter.
Error Rate
Elevator pitch: On average how many touches per player it takes for them to commit an error.
Relatively straight forward. This one is used to judge how frequently a player is committing an error. Are they secretly a member of the Burgess bloodline?
The next group I’m going to put together as they share a common theme.
Tackle Rate / Ball Runner % / Total Run % / Involvement Rate
Elevator Pitch: The rate at which a player completes a tackle or a run with the ball, or makes a decoy or support run, adjusted by possession and minutes played.
Typically middle forwards are short changed in statistical recognition unless they’re playing big minutes. The birth of this site came from these metrics, as I wanted to see which players were getting through more work in short periods of time.
If two players made 50 tackles, but Player A did in 60 minutes and Player B in 80 minutes, Player A was completing them at a higher rate.
Similarly, if two players completed 20 runs in 80 minutes, but Player A’s team had 170 play the balls while Player B’s team had 130 play the balls, Player B would be taking on a larger amount of his teams workload.
Now to break down each one by what they show:
- Tackle Rate (or Tackle %) looks at how frequently a player completes a tackle. Not to be confused with the NRL’s Tackle Efficiency which measures the percentage of made tackles versus missed tackles.
- Ball Runner % indicates how often a player makes a run with the ball. Previously named Run %, was retitled to better reflect what it was measuring once Total Run % existed.
- Total Run % combines option runs (decoys or supports) with traditional runs to give a better picture of attacking work rate
- Involvement Rate sums up Tackle Rate and Total Run % to give a wholistic view of a players effort.
These numbers are all represented as the percentage of available plays that a player completed a tackle, run or option run on.
If you want an idea of what these metrics mean for the average player, here’s a breakdown by position from last season.
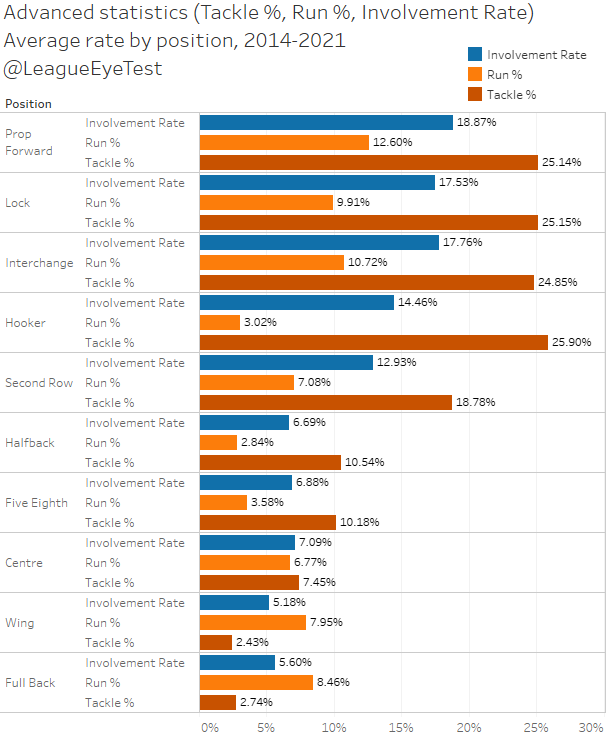
Total Run % is missing from this chart as I only have two seasons worth of option run stats. But from those two seasons it generally adds about 3-8% to a players Ball Runner %, depending on how often they’re used as a decoy or run support lines.
Hopefully now everyone is up to speed. Let’s take a look at who is topping the Eye Test’s charts for 2022.
Net Points Responsible For (NPRF)

Melbourne’s Ryan Papenhuyzen leads the way this season, with a Net Points Responsible For of +8.11 per game. Last year it was Nathan Cleary (+11.82 NPRF per game), and this season he’s still second in 2022.
What you can see though is that the statistical inflation from 2021 has been wound back, with Cleary only adding 8.5 points per game for the Panthers this season, over three points per game fewer. Last year there were three players above that mark (Cleary, Tom Trbojevic and Ryan Papenhuyzen) after 12 rounds.
Unsurprisingly two of the next three spots are taken up by the Storm, with Cameron Munster and Jahrome Hughes slotting into third and fifth spots. Parramatta’s Mitch Moses splits the two Melbourne halves in fourth spot with +7.76 NPRF per game, up from the +6.12 he averaged for the first half of 2021.
Drinkwater, the player mostly responsible for this metric existing because of the high number of try contributions he was generating, sits just outside the top 10 this season but has not picked up a single try contribution thus far. He does however have nine try assists to his name, and he’s crossed the line five times himself.
The value of Adam Reynolds for the Broncos can’t be overstated and it’s showing here. The Brisbane #7 sits just behind Moses in sixth place at +7.11 points added, a massive jump from the +2.64 he averaged as a Rabbitoh last season. Tyson Gamble has also benefitted from his presence and an improved Broncos team, also placing inside the top 10 with +5.5 NPRF per game.
Net Points Responsible For also allows us to see which players are allowing the most points per game as well. Most of the names below will not shock fans of their teams.
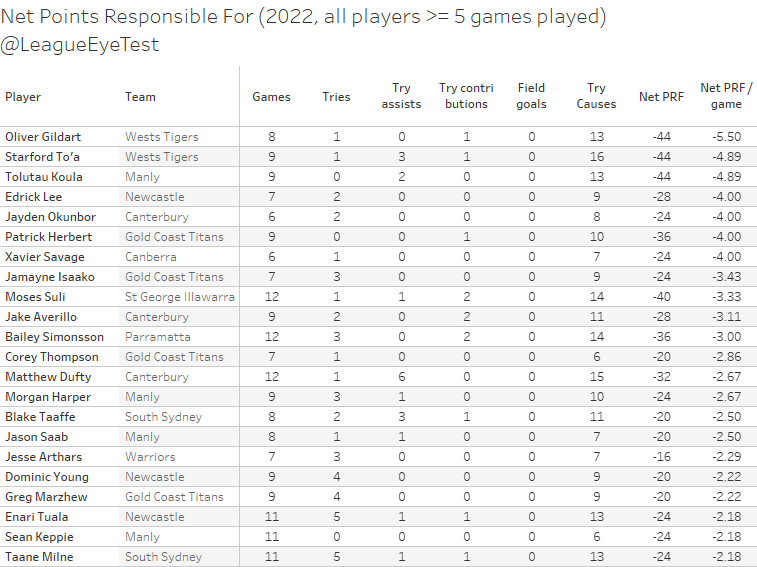
If we flip the chart, Wests Tigers Oliver Gildart takes out the dubious honour of worst NPRF average for the season, conceding -5.5 points per game. His team mate Starford To’a isn’t that far ahead of him at -4.89 per game, and has conceded an NRL worst 16 try causes in 2022. That is only slightly ahead of Matt Dufty’s 15 try causes, and the Dogs fullback ranks 13th worst in the NRL at -2.67 per game. Dufty’s teammate Jayden Okunbur also features highly here (5th place), which would not be a surprise to anyone who has watched Canterbury play this season.
Error Rate
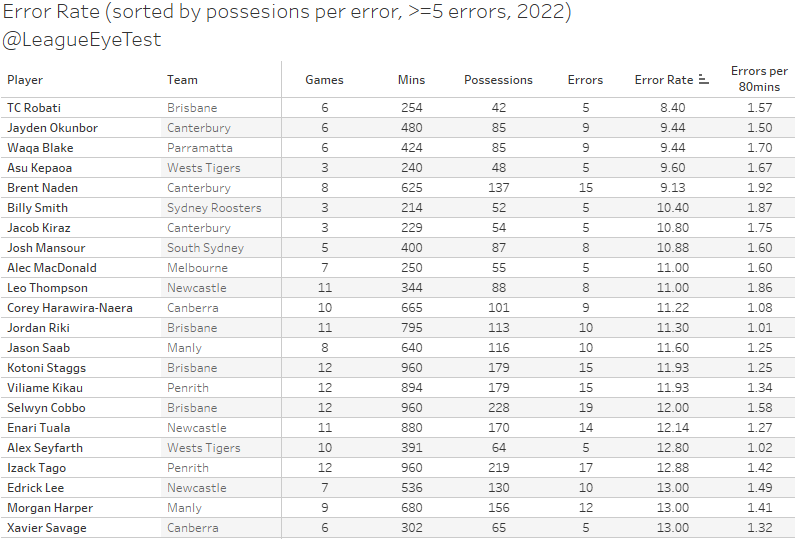
The one thing I like about Error Rate is that it usually matches the eye test (not this one, the actual one). Last year’s leader at this time was the Dragons Jordan Pereira with a rate of 7.0 possesions per error.
For 2022, Brisbane’s TC Robati has the worst hands in the NRL this season, committing an error every 8.4 touches of the ball. Following him is the Bulldogs Okunbur, again rating highly in a negative category at 9.44 in second place, tied with Parramatta’s Waqa Blake.
Origin debutant Selwyn Cobbo was leading this statistic for most of the season, but his 18 errors came in his first seven games and has committed just one since then. His Error Rate of 12.00 is much more respectable than the 5.0 he had after Round 5. Brisbane had a number of players inside the top ten for the first two months of the season, and clearing up their handling issues has been a factor in their form improving.
I should note that the Tigers Asu Kepaoa was in first place prior to Round 12 but played an errorless game on the weekend. Kepaoa had five errors in his first two games, with only 32 touches which resulted in an error rate of one every 6.4 receipts and 2.5 every 80 minutes. The clean sheet he had in Round 12 pushed up his error rate to 9.60.
Tackle Rate

Penrith’s Matthew Eisenhuth leads the way for this metric after 12 rounds, with a Tackle rate of 33.48% whilst on the field in his eight games. Basically, Eisenhuth was completing a tackle on one third of all possessions the Panthers faced this season, and he was a more than reliable fill-in whilst Moses Leota sat out with a shoulder injury.
The Gold Coast’s Jaimin Joliffe, a regular face in for these measures, comes in second at 33.19% while the Bulldogs Bailey Biondi-Odo ranked third at 32.33% in his 17 minutes per game.
One of the Bulldogs bright lights this season, Max King, placing came in right behind his team mate in fourth place with a Tackle Rate of 32.94% in 40 minutes per game. Penrith joined Canterbury with two players inside the top five as Scott Sorensen’s 32.09% Tackle Rate placed him fifth.
All three are below last years first half leader, another Origin debutant in Reuben Cotter, who was completing a tackle at a rate of 34.85% in 2021 before needing Lisfranc surgery on his foot. Again the 2021 statistical inflation can been seen here with lower tackle rates as the ball is in play less.
Ball Runner %

South Sydney’s Liam Knight ranks first for Ball Runner %, clocking up a run on 17.81% of the Rabbitohs possessions whilst he was on the field this season and hopefully he continues to be healthy after a string of concussions in 2021.
Keep in mind the average for a middle forward is in the 10-12% range, meaning a 17%+ Ball Runner Rate is almost 50% higher than the average NRL front rower. It’s also higher than Spencer Leniu had last season (17.11%) under more favourable conditions to generate statistics. It’s also notable that Leniu doesn’t chart highly this season as his role has changed, with his Ball Runner % sitting at 13.32%.
Melbourne’s late season addition from last season Tepai Moeroa nabs second place with, running the ball on 17.07% of the Storm’s possessions whilst he is on field. Manly’s Josh Aloiai rounds out the top three at 16.33%, slightly ahead Brisbane’s Corey Jensen (16.25%) and Aloiai’s team mate Taniela Paseka in fifth place (16.11%).
Total Run %

Moeroa may have been pipped for first place in Ball Run %, but once you factor in the 24 option (decoy and support) runs he’s made this season, his 25.79% sits almost 2% higher than any other play in the league. That’s completing a run or option run in over a quarter of every Storm play with the ball this season in his 17 minutes on field, showing how to make the best use of limited minutes.
That 2% difference takes us to the Roosters’ Fletcher Baker ranked next with a rate of 23.36%, with another Sea Eagle in Toafofoa Sipley, who completed a run with the ball or option run in 23.82% of Manly’s plays whilst on the field.
Cronulla’s run machine Royce Hunt moved into fourth this weekend with a Total Run % of 22.26% for the season. South Sydney’s Davy Moale would have placed fourth with a Total Run % of 22.76% but fell short of the minute qualification having spent only 114 minutes on field.
Involvement Rate
It’s the first year since I’ve been doing these statistics that there is no Daniel Alvaro. I’m trying to stay composed, honestly.
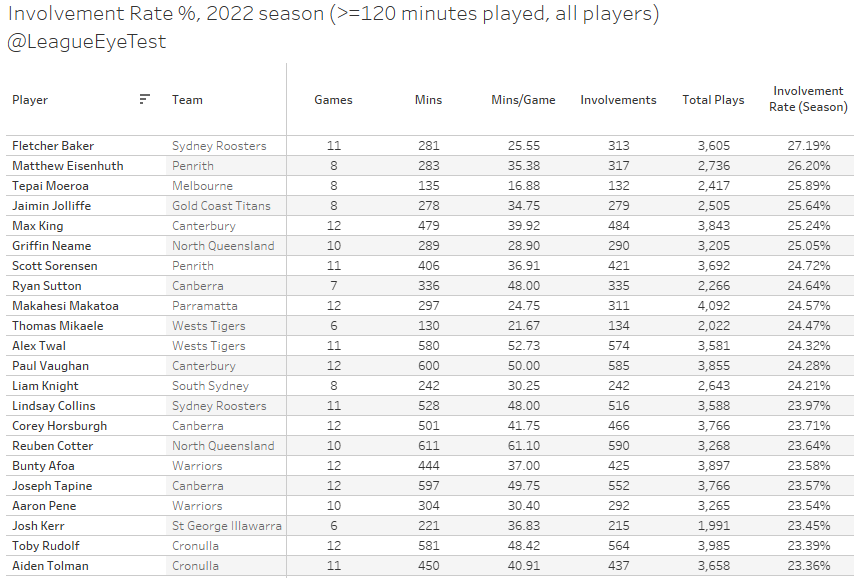
Once we bring both sides of the ball together, you’ll see a number of familiar names from the preceding stats and it’s Sydney’s Baker who comes in first. The Roosters forward completes a tackle, run or option run on 27.19% of plays during a game whilst on field, or more than one in every four plays.
Second place was Eisenhuth at 26.20% and Moeroa third at 25.89%. Also making a second appearance here were Jolliffe (25.64%) and Max King (25.24%).
For the workload connoisseurs like myself, Cowboys youngster Griffin Neame has had an impressive start to the season with an Involvement Rate of 25.05% which sits him just out side the top five in sixth spot.
On the other end of the age scale, Parramatta’s Makahesi Makatoa, who was playing NSW Cup this time last year, sits in 10th spot at 24.57%. It’s one of the reasons why I’ll always state that you shouldn’t be overpaying for middle forwards, as you can find value at that position in a number of places.
I would also like to note Ryan Sutton placing in eighth place, the only player inside the top 10 to play more than 40 minutes a game. Sutton’s ability to be involved in nearly a quarter of all plays whilst on field for 50 minutes a game is a testament to his motor. The Tigers Alex Twal is the next high minute forward, ranking 12th with an involvement rate of 24.32%.
Lindsay Collins would have been inside the top 10 this season but his increase in minutes from the past three rounds have dropped his involvement. From Rounds 7-9 Collins played 46 minutes a game and had an Involvement Rate in the 26% range.

The last two rounds have seen him play 62 and 57 minutes and his involvement rate has dipped significantly and Round 12 saw his lowest involvement rate since 2020 at just 18.62%. Clearly the high 40 minute range is where the rate of his workload peaks but given the makeup of Trent Robinson’s interchange bench he’s having to carry more of the load than would be optimal.

