It’s been an up and down year here at the Eye Test. We’ve had the biggest week in the site’s history recently thanks to a post about sock heights that I expected to be one of the least read posts of the season.
February saw the launching the Eye Test’s expected points model for the NRL, which had a tremendous reception. That lasted about six weeks until Round 2 when the data source I was using disappeared. Should that data ever return, so will ETxP, but for now it’s on ice.
So much like the modern-day rugby league middle forward, I’m trying to be more agile and it’s time to pivot to something different. Over the past off-season I had toyed around with some player rating models but never felt satisfied with the outcome and couldn’t find an approach that worked.
Thanks for reading The Rugby League Eye Test. Subscribe below to receive new posts in your inbox
I’ve been using Net Points Responsible For (NPRF) as a metric over the past two seasons and at a very high level find it’s useful for identifying strong playmakers and players who concede a lot of tries. But it also misses the very important contributions of other players on the team who don’t generate a traditional statistic when a try is scored.
Friend of the site Liam of PythagoNRL fame has been using a tremendous system of player rating with his Taylors rating that measures production and subsequent metrics such as Wins Above Reserve Grade (WARG). As much as possible I’ve tried to avoid replicating what he’s done already for two reasons. The first is that it would be redundant and there’s no need for two metrics showing the same thing. The second is that even if I tried, I couldn’t come up with a system as well designed and thought out, Taylors are the gold standard.
That said, the research he’s done has formed the basis of what I’m talking about today – the Eye Test’s Player Contribution Rating (ETPCR).
In summary it is an possession adjusted estimation of the number of points (positive or negative) that a player contributed above and beyond the average player on an average team.
Let’s get into how it works and the results. If you want to avoid that and skip to the ratings themself, scroll down to about half way.
The method
Much like ETxP, this is version 0.1a of ETPCR. It’s far from final and there will likely be plenty of changes as it evolves. However, for the time being it’s stable enough that I’m happy to release it.
I’ve taken eight seasons of player data (2014 to Round 12 2022) from the Fox Sports Stats and ran regressions against margin of victory per game to correlate which statistics contribute to not only winning a game but winning by more points. If a player or team does more of these things, then they should theoretically be winning more games and by a wider margin.
One of the advantages of using the Fox Sports data that I usually analyse instead of the NRL data set is that they have not only try causes, which I use in Net Points Responsible For, but also line break causes. That gives us some more defensive statistics that we can use to try to quantify defense for players, is one thing that is missing from Liam’s Taylors metric.
I’ll also note that I’m using publicly available numbers through Fox Sports, which means unlike what unfolded with ETxP, these should be readily available continually. Now watch them go and remove Try Causes or something. It is similar to the Box Plus Minus metric for the NBA, in that all data is publicly available and there’s no advanced tracking or location data used that isn’t widely accessible.
Given that we have more defensive stats at our disposal, we can split them into two buckets, one for positive contributions and one for negative contributions. Yes, we have Positive PCR and Negative PCR buckets, a surefire SEO success.
On the positive or attacking side we have the following groups of statistics that we’ve linked with higher margins.
- Tries, try assists, try contributions, line breaks, line break assists, offloads
- Run metres (both pre contact and post contact), number of runs shorter than 8 metres, number of runs longer than 8 metres, dummy half runs
- Kick metres, attacking kicks, weighted kicks, forced dropouts
Some of these like attacking kicks and weighted kicks have a small influence on winning and the size of the margin but are included to provide some minor points of difference for halves.
On the defensive or negative side, we have the following statistics.
- Missed tackles
- Errors
- Penalties conceded
- Try causes
- Line break causes
While errors isn’t a defensive statistic, it has a negative correlation, so it’s grouped with them even if the name of the bucket is a misnomer.
The total for positive scoring will always be at or above zero, and the total negative scoring will be at or below zero. By splitting the numbers into positive and negative groupings, this enables to do some more detailed analysis of players and where they are supporting a team winning or detracting from it.
You’ll notice I’ve not included tackles made in this, and it’s for the same reason that Liam didn’t include it in his model. There’s a negative correlation with making more tackles in game, meaning the more tackles you make the more points you’re likely to lose by. Which isn’t how the game works, and players like Reuben Cotter making 50 tackles can be valuable. However, it’s not something that is easily attributable and it’s something that requires a more qualitative input as well as quantitative.
Even a statistic like one-on-one tackles, which you might think should correlate with defensive ability, doesn’t have a connection with winning or margins. My assumption on this is that if you’re needing to make a one-on-one tackle then your defensive line is already in trouble.
What the lack of tackle data does is make it nearly impossible to quantify one particular position properly, but we’ll get to that later.
Getting back on track – once we’ve completed the regression for these statistics and found their connection with scoring or conceding more points, we then apply these coefficients and correlation to a player’s raw statistics at a single game level to determine the total “involvement” they had during that game.
When we move on to individual game data, initially we’re working under the (sometimes incorrect) assumption that all players on a good team are equally good, and that all players on a bad team are equally bad. We then look at a players statistics for that game to determine what impact they had for their team. If a player had fewer try causes or missed tackles, that means they are likely to be better defenders. Similarly if players had more tackle busts or try assists, we would assume they were more impactful in attack.
Using these statistics, we determine the percentage of a player’s single game statistical production against the whole team’s production for that game, grouped by both positive and negative scores. This gives us the weighting to attribute the number of points scored or conceded to each player to determine their impact in said game and attribute points individually instead of assuming each participated equally.
The next two steps are to adjust these raw numbers for minutes played and amount of possession. For minutes played, I’ve taken a similar approach to Taylors where a player’s contribution is weighted up or down slightly depending on how many minutes, they played in that game compared to the average of that position.
For possession, I’ve pro-rated the volume of attacking and defensive possession to a standard 135 play the balls on each side. Why that number?
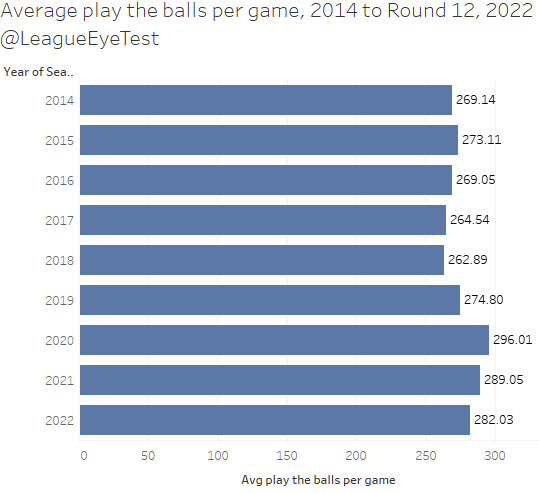
Over the course of the last eight seasons, the average number of play the balls hovers around the 270 range, except for the insanity that was COVID and short-sighted rule change affected 2020 and 2021 where the numbers were closer to 300. Given that, I’ve excluded those seasons from the possession adjustment as they’re clearly outliers.
This adjustment affects teams differently. A side like Penrith, who are averaging north of 155 play the balls per game in attack, will have their contribution scores down weighted by around 8-10%. On the flip side, a team like Melbourne, who average 134 play the balls per game in possession would see a very minor uplift in their attacking contribution. The Storm also only allow 126 play the balls per game, the lowest in the NRL, so their negative statistics will also increase.
The possession normalisation I feel is a key part in enabling apples for apples comparisons of players across teams and seasons. It’s a good way of trying to normalize the statistical inflation we saw in 2021 and to a lesser extent late 2020 and ensuring that teams who hoard possession aren’t overly rewarded.
For an example of how this all ties together, let’s take a theoretical game that the Melbourne Storm win 32-16. If we say that Ryan Papenhuyzen’s positive statistical contribution from a game made up 15% of the Storms total raw production, we then take 15% of the 32 points scored to get his raw contribution rating. If his negative contribution was 5%, his negative contribution rate would be -0.80 for the game, giving him a raw total of +3.70 for that match. Then we adjust accordingly for the number of minutes he plays compared to the average fullback, and then weight by the number of play the balls the Storm had and faced to get our final PCR number. That number then represents the total points above or below average that Papenhuyzen influences above the average player on a
I’ve also designed this model so that 0.0 represents an average first grade player, which should make digesting these numbers easier. Therefore, any number above 0.0 is the value of a player of a league average player on a league average team. Any number below is below that of a league average player on a league average team. Some positional averages will be slightly above or below 0, but in general a 0 represents the typical player, not adding points but also not allowing points.
It should also be noted that whilst 0.0 is the average, there are far more players averaging below zero than above. The median of all players from 2014 to Round 12 2022 is -0.013. This makes sense in that there are significantly fewer high-level players than fringe level first graders or replacement players.
The results
To show how this all comes together, let’s take an example game that the Melbourne Storm won 32-16. If Ryan Papenhuyzen’s positive statistical contribution from a game made up 15% of the Storms total, his rate would be +4.50 for that game. If his negative contribution was 5%, his negative rate would be -0.80 for the game, giving him a total of +3.70 for that match.
Keep in mind that 0.0 is an average first grader and a negative number doesn’t necessarily mean they’re not of first grade quality, there’s just far more below average players than there are above average. Only 43% of players in 2022 sit above zero, and 57% below. Generally, players averaging 0.0 to -0.5 I would define as below average first graders (who are still useful players), -0.5 to -1.0 as fringe first graders or squad players, and anyone below -1.0 as replacement level.
Now to frame some of these numbers, the highest season average for a player in this dataset is unsurprisingly Tom Trbojevic’s 2021 season where he averaged +5.671 per game. The lowest player (with a 6-game minimum) was Corey Denniss in 2016 with -4.031 per game.
Here’s the top 20 seasons since 2014, with 2022 numbers as of Round 12.
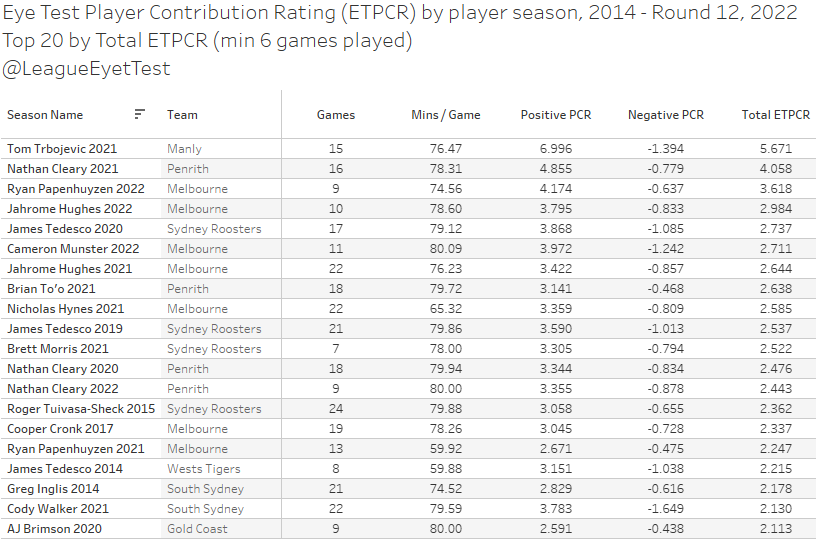
And not wanting to sound like a broken record, it’s another example of the statistical inflation that 2021 gave us, with Trbojevic sitting 1.6 points per game higher than second place, which was Nathan Cleary also from 2021. The highest season not affected by Peter V’Landys short attention span, or the coronavirus, was James Tedesco in 2019 who was +2.537 over the average NRL player. Second place was Roger Tuivasa-Scheck in 2015 at +2.362 and third Cooper Cronk’s 2017 season at +2.337.
Here’s the bottom 20 seasons since 2014.
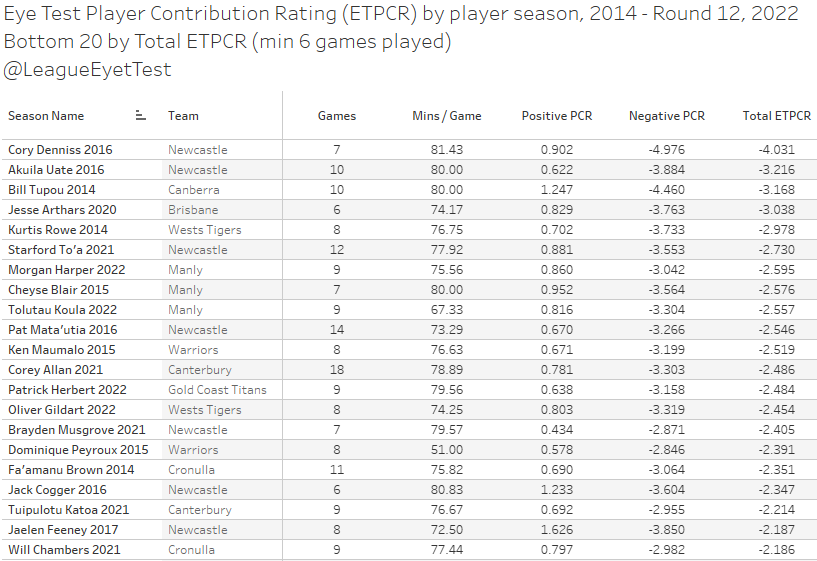
I’ve uploaded a table of all player seasons (with more than 6 games played) since 2014 for ETPCR to Google Drive if you’d like to have a look at some more results.
Next, let’s look at the top and 10 overall for 2022 to get a feeling for how close these numbers sit with perception of players for the current season.
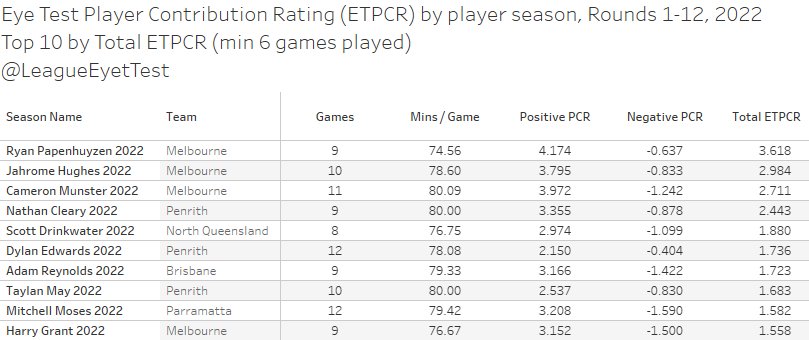
For the top contributors, Ryan Papenhuyzen has been sensational all season and his +3.618 per game is over half a point ahead of teammate Jahrome Hughes at 2.984. Here we can see again just how bloated the 2021 numbers were when Trbojevic was two full points ahead of Papenhuyzen, who himself is +3.6 points better than the average player on an average team.
Adam Reynolds worth to the Broncos (and most by proxy South Sydney) is evident, with the Brisbane half adding 1.723 points per game over average in his nine games. That seventh spot is well up on his 2021 season, where Reynolds placed 37th at just .859 in a point scoring friendly season.
Scott Drinkwater’s excellent season for North Queensland can be seen here as well, placing fifth at +1.880 per game. The Cowboys tremendous defense has helped his Negative PCR score here as well, conceding just -1.099 points. Another Cowboy in Kyle Feldt is producing a career best Negative PCR as well.
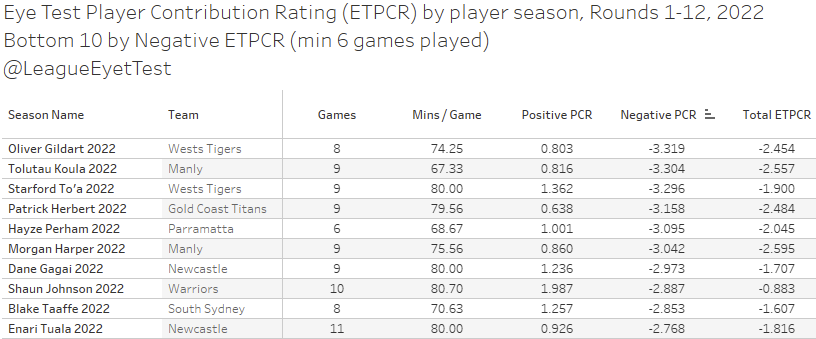
Here’s the bottom 10 for 2022.
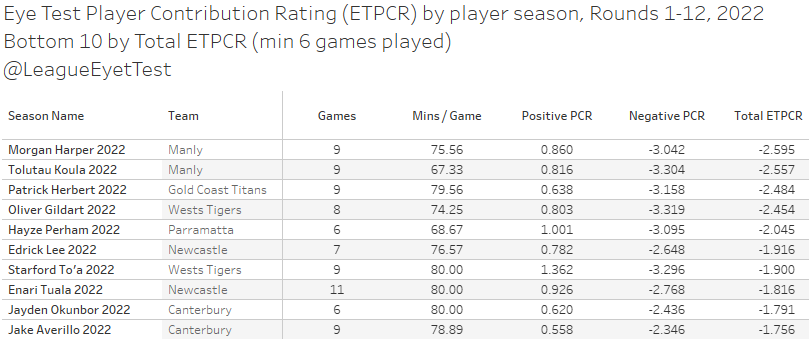
At the bottom end of the scale, Morgan Harper and Tolutau Koula sit as the two lowest overall ETPCR averages for the season (of players who have stepped on the field at least six times). Both have a total ETPCR lower than -2.500, and most of that would have come at the hands of Siosifa Talakai.
There are some other obvious contenders here, with the likes of Patrick Herbert, Oliver Gildart and Jayden Okunbur not having fantastic defensive seasons. This one certainly passes the eye test.
Finally, we’ll split these numbers up in to Positive and Negative PCR leaders. Here’s the top attackers for 2022 thus far.
There’s not a lot of surprises here, other than possibly how high Drinkwater sits at +2.974 per game, ahead of Tedesco and Nicho Hynes. Harry Grant is one of the few hookers that performs well in this model, why exactly that occurs we’ll get into shortly.
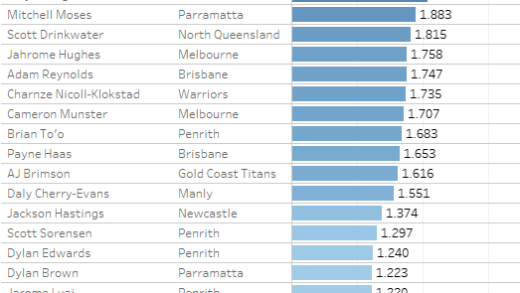
Here’s the players with the lowest Negative PCR numbers, this time top 20. Again, I’d like to point out that 0.0 is the top of this scale.
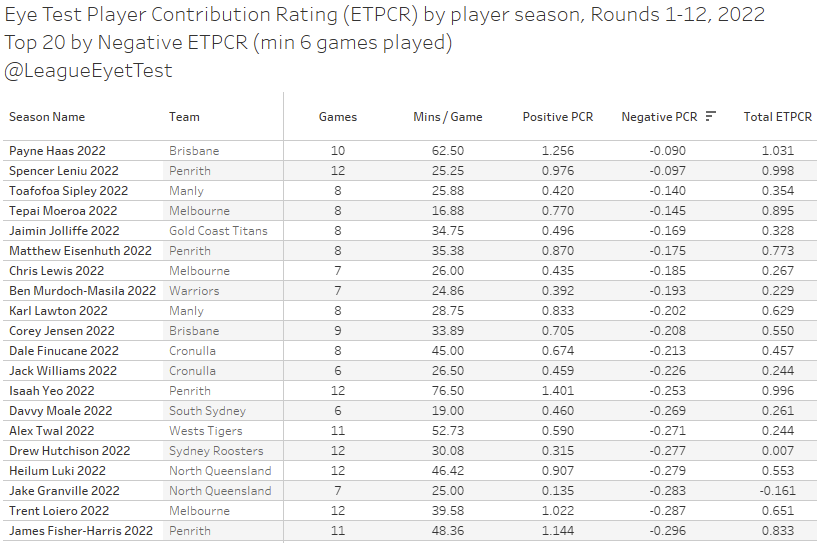
Brisbane’s Payne Haas sits atop of this list, averaging just -0.090 points per game. He’s one of just two players with a Negative PCR of less than 0.1, the other being Penrith’s super sub Spencer Leniu at -0.097. Middle forwards will tend to fare slightly better than those outside them with this metric as the majority of tries are scored down the edges.
It’s worth mentioning that this is not equating these players as good defenders. What it is showing is that they are least likely to make quantifiable mistakes that can be represented under this model. The fact some strong defenders such as Isaah Yeo, Dale Finuacne and Alex Twal are showing up indicates that it is somewhat representative of what we see on field.
To round things out, below are the worst Negative PCR averages for 2022 after 12 rounds.
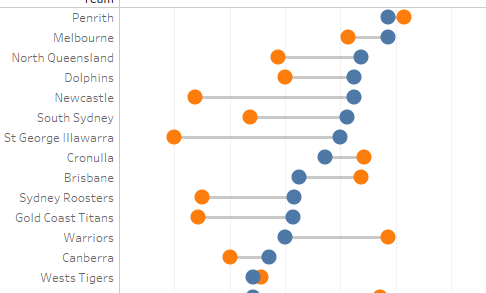
The last chart I want to show in this section weighs up the results of NPRF with ETPCR. I’ve plotted every player season since 2014 in the below comparing the two metrics.
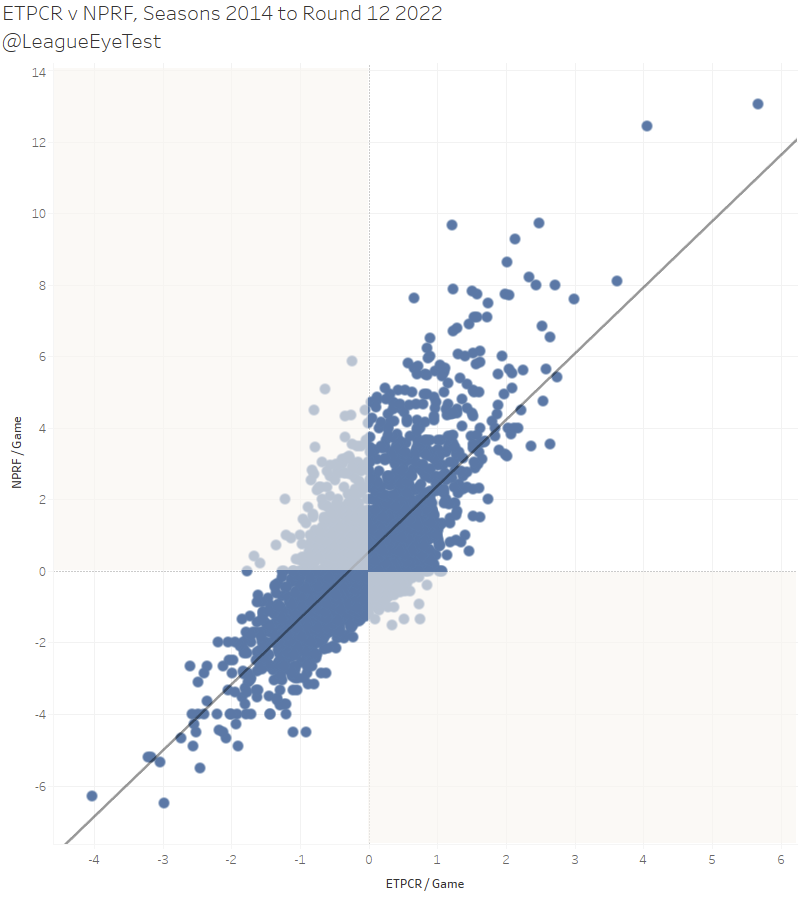
Overall there’s a pretty strong correlation between them, which indicates if you’re contributing points you’re generally doing positive work, and if you’re conceding them you’re generally not. Nothing groundbreaking but nice to confirm.
You will notice though that I have shaded two quadrants, the top left and bottom right. The top left contains High NPRF/Low ETPCR players (eg Brian Kelly, 2021) who score points but also have a high negative contribution. The bottom right contains Low NPRF/High ETPCR players (eg Alex Twal) who generate a lot of “production” but it doesn’t show up on the scoreboard. Almost all of Twal’s seasons end up in this quadrant as well.
I highlighted them both as these are types of players that wouldn’t be accurately represented by NPRF, but with ETPCR we’ve got a wider range of statistics to incorporate and get a better picture of player contribution.
The other thing that we can do with this model is apply it to the NRLW. During the next bye period I’ll be putting up a post on NRLW ETPCR leaders as well as some of the challenges in applying this model to the women’s game.
The limitations
Overall ETPCR paints a reasonably accurate picture of player contribution by position. With one exception – hookers.
The modern rugby league hooker’s basic job is to defend and provide quality service from dummy half. Neither of these can be captured with the publicly available statistics that we can find from the NRL or Fox Sports. Unless you’re willing to use tackles is a proxy for defense, but we’ve already talked about how more tackles doesn’t correlate with winning rugby league games.
In 2021 only 12 of the 39 players who started a game at hooker had a PCR season average above zero, and eight of them played fewer than four games. This season there’s 11 of 28 above zero with just six of them playing more than three games.
A good example of this under representation of a hooker’s value is Reed Mahoney, who ranks 5th among all hookers who have played at least five games in 2022 with a contribution of +1.088 points per game. However, he has the lowest negative average per game of any hooker, regardless of games played at -1.683. Any Eels fan will certainly attest to the fact he’s not having his best season. It’s not surprising when you learn that Mahoney leads NRL hookers in penalties conceded, missed tackles and errors.
Adding them together ranks him 12th with a total contribution of -0.613 in 2022. This number is also well down on his +0.163 points contributed in 2021. So, whilst the total number for hookers doesn’t represent their overall value, it can still serve as a guide for overall performance.
This trickles into another of the limitations of this model, which his that some positions generate fewer statistics which leads to a smaller contribution to scoring points. And other positions – especially second rowers, centres and wingers – play where the majority of tries are scored and therefore concede more line breaks and tries and have lower ETPCR numbers.
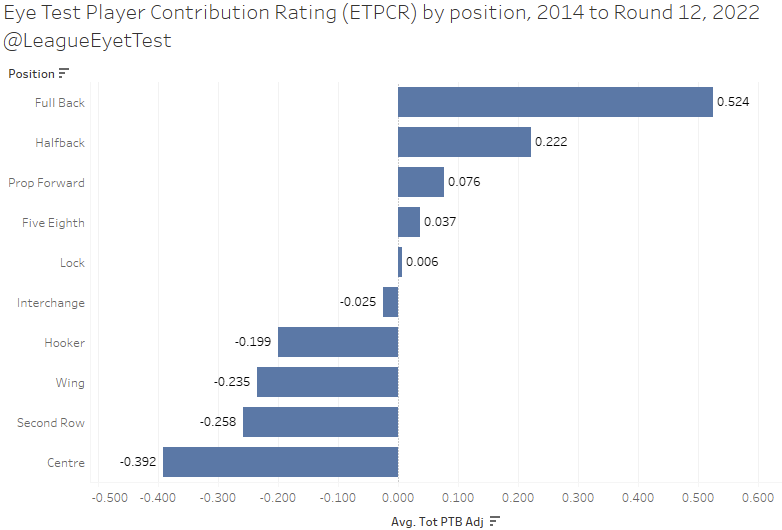
This results in five positions (hooker, second row, centre, wing, and interchange) having an overall negative average. Some of them aren’t by a substantial amount, as hookers average -0.199 and interchange -0.025 ETPCR per game.
Wingers, second rowers and centres don’t fare as well though, with their overall position averages sitting at -0.235, -0.258 and -0.392 respectively. What that means is a player Parramatta’s Will Penisini can be an overall net negative at -0.147 ETPCR per game, but when you compare that to the average output of a centre at -0.329, he’s actually performing more than 50% ahead, and also shows you how valuable someone like Justin Olam is at +1.008.
We could subvert this by making the average 0 by position, but it would then make comparisons across positions impossible. Currently if the negative contribution for a player in the centres is worth -1, that is comparable with a -1 from a second rower or a winger. If we normalize each position to zero, then a -1 for a centre doesn’t equate to a -1 for a winger and there’s a loss of attribution for points conceded. For now, I’d rather keep the contribution imbalance across positions, but this isn’t set in stone.
The other limitation with this type of model is that it doesn’t capture the impact of certain types of players. A dynamic edge player like David Fifita or Talakai can be well represented as they are usually busting tackles on the way to scoring tries or breaking through the line. An origin player like Kurt Capewell, who doesn’t threaten opponents with the ball as often but plays a pivotal role in defense ends up as a net negative player and ranks in the 15-20 range by total PCR.
It also doesn’t put any qualitative value on a player’s statistics. Those who generate junk statistics or pad their own statistics will be favoured. It’s another reason why any catch all metrics should never be used in isolation and should be paired with an actual eye test. It’s never going to solve rugby league, just make us “less wrong”.
The Future
As stated above, this is almost an alpha release and I expect ETPCR to change over the coming seasons (if I’m still doing this). And as I said in the ETxP explainer, I’m not going to let perfect be the enemy of good. I think there’s enough value to be derived now by releasing it and tweaking it according to feedback.
The holy grail would be having exact plus/minus scores and number of play the balls faced for players who don’t play the full 80 minutes, removing the need for estimated minute and play the ball adjustments. That’s only a small percentage of players though and would only improve accuracy slightly.
If you enjoyed this post please consider supporting The Rugby League Eye Test through one of the links below.
Scan the QR code or copy the address below into your wallet to send some Bitcoin to support the site Scan the QR code or copy the address below into your wallet to send some Ethereum to support the site Scan the QR code or copy the address below into your wallet to send some Litecoin to support the site Scan the QR code or copy the address below into your wallet to send some Bitcoin cash to support the site Select a wallet to accept donation in ETH BNB BUSD etc.. Donate To Address
 Donate Via Wallets Bitcoin
 Ethereum
 Litecoin
 Bitcoin cash
Support The Rugby League Eye Test
Support The Rugby League Eye Test
Support The Rugby League Eye Test
Support The Rugby League Eye Test
Donate Via Wallets