When Canterbury previously played South Sydney this season in Round 6, the Dogs succumbed 36-16 to last years grand finalists. That score was closer than the game actually was, with the Rabbitohs giving the Dogs two tries in the last ten minutes of a game they had secured shortly after half time.
On Sunday they lost again, with Souths scoring 36 points again. However, this time the Dogs scored 28 of their own, and were leading until as late as the 70th minute.
These two games serve as fitting examples of the differences between Canterbury’s performances under the two coaches they’ve employed this season.
Trent Barrett’s Bulldogs played a very safe and toothless brand of rugby league, struggling to bother the scoreboard attendant or their opponents. The 16 points they scored in that round six clash was the highest they scored under Barrett all season, and they also scored single figures four times in his ten games.
Michael Potter’s Bulldogs are playing a much more expansive brand of rugby league, scoring more than 16 points in six out of his seven games, showing more potency in attack and appearing generally more competitive overall.
The Bulldogs haven’t set the world on fire if you look purely their win loss record since Potter took over. They’ve still only won two games from seven outings since he took over, the same number of wins that Barrett had in his 10 games coaching this season.
But if you look past that and pay attention to anything the Dogs have done on field since Potter gained the top job it’s painfully obvious just how improved they are. As referenced above, they’re scoring points, despite not being coached by an “attacking genius” and also managed to put together back to back wins including the huge scalp of archrivals Parramatta.
What is Potter doing differently that is making such a difference?
Two seasons ago, I had a look at what the Warriors were doing differently under Todd Payten after he took over for Stephen Kearney. I’m going to take a similar approach today. We’ll look at the per game averages by several statistics under Barrett this season and the percentage change in those statistics under Potter.
In a change we’re also going to adjust them for possession. Canterbury was averaging around 136 play the balls in attack and 141 in defense under Barrett. Under Potter they’re playing the ball 147 times a game in attack and only facing 125 in defense. To normalise these numbers we’re going to set them at a baseline of 135 play the balls per game on both sides of the ball.
Why 135 play the balls? That number is the average number of play the balls historically over the past eight seasons which I’ve been using to standardise my Eye Test Player Contribution Rating metric that was launched a few weeks back.
Let’s move on to the analysis. As always, the stats are from Fox Sports Stats.
Below is the percentage change from Barrett to Potter (blue data point) and Potter to Barrett (orange data point) with a line between indicating the gap. A data point being on the right indicates which coach performed better in that regard. I’ve used percentage change as a metric because we’re dealing with small sample sizes (ten games for Barrett, seven for Potter) and it makes the differences easier to compare.
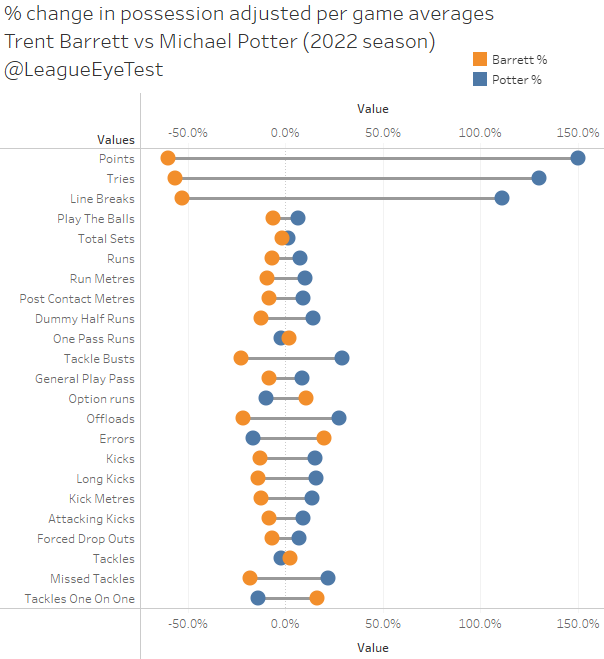
The most striking thing here is just how much better in attack the Bulldogs have been under Potter. The possession adjusted per game increases in points (+150%), tries (+130%) and line breaks (+111%) are quite frankly ridiculous. There shouldn’t be such a dramatic change between coaches at this level, especially one who has been labelled an attacking genius. The increase in points will be even more amazing later, but I’ll keep you on the edge of your seat until then.
When we get into the other stats, things are a bit closer but generally Potter comes out on top again. The Dogs have been in control of the ball more under Potter, with play the balls (+6.7%) and total sets (+1.7%) increasing since Round 10.
Given the increases in possession you’d expect to see similar increases in possession related statistics and that’s the case. Potter’s Dogs are running the ball more (+7.4%), tackle busts (+29%), run metres (+10%) and post contact metres (+9.2%). You’ll also note that almost all of those increases are over indexing against the percentage increase in play the balls which was 6.7%.
They’re also playing a more expansive game and throwing the football around more. General play passes are up 8.8%, with offloads up 28% and dummy half runs increasing by 14%. There’s been fewer one pass runs, your standard hit up, decreasing by 2%. The interesting part of this is that Canterbury is running fewer option runs (decoy or supports) under Potter, at 9.7% fewer than under Barrett.
This probably indicates that whilst the Dogs had a lot of players in motion in attack under their previous coach, they weren’t running lines or shapes that were pressuring the defense, whilst Potter has managed to get more out of less.
Canterbury is also kicking the ball more, with total kicks up 15% and gaining 16% more metres from those kicks.
Discipline wise, errors are also down under Potter (-17%) whilst penalties conceded are pretty much flat between both coaches at less than 1% change. The bigger change comes from penalties awarded, where Potter’s side has been on the receiving end of 20% more penalties.
Now let’s look at the changes in what they’re conceding.
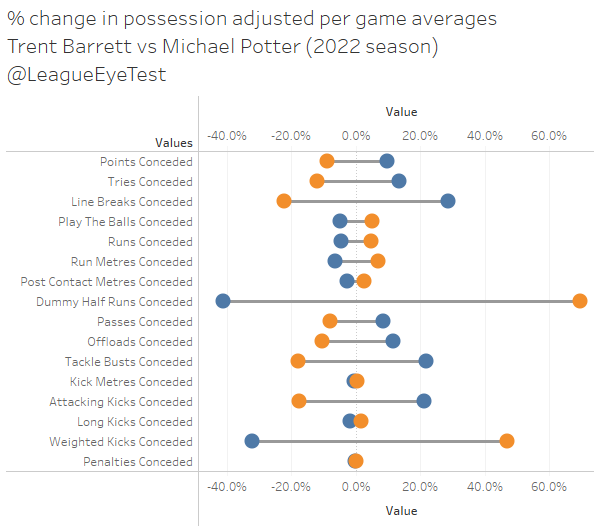
Defensively, the Dogs aren’t much better under Potter but given their improvement in attack they’re able to stay in games longer. Under Potter they’re conceding more tries (+13%), more line breaks (+29%) and more tackle busts (+22%). They’re also doing this with opponents having fewer possessions, as opponent play the balls are down %6 under Potter.
I alluded to it before, but there’s something that makes the dramatic change in point scored under Potter even more surprising. And that’s the Dogs field position.
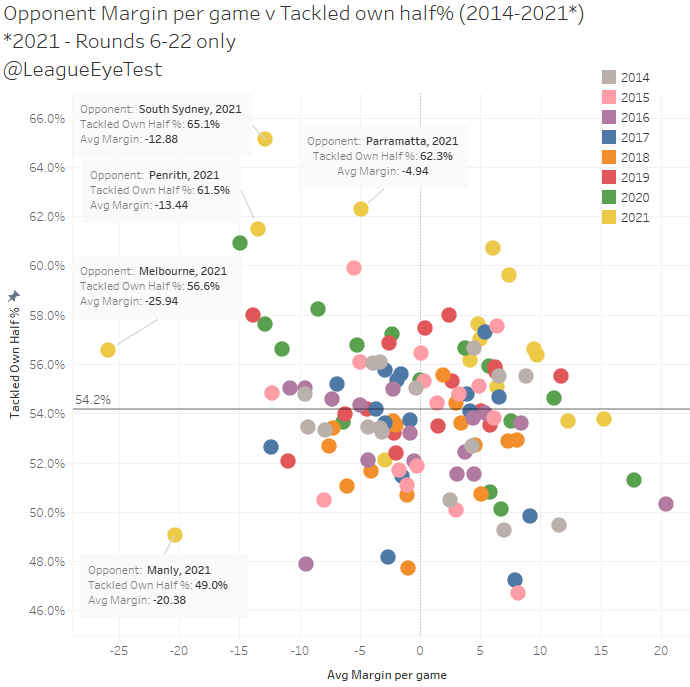
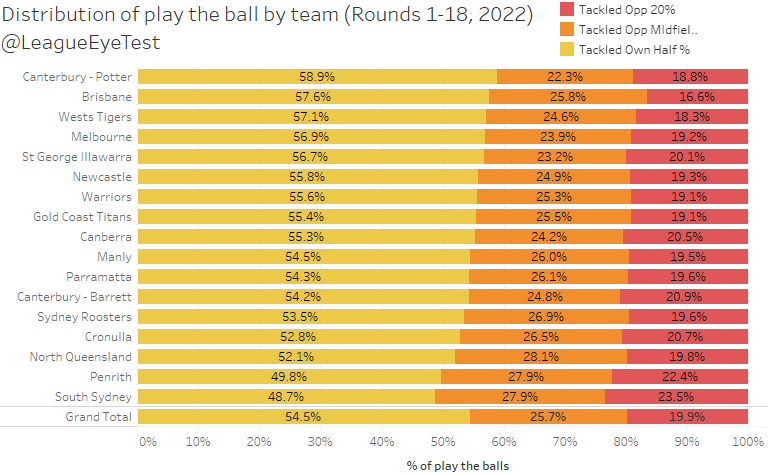
If you’re a regular Eye Test reader you’ll probably have seen this chart before, it’s a breakdown of which zones of the field a team has their play the balls in. It’s broken down into three groups, inside own half, inside opponents midfield (50-20m zone) and inside an opponents 20m zone. Below is the breakdown of every team in the NRL this season, with Canterbury split between time under Barrett and time under Potter.

And here’s where it gets extremely interesting. Under Potter, the Bulldogs have the highest percentage of play the balls inside their own half in the NRL up to Round 18, at 58.9%. Under Barrett that number was 4% lower, at 54.2%, one of the better rates in the NRL.
Barrett’s Bulldogs also spent 20.9% of their play the balls inside an opponents 20 metre zone, only trailing Penrith and South Sydney for time spent inside 20 metres. Under Potter, that number is only 18.8%.
You’re probably getting where I’m going with this now, but we’ll finish up with a look at opponents play the balls first.
Unlike with the ball, defensively they’re maintaining pretty similar field position. Opponents had 50% of their play the balls inside the Dogs half under Barrett and that number is 49% under Potter. Opponents inside 20 metre play the balls were 21.8% under Barrett, whilst that number is only slightly higher at 22.4% under Potter.
Canterbury under Potter have had arguably significantly worse field position, and fewer chances attacking an opponents goal line, yet have averaged 24 points per game, 150% more than before he took over. Under attacking genius Barrett, the Dogs had much better field position yet only averaged 9.7 points per game, 60% fewer than under Potter. Their defense is slightly worse, but given their newfound ability to put the ball over the line they’re drastically more competitive which we’ll get into shortly.
This sort of change might be expected with a new coach coming in at the end of a season and having a clean out of the playing list. The fact it occurred mid-season with minimal to zero player turnover is an indictment on Barrett’s ability as a first grade coach. He may be an excellent assistant coach and given the amount of praise anyone who has worked with him has given that is likely the case.
But the body of work he’s put forward as a first grade coach, and the results his replacement has achieved put in to question how he was allowed to hold the club back for so long. I guess some people don’t like to admit they were wrong. Not me though, I didn’t think I’d ever see Tom Dearden playing Origin football but I’m copping this L and will happily admit it. But I digress.
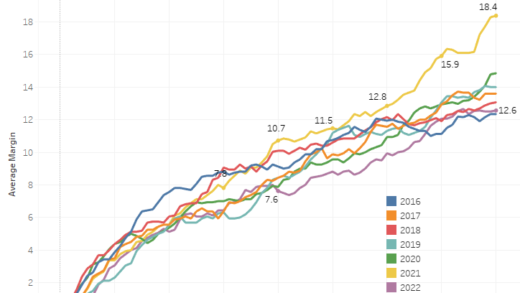
You can see how much more competitive the Bulldogs have been by looking at their margins over the course of an 80 mintue game. Here’s the split of Dogs margins since 2016 with 2022 split by Barrett and Potter.
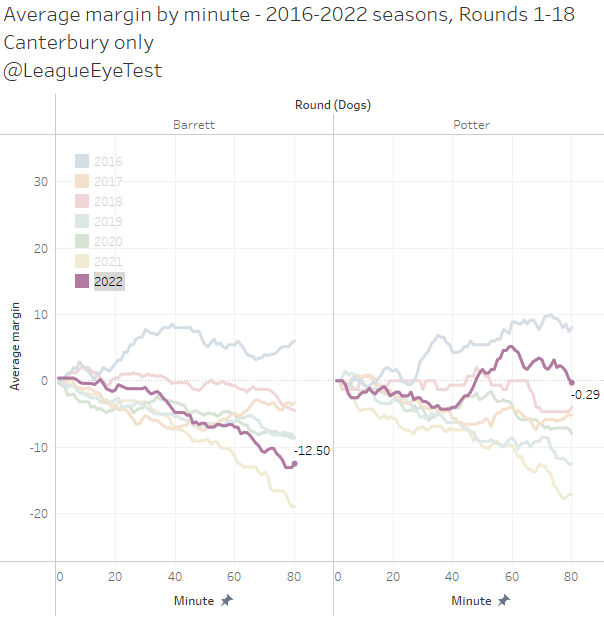
Under Barrett their average margin after 80 minutes was -12.5, whilst under Potter it’s just -0.3 and they’ve been significantly imrpoved in the second half. Part of this is due to some large scores against teams like the Eels, but it was also evident in Sunday evening’s loss to South Sydney. They’re still losing, but they’re putting up a bigger fight in doing so.
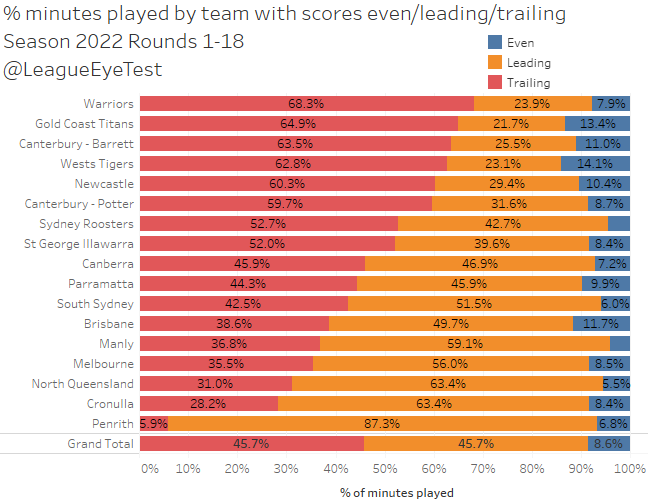
That is also reflected by the percentage of minutes they’ve played whilst leading or trailing.
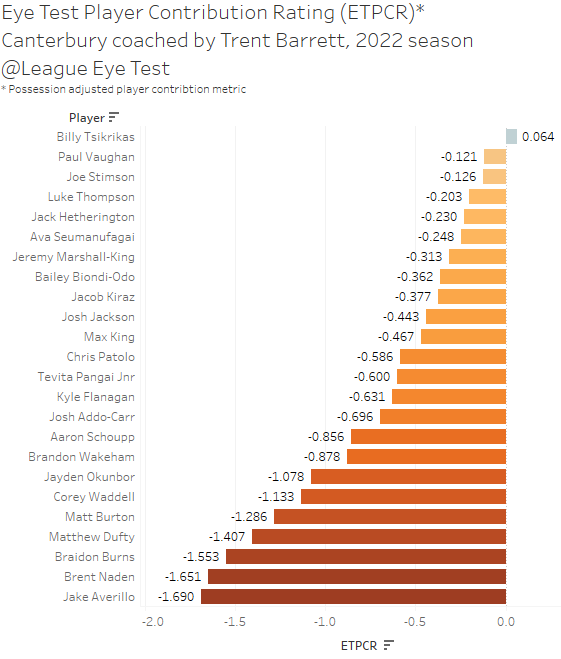
We’ll finish up this week with a look at how Canterbury players have fared under the Eye Test Player Contribution Rating (ETPCR) metric. In summary it’s a possession adjusted attribution of the overall points scored or allowed by a player based on their statistical production during a game.
Under Barrett, the only Bulldogs player with a positive ETPCR was Billy Tsikrikas , at +0.064 from his two games. For a team that concedes a lot of points and doesn’t score many, this would be expected.
Under Potter things look a lot better from an ETPCR perspective. There’s still a large number of players with a negative ETPCR, but there’s also a ten players with a positive one. Potter was also smart enough to hook Jayden Okunbur after just one horrific game, something Barrett failed to do, whilst Matt Dufty only lasted two games.
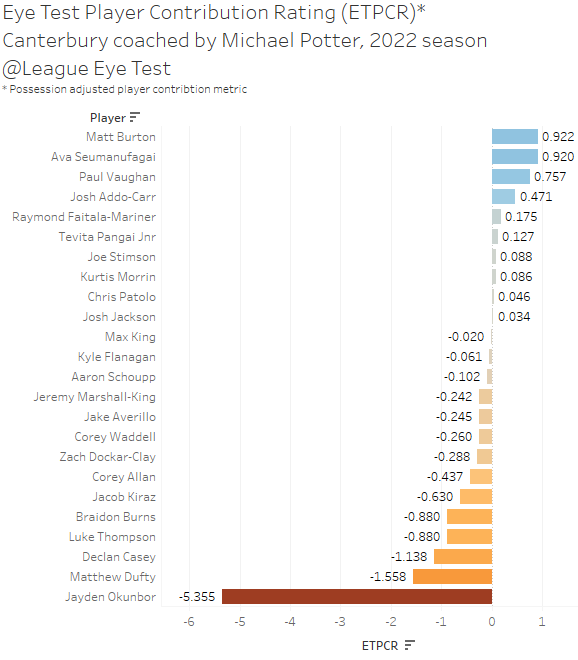
The big increases for Matt Burton (-1.286 to +0.922) and Josh Addo-Carr (-0.0696 to +0.471) again highlight just how much better Canterbury have been since Round 11, and is further evidence that whatever archaic game plan the previous coach had was holding them back.
There’s still some ways to do defensively as we saw on Sunday evening, but there are enough positive signs thus far with Potter at the helm that the Bulldogs could be moving out of the NRL cellar next season.
If you enjoyed this post please consider supporting The Rugby League Eye Test through one of the links below.
Scan the QR code or copy the address below into your wallet to send some Bitcoin to support the site Scan the QR code or copy the address below into your wallet to send some Ethereum to support the site Scan the QR code or copy the address below into your wallet to send some Litecoin to support the site Scan the QR code or copy the address below into your wallet to send some Bitcoin cash to support the site Select a wallet to accept donation in ETH BNB BUSD etc.. Donate To Address
 Donate Via Wallets Bitcoin
 Ethereum
 Litecoin
 Bitcoin cash
Support The Rugby League Eye Test
Support The Rugby League Eye Test
Support The Rugby League Eye Test
Support The Rugby League Eye Test
Donate Via Wallets