It’s been an eventful weekend in rugby league, so I won’t waste any time in getting into the issue that everyone is talking about.
Why is the new lighting at Accor Stadium so dark?
Wait, that’s not the issue everyone is talking about? *checks notes* Ah I see, my apologies, let’s get to the *real* issue that everyone is talking about.
Just why are the Newcastle Knights so terrible, especially in the second half?
Two weeks ago when I ran the Eye Test over the Titans and found they aren’t really good at anything statistically, I off-handedly mentioned that that particular post could have been about the Knights if they had not won their Round 16 clash.
Fast forward to Round 19 and the Knights have conceded at least 40 points in their past three matches, including two straight 42-12 losses. Their deficits at half time in those weren’t unassailable either. Round 17 against Souths was 24-16 at the break, against Manly the following round was 14-6 and last Friday evening it was 16-2 to the Roosters.
They’ve been dreadful enough in their second halves that I thought I’d have a look at just why that is. This comes after a 2-0 start to the season with wins over the Roosters and Tigers. Since that point, they’ve only won 3 out of 16 games and are consistently performing poorly in the second half of games.
There’s a number of similarities between the teams, from sneaking into the top eight last season despite ordinary seasons, capitulating as soon as they get behind on the scoreboard to both sides’ strengths being their forward packs and also trying to blood young players in their spines and outside backs.
Newcastle faced additional issues though. Having their most experienced spine player leave at short notice wasn’t ideal, Kalyn Ponga missing time for multiple concussions and having their first choice hooker tear his Achilles in pre-season put them even further on the back foot.
Adam O’Brien seems to be under the same protection order that Justin Holbrook is benefitting from, as these sort of performances from a coach of a Sydney club would be constantly part of the media cycle. Yes there are extenuating circumstances for the club but the way they’ve been losing is becoming a habit.
So why are the Knights playing so poorly, especially in the second half? Let’s start by looking at some of their first half statistics compared to their second half ones. All data comes from Fox Sports Stats.
To start with let’s compare their average first half margin (green dot) against their second half margin (red dot), with the bar between these points representing the difference. Here’s all NRL team thus far in 2022.
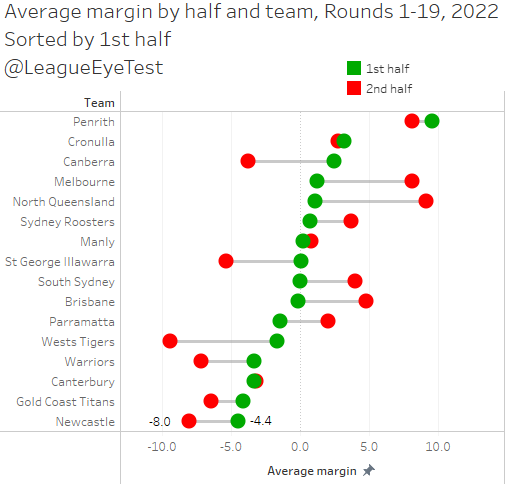
Here we can see part of the Knights issues. They’re already conceding the highest average first half margin the NRL this season at -4.4 for the first 40 minutes. That nearly doubles in the second half though, increasing to -8.0 per game, and only behind the Wests Tigers who end up an average of 9.4 points behind in second halves.
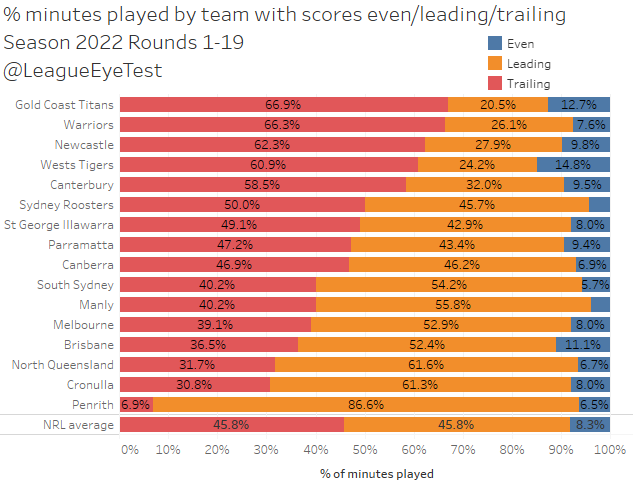
This results in Newcastle spending 62% of their minutes trailing, only ahead of the Titans and Warriors in that regard.
Looking at their margin minute by minute shows that they can be competitive until around the 30th minute, where they trail by an average of 2.11 points. In the next ten minutes that number doubles to 4.4 points down by half time, and then their deficit increase by an average of another 8 points, 7 of those after the 50th minute.
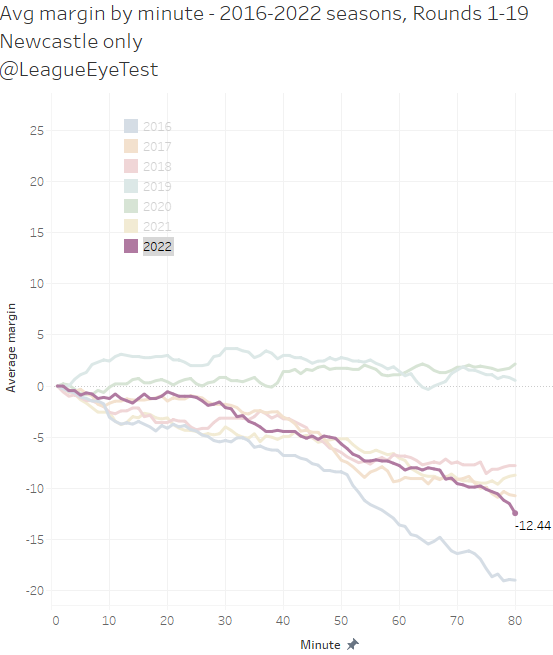
Their second half issues aren’t like the Canberra Raiders or New Zealand Warriors where they are taking leads into the second half and then throwing them away. The Knights aren’t very good in the first half and just downright putrid in second halves of games with little redeeming qualities.
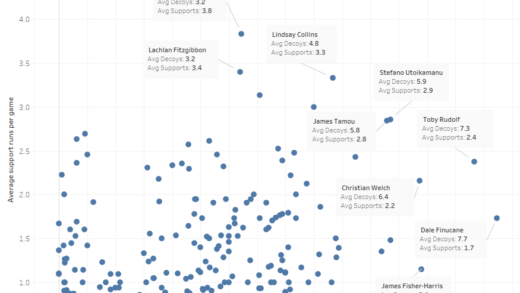
Part of the reason is that despite having a strong forward pack, they’re not making a lot of metres per run. Below is the average metres per run in the first half (green dot) against the second half (red dot).
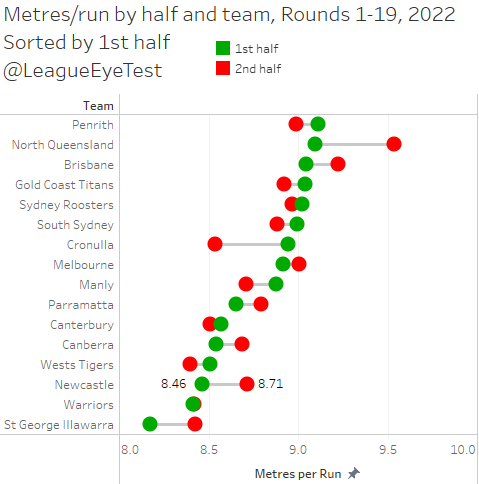
Knights occupy the bottom part of this chart, ranking just 13th in the NRL for first half for metres per run at just 8.46 only beating the Warriors and Dragons. They do increase this in second halves to 8.71 metres per run but that still puts them firmly in the bottom half of the competition.
This is compounded by the average metres per run they’re conceding, which is shown in the chart below.
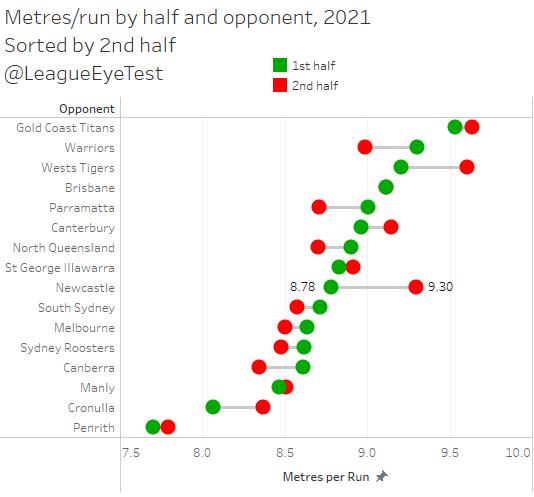
Newcastle sits mid table for this chart giving up 8.78 metres per in in the first half (green dot). The problem for them is that in the second half (red dot) this jumps up over half a metre per run to 9.30, third worst in the NRL behind Wests and the Gold Coast. This would indicate they’re not containing teams as well as the game progresses.
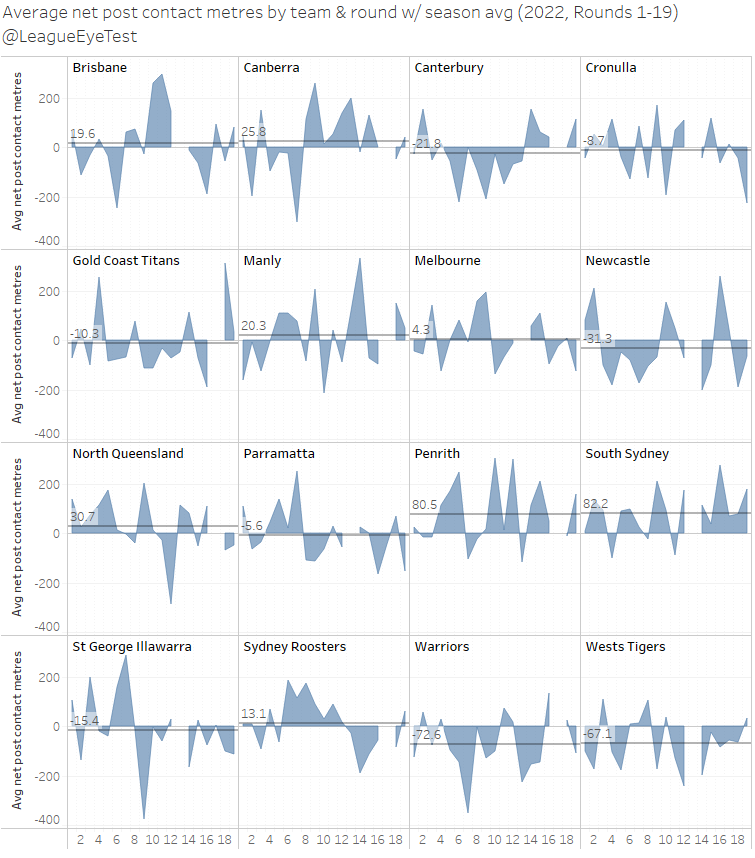
They’re not dominating through contact either, with an average -31 metre net post contact metre deficit per game, only coming out ahead in four post contact metre battles all season.
If you look at the average metres over the course of a set, you see a similar story to metres per run shown above.
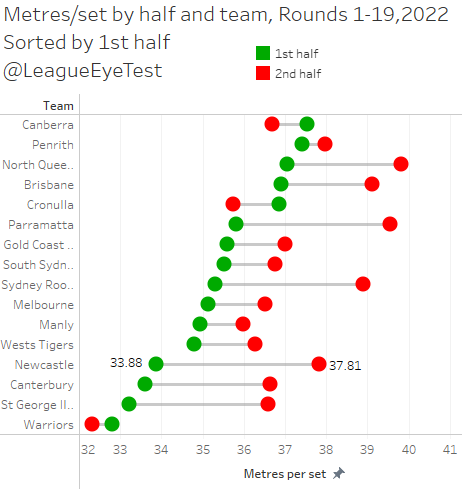
The Knights do improve in metres gained in the second half. Newcastle ranks fourth worst with 33.88 metres per set in the first 40 minutes, but they increase this to 37.81 in the second 40 minutes.
And their opponent metres per set shows the same trend. In the first half, Newcastle concede 36.3 metres per set (ranking them 10th), but that number balloons to 40.6 metres per set after half time.
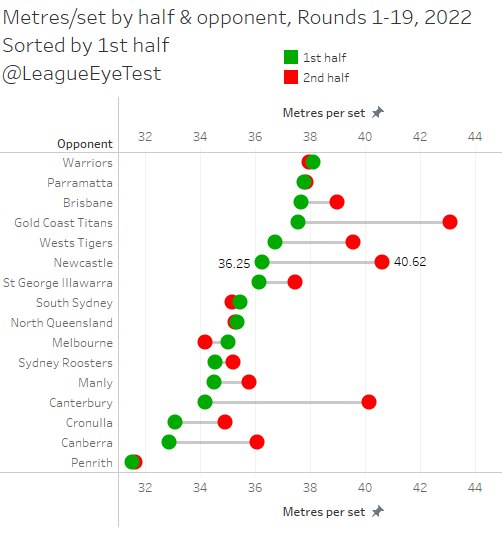
That latter number is second worst in the NRL, only coming in ahead of the Gold Coast at an eye watering 43.1 metres per set.
As a side note – the performance of the Parramatta Eels in this metric should be extremely concerning. The Eels give up 37.8 metres per set in the first half, ranking them 15 out of 16 teams in the competition. Their second halves aren’t much better, ranking 10th and give up roughly the same number of metres per set in both periods.
That contrasts their metres per set gained, where they rank 6th in the first half and 2nd in second periods. This indicates that as long as the Eels can control possession, they’re going to be able to control field position as they gain metres as much as they concede them.
However when the possession dries up, as it did on Thursday against Brisbane, Parramatta struggle to compete. If you can starve the Eels of the ball, their momentum dries up and they’re unable to withstand the field position they allow. There’s a lot of work to be done defensively for Brad Arthur.
Going back to the Knights, if they are increasing their metres per run and set at a similar rate to their opponents, what is causing their second half woes?
The real issue comes in possession. Below is the number of completed sets per half, with first half averages in green and red in averages.
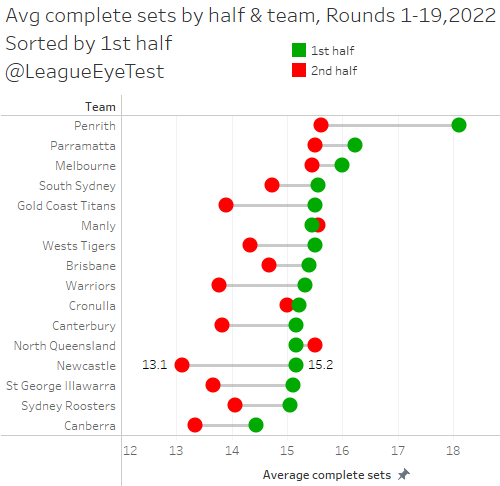
Here’s the real issue which I’m sure those who watch or follow the Knights knew was the root cause. Their first half average of 15.2 completed sets in the first half only places them 12th in the competition. The real kicker though is how much that drops off in the second half.
That number drops by two whole completed sets to 13.1, the largest drop between halves and the lowest average completed sets in the second half in the NRL. That’s fewer second half possessions than the Bulldogs, Titans, Dragons or Warriors. It’s even fewer than perennial second half chokers Canberra.
As we’ve seen above when they do have the ball after the 40th minute they can generate more metres. The problem is the ball spends more time in their opponents hands than in their own.
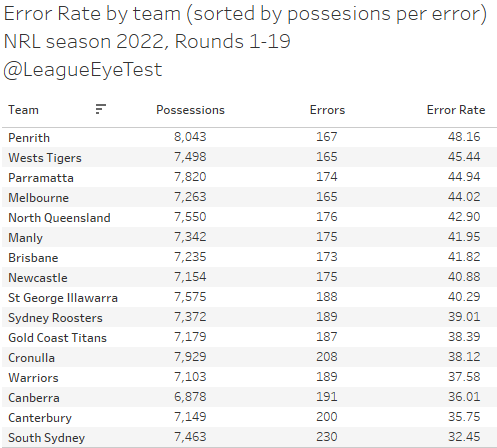
It’s not necessarily error related either, as the Knights are mid table in error rate (number of average possessions to generate an error).
To sum things up, their capacity to get up and down the field isn’t what is causing problems for Newcastle. The real reason they’re so terrible is their inability to maintain or control possession in the second half. Their undoing stems from their inexperienced and constantly changing spine, making poor decisions at the end of set, and putting them on the back foot as they hand over possession. And that’s not even getting ito their defensive issues.
It appears to just be poor execution. Taking the wrong option, making the wrong pass or placing a kick incorrectly and cheaply handing over possession to their opponents. Watching a Knights game is an exercise in frustration as they routinely don’t get Ponga the ball early enough. Not having Ponga creates additional issues as well, and only having your best player play 75% of minutes available in a position that usually plays 100% hurts.
Although if you argued it was a function of coaching or maturity, I wouldn’t argue against it. As always it is most likely a combination of all of these factors.
Looking at each Newcastle players Eye Test Player Contribution Rating shows the affect of playing for a side that concedes so many points without having the ball themselves. It becomes clearer where their defensive problems are and that they’re as equally to blame as their lack of possession.
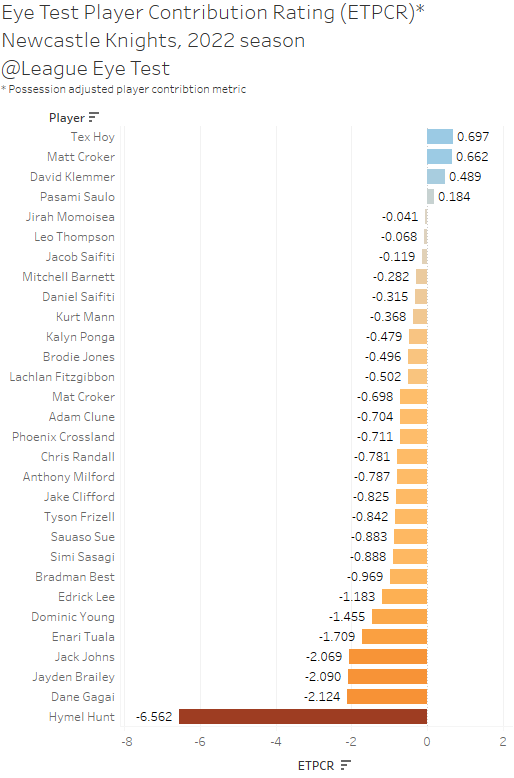
Only a handful of players have a net positive ETPCR, most notably David Klemmer. The rest of their forward pack set as net negatives, but mostly under the -1.0 range. The real issue is the number of points conceded through their outside backs.
Dane Gagai specifically is having his worst season by ETPCR since I started tracking in 2014.
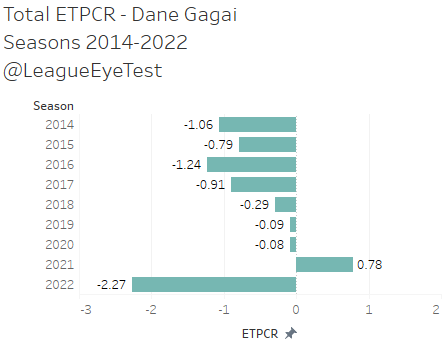
After a tremendous 2021 and two seasons around the 0.0 range in 2019/2020 (keep in mind that the average centre is a net negative under ETPCR) Gagai is now averaging -2.27.
If you break it down by positive and negative ETPCR you can see that you can attribute the fewest positive points and most negative points to him since 2014.
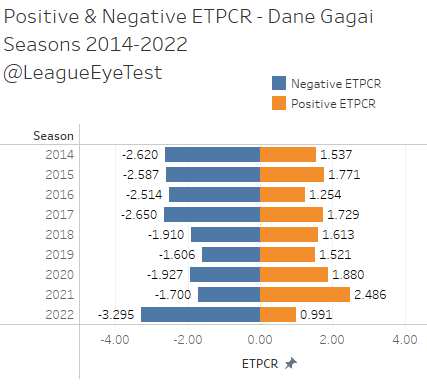
That’s not to say he’s solely to blame for their edge defense woes, just that the end result is has been attributed to him statistically.
Whilst he hasn’t played at the same level he did for Souths last season, his low ETPCR is probably more due to trying to correct others defensive mistakes than making them himself.
If you enjoyed this post please consider supporting The Rugby League Eye Test through one of the links below.
Scan the QR code or copy the address below into your wallet to send some Bitcoin to support the site Scan the QR code or copy the address below into your wallet to send some Ethereum to support the site Scan the QR code or copy the address below into your wallet to send some Litecoin to support the site Scan the QR code or copy the address below into your wallet to send some Bitcoin cash to support the site Select a wallet to accept donation in ETH BNB BUSD etc.. Donate To Address
 Donate Via Wallets Bitcoin
 Ethereum
 Litecoin
 Bitcoin cash
Support The Rugby League Eye Test
Support The Rugby League Eye Test
Support The Rugby League Eye Test
Support The Rugby League Eye Test
Donate Via Wallets