
Thanks to the Broncos handing over their final spot in the NRL Finals to the Raiders, the top eight is prety much set for 2022 barring a major catastrophe.
With those positions likely secured I thought it’d take a look how how these top eight teams sit compared to previous seasons and if that can give us an indication of who might appear in the Grand Final. Is this the most even top eight in the NRL era? And how likely are we to see a team outside the top four make the decider?
Firstly we’re going to look at a plot of points scored and conceded for all NRL era teams (1998 onwards), with 2022 highlighted in orange. All data has been sourced from the Rugby League Project.
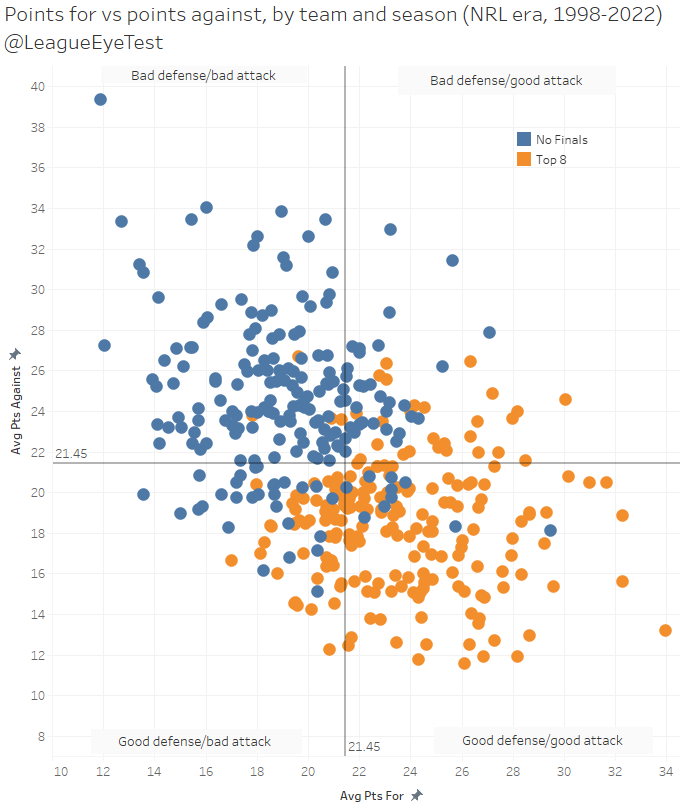
The chart is set up into four quadrants to group teams, defined by the average points scored in a game in the NRL era (21.45). The top left “bad defense/bad attack”, the top right “good attack/bad defense”, the bottom left “bad defense/good attack” and finally the bottom right showing “good defense/good attack”.
A team scoring above 21.45 per game and conceding less than that would sit in the “good attack/good defense quadrant”. A team scoring more than 21.45, but also conceding more than that amount would reside in the “bad defense/good attack” quadrant. It’s a quick way of visualising what the basic strengths and weaknesses are for teams and seeing how they compare historically, and also if and where any anomalies lie.
One of the reason I like looking at this chart, and have done so in each of the previous two seasons, is that whilst you can make the top eight with a bad defense or bad attack, grand finalists generally don’t occur outside of the good attack/good defense quadrant as shown below. It’s a good indicator of where a team needs to be performance wise to be competing for a premiership.

There’s only been five four grand final winners that didn’t have above average attack and defense since 1998. They all come from the 2000-2010 decade including the fairytale 2005 Tigers, the vibes of the 2006 Broncos, 2001 Knights upset of a lifetime and *REDACTED*.
Now let’s look at the same chart from above but highlighted for 2022 only.
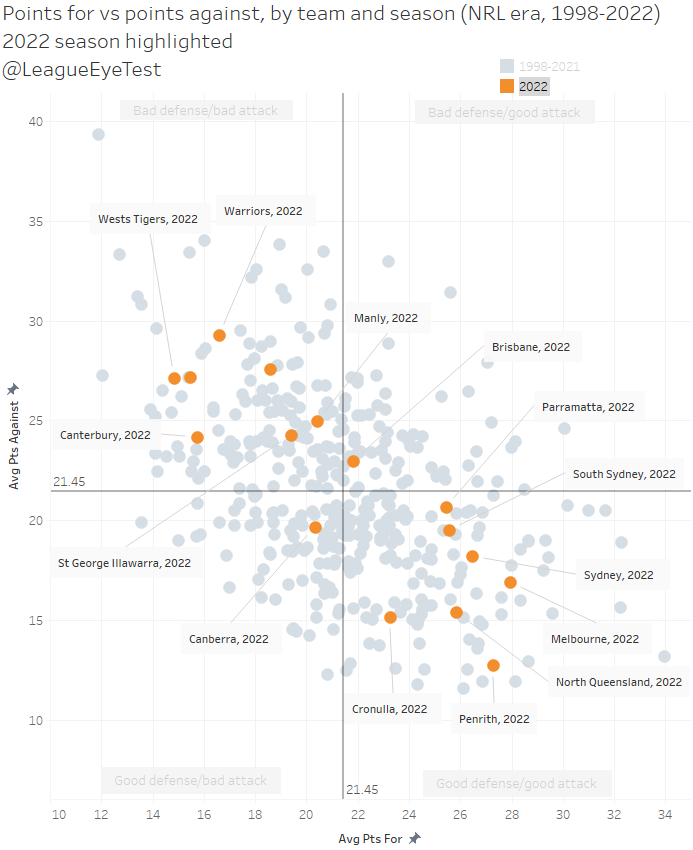
After last years painfully ridiculous this season, things are bit less crazy this year. There’s no points scoring outlier like the Storm or Sea Eagles from the previous season, although Penrith are conceding points at a similar rate to their elite 2021 campaign.
What we do have though is seven teams sitting in the good defense/good attack lower right quadrant, which is a rarity. Looking back through previous seasons, there’s usually 4-5 teams in this region, and usually one of those teams sits right on the league average. And as noted above, it’s this quadrant where grand final winners usually come from.
Those seven teams are are grouped relatively close together as well. Penrith are historically good defensively, but not as dominant in attack as prior seasons. Melbourne also look vulnerable and within the realms of reality unlike 2021.
South Sydney and the Sydney Roosters have timed their runs extremely well and their position on this chart belies their current performances. Parramatta look the shakiest of this seven with the worst defense, and an inability to control opponents without winning possession which we’ve noted before. However they also hold multiple wins over Penrith.
Cronulla and North Queensland have been accused of having soft draws, which is true, but I’ve always been of the belief that you can only play who is in front of you. And both teams have shown they can do it with defense, conceding just 15 points per game this season.
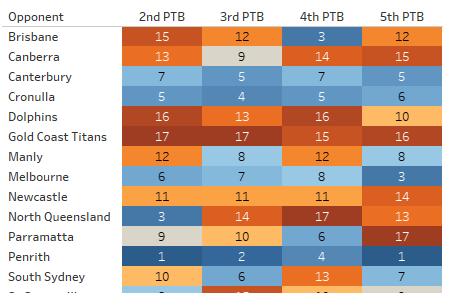
But it is a fact that both teams have had a weak schedule. Below is the average difference in ladder position by team for the 2022 season.
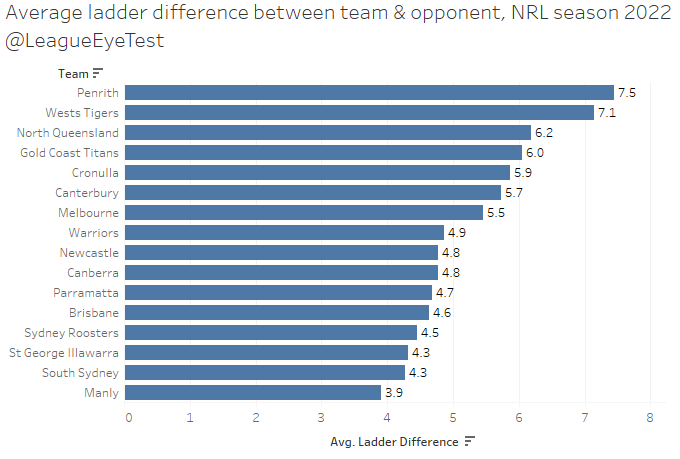
Penrith lead the way at 7.5 spots difference, which given the amount of time they’ve sat in first place is expected. That’s the same case for the Wests Tigers as well, who’ve spent most of 2022 with four fingers on the wooden spoon.
Third place though is North Queensland, at a difference of 6.2 and Cronulla aren’t far behind in fifth place with 5.9. Both have spent extensive time in the top four but their average is higher than Melbourne, who have also spent most of the season in a similar ladder position. The questions about their ability to defeat quality opponents will continue until they manage to do so at full strength.
Another thing to takeaway from the previous chart for 2022 is that there’s only one team in the “good defense/bad attack” quadrant this season, and just one team in the “bad defense/good attack” quadrant. The former is Canberra, and the latter is Brisbane, which shouldn’t come as a surprise then that we’ve seen those two battle it out for the last spot in the finals this year.
To highlight how close this season appears to be, here the same chart as above from the season prior to rugby league’s radically change, the much loved 2019 season.
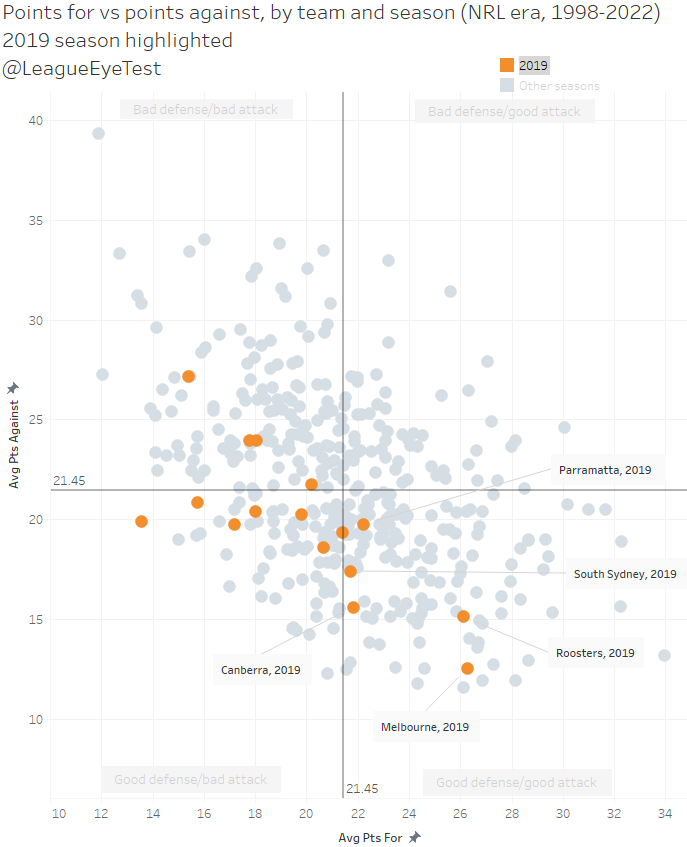
Here you can see two teams sitting alone in 2019, the Sydney Roosters and Melbourne Storm, in the bottom right quadrant. Three other teams also occupy this space (Canberra, Parramatta and South Sydney) but are very close to the league average for points conceded.
One other team sits just ouside this quadrant by 0.03 points per game conceded, which is the Cronulla Sharks. The other thing I’d not here is that even the teams that didn’t make the top eight were generally good defensive teams historically who couldn’t score. Unfortunately things swung around the other way from the following season and we’re still trying to put the toothpaste back in the tube.
This chart also gives you a good idea of how even the 2022 finalists are and why it’s possibly that we could see a team below fourth spot win the grand final. There’s a higher proportion of above average teams this season, something that hasn’t happened regularly in the NRL era.
The flip side to the evenness of thie 2022 compeititon is that there have only been small number of teams outside the top four make a grand final (let alone win one), with just eight sides coming from the lower half of the finals to make the decider since 1998. Below is the same data for the previous charts, but colour shaded for not making the finals, making the top eight, making the grand final, and being minor premier (but not making the grand final).
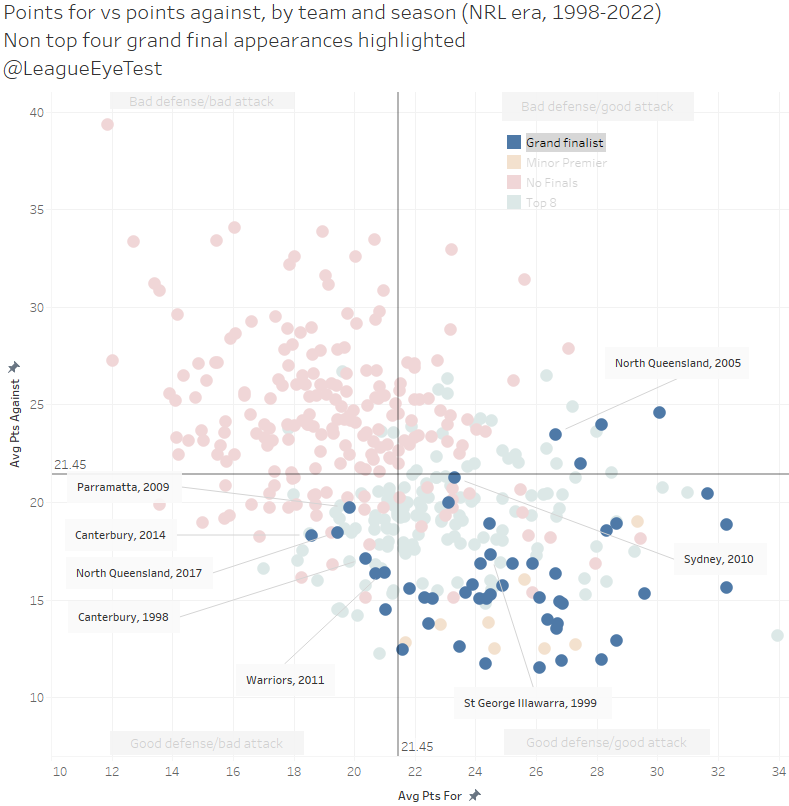
Other than the 1999 St George Illawarra Dragons, each of the other seven sides were mostl league average or below average in attack or defense, or in the case of the 2005 North Queensland Cowboys, below average in defense but above average in attack.
In some comfort for Panthers fans, there’s also only been seven minor premiers who haven’t made the grand final, shown in the chart below. Here’s the same chart as above, but highlighted for minor premiers who didn’t make the grand final.
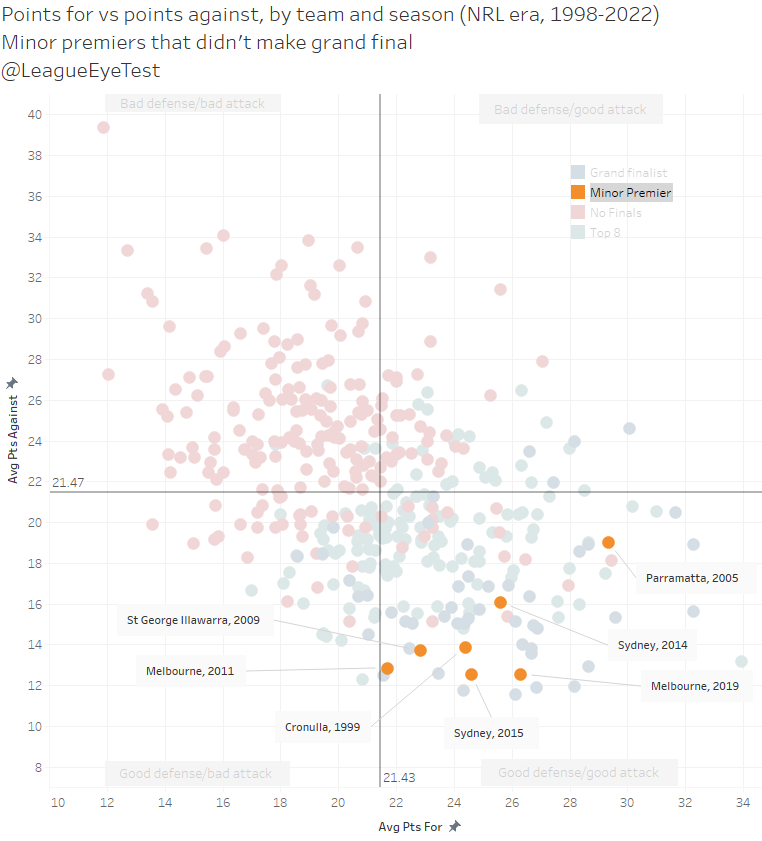
The interesting thing about this cluster of teams is that they were excellent defensive sides, conceding fewer than 16 points per game, except for the 2005 Eels who were more of an attacking powerhouse than defensive juggernaut.
And whilst those teams were extremely strong defensively, it was their inabiltiy to score that led to their elimination. Other than the 2014 Sydney Roosters who lost to South Sydney 32-22, every other minor premier that didn’t reach the grand final failed to score more than 12 points, spearheaded by the Eels 29-0 flameout to the Cowboys.
We’re also not seeing a team like the 2021 Newcastle make the finals, who were one of just a handful of sides ever to make the postseason whilst sitting in the “bad defense, bad attack” quadrant, as shown below.
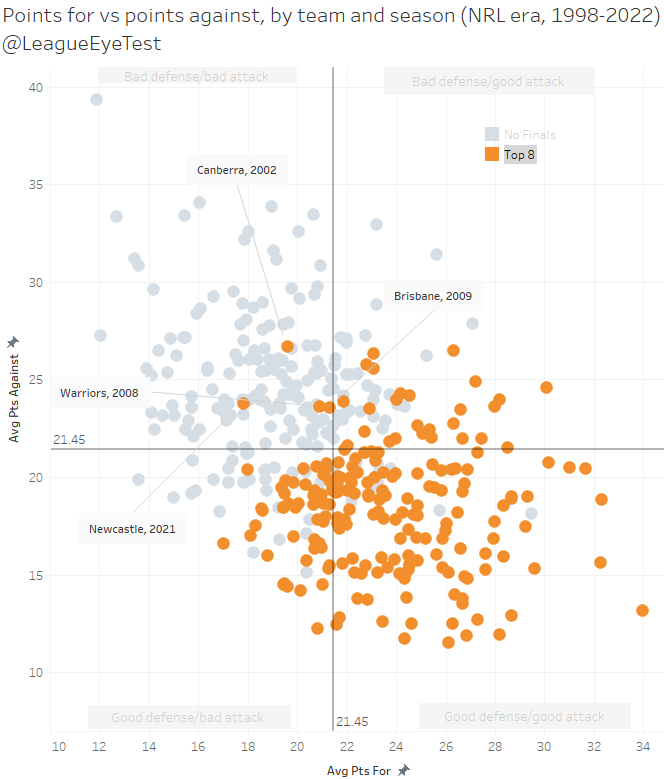
There’s only four sides in the NRL era who have “accomplished” this feat – the 2021 Knights as noted, the 2002 Raiders, the 2009 Broncos and the 2008 Warriors.
The latter three all came from an era where overall scoring was down. The 2021 Knights though came from a season where points were easy to come by and they still couldn’t cross the line. Their average attack of 17.83 per game was the lowest from any finals team since 1998 and are one of just two teams (along with the 2007 Rabbitohs) making the top 8 scoring fewer than 18 points per game.
Like last season, it’s hard to convince myself that anyone other than Penrith will walking out winners on grand final day. It’s also highlly unlikely to happen if you look at historical results. But if the Rabbitohs, Roosters or Eels made it that far, it would be far less surprising than it would have been in previous seasons.
If you enjoyed this post please consider supporting The Rugby League Eye Test through one of the links below.
Scan the QR code or copy the address below into your wallet to send some Bitcoin to support the site Scan the QR code or copy the address below into your wallet to send some Ethereum to support the site Scan the QR code or copy the address below into your wallet to send some Litecoin to support the site Scan the QR code or copy the address below into your wallet to send some Bitcoin cash to support the site Select a wallet to accept donation in ETH BNB BUSD etc.. Donate To Address
 Donate Via Wallets Bitcoin
 Ethereum
 Litecoin
 Bitcoin cash
Support The Rugby League Eye Test
Support The Rugby League Eye Test
Support The Rugby League Eye Test
Support The Rugby League Eye Test
Donate Via Wallets


Nice analysis.
Would like to see this same analysis applied using attack and defence power ratings (regressed to produce lowest mean absolute error) instead so that distortions from strength of schedule and home ground advantages are largely removed.