One of the great tragedies of the 2021 National Rugby League season was that it created a set of circumstances which resulted in some impossible benchmarks that players would never reach again. Untested rule changes widened the gap between the haves and the have nots, and the result was some very predictable outcomes and unparalleled statistical accumulation.
Friend of the site Ben Quagliata wrote about it earlier this season:
“If anything, 2021 has had a negative impact on how we view these stars. 2021 has created negative discourse about how we measure the performances of a Tedesco, a Trbojevic, a Cleary. The goalposts have shifted to an unsustainable metric, a regression to normalcy in turn diminishes anecdotally the feats of years gone past. If this keeps up, we run the risk of effectively asterisking the entire careers of the modern day greats, a product of their era rather than a star of their era.”
Thankfully the 2022 NRL season has wound that back slightly. The change to only allow set restarts outside of a teams’ own 40 metre zone was welcome. The stronger defensive teams could no longer pin opponents inside their own 20 metre zone, knowing full well that absorbing a few extra tackles far outweighed the punishment of conceding 20-30 metres from a kick for touch from conceding a penalty.
But by the end of the season the amount of set restarts being given for teams cynically standing off-side at scrums continued to make a mockery of the game. There’s still a way to go in repairing the damage the nonsensical whims of the game’s boss have caused, but hey it’s progress and I’ll take anything over what we were dished up last season.
Thanks for reading The Rugby League Eye Test. Subscribe below to receive new posts in your inbox
Ideally, we’d end up exactly back where we started in 2019, the last season of rugby league as we used to know it, with penalties for all negative play rather than the situation we have now where the location of the infringement matters more than how much the accused gained from their misdeeds. Allowing teams to be routinely offside with the risk of conceding a few extra tackles two or three times a game isn’t sufficient enough penalty.
A happy medium will probably be set restarts outside 40 metres only for slowing down the ruck given that abolishing the rule would require the almighty PVL to admit he made a mistake. I’ll take what I can get.
Just how much did 2022 reverse the harm that last season caused? Let’s look at how 2022 was a return to (relative) normalcy for rugby league. As always, the data is from Fox Sports Stats.
First up we’re going to examine the average absolute margin per minute for each of the last sevenNRL seasons.

Here’s the start of the good news for 2022. Last year we had an average of 18.11 points per game between sides after 80 minutes, with the difference being 10.7 points at half time and escalating even further in the second stanza.
Most rounds from the 2022 season sat within the range of previous seasons, except for the notorious Round 23.
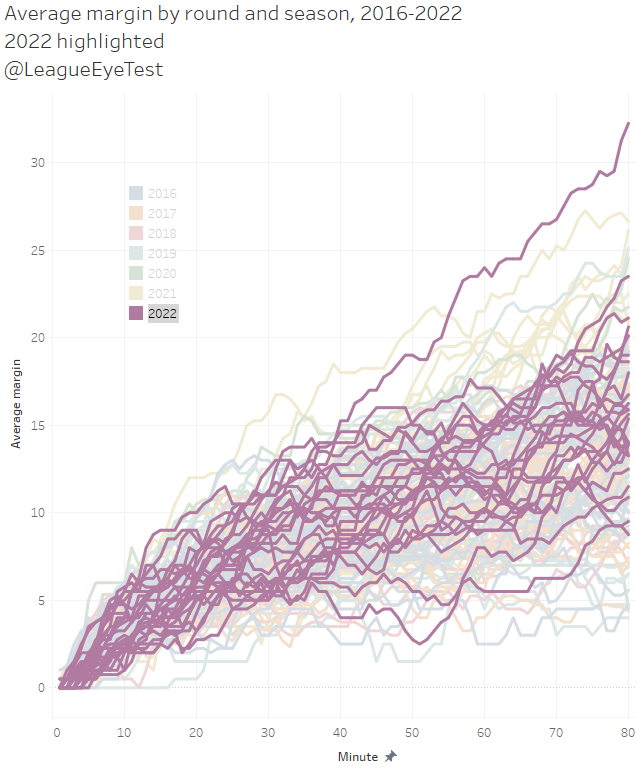
Thankfully this chart shows how much of an outlier Round 23 was and we shouldn’t be making knee jerk decisions based on one sample.
For 2022 the end result was nearly two points per game fewer between sides, at 16.17 per game, and much closer to 2020’s 15.13 points. The good news continues in that this margin only really increased from the 65 minute onwards. Before that it was much more in line with 2020 and at some point sitting closer to 2016.
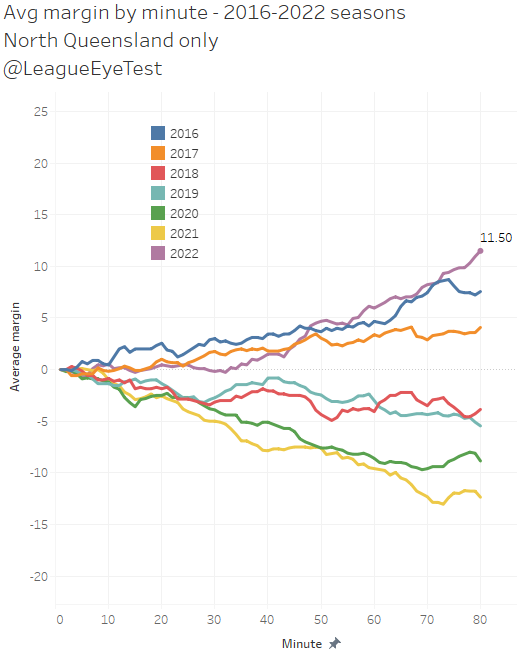
The key point (that we’ll examine in better detail shortly) is that games were closer in 2022 and far less likely to be considered a formality than they were in 2021. Part of that is also due to the North Queensland Cowboys absolutely punishing teams in the second half this season which we can see below.
If we break down the amount of time played by margin based on the number of scores separating teams, it’s even clearer that we were closer to parity in the 2022 season. (As an aside, I’ve recreated my margin data from the last seven seasons so the numbers may vary slightly from previous posts but the trends are the same. )
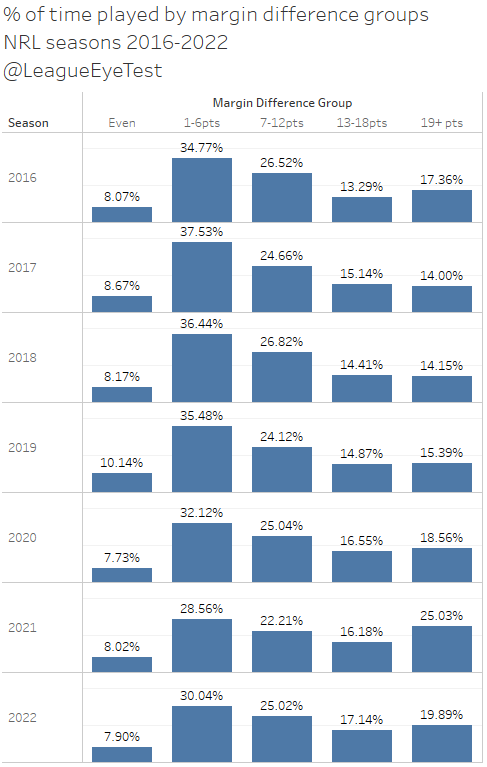
In 2022, we had fewer minutes played in an even game (7.90% this season compared to 8.02% last season) but we had more minutes played with one score difference (30.0% as opposed to 28.56%0, two scores (25.02% to 22.21%) and up to three scores (17.14% to 16.18%).
Even more importantly the time played where scores were more than three converted tries dropped from 25.03% – yes nearly one quarter of game time – down to 19.89%.
The number of minutes played in garbage time (margin of at least 19 points, or more than three converted tries) declined but was still ahead of prior seasons.
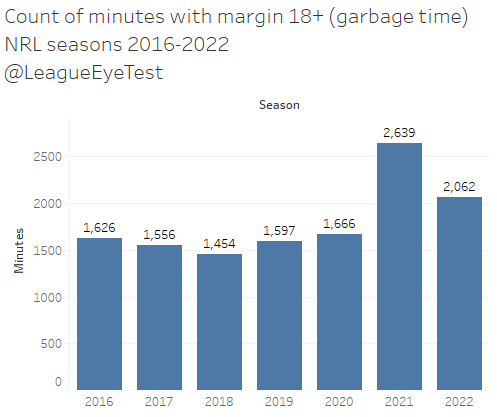
Over 2,600 minutes were played last season where the game result was virtually secured, that equated to around 33 full games of the 2021 season played with a margin of 19+, which is around 18% of the 192 games played in the regular season. This was nearly a 60% increase on 2019, the last season with a full slate of games (only 20 rounds were played in 2020 due to the spicy cough).
For 2022 it fell to 2,062 minutes in garbage time, or just 26 full games and 13% of the total slate of regular season matches.
As I wrote last season, for a game that lives and dies by broadcast revenue, having a product that is considered over by half time is a huge detriment. This was seen with the terrible grand final ratings this season, as the game dropped down to 1.3million viewers as Penrith led Parramatta 28-0.
Unsurprisingly, the leader of the game we love has been unable to extract as much revenue from broadcasters as the other major sporting code, and I can’t help but think that the high volume of uninspiring contests played into that. If only we knew whose fault that was.
But I digress.
One of the things that would be expected to change with more penalties being called is that time in play would decline. And it did in 2022, but not by much.
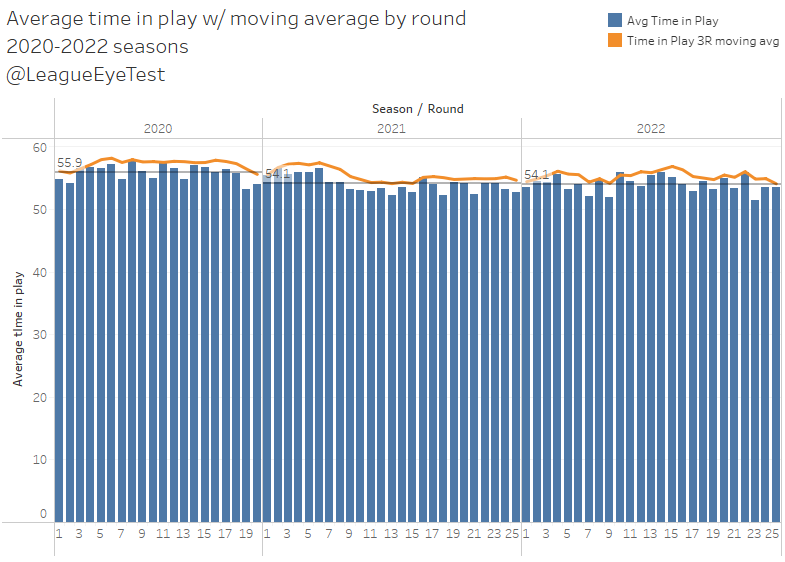
Having peaked at 55.9 minutes in 2020, time in play actually decreased in 2021 to 54.13 minutes since you can’t have the ball in play if lining up a conversion. 2022 continued this decline but only slightly as we move to 54.05 minutes with the ball in play, although the wonders of rounding to a single decimal place doesn’t show this.
Given the rule changes it was might be surprising to see that it didn’t decrease by more than 0.1 minute per game, however with the drop in points scored (see below) it would have been even further if a similar number of tries were scored. Scoring points and having the ball in play are mutually exclusive, no matter what the games administrators try to tell you.
The number of set restarts did drop substantially this year, down to 3.8 from 7.1 per game in 2021.
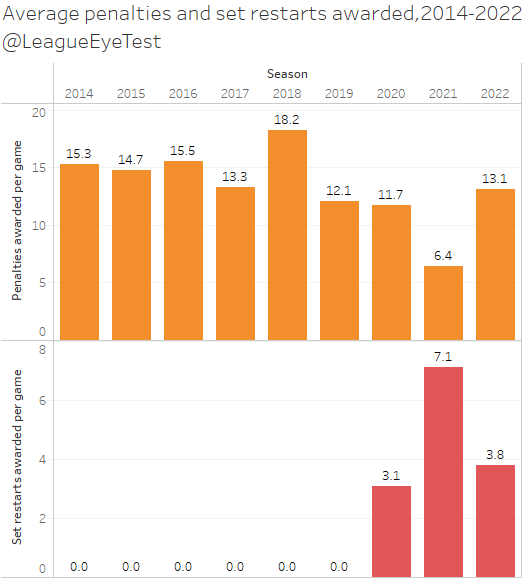
Points per game dropped as well, going form 46.2 scored per contest in 2021 to 43.3 in 2022. That’s still the second highest mark since 2014, and each of the last three seasons have had more than 42 points scored per game. So you could say that it has increased scored.
But it’s artificial.
As you know, here at the Eye Test we don’t always take raw volume statistics at face value. With that in mind, let’s look at some possession adjusted numbers for scoring points.
Below is the number of points per play the ball from the last nine seasons.
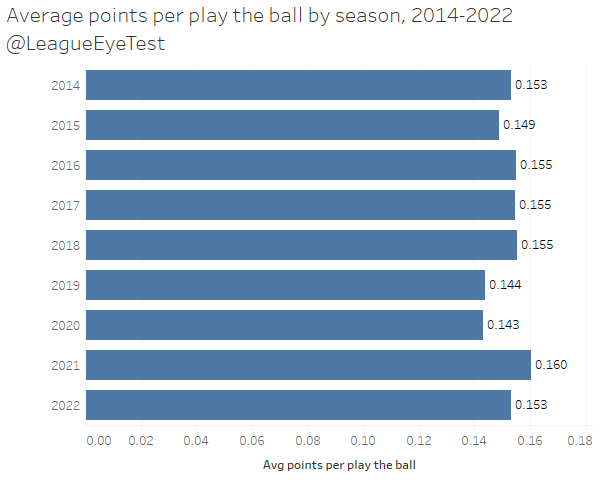
The rate of scoring per play the ball was the highest in 2021 at 0.160 points per play the ball. It isn’t dramatically higher than 2016-2018 when the rate was 0.155. 2022 was actually below those years at 0.153 points per play the ball, indicating that the rate of scoring has been wound back.
You can see the effect that set restarts have had on the amount of play the balls, and therefore number of chances to accumulate statistics, since set restarts were introduced in 2020.

2020 was the peak of play the ball increases, as coaches used the set restarts to start over their structures and just grind up the middle with basic hitups. For that season we saw 295 play the balls per game, up twenty per game from 2019.
2021 saw a drop in play the balls but when you consider the increase in scoring it’s not surprising that play the balls dipped. 2022 continued that trend ever so slightly, declining by a full set of six tackles to 282 per game.
Going back to point scoring being down and affecting time in play, you can see the affect the number of tries scored has on time in play from the below chart, plotting the average number of tries per round against a rolling average of time in play.

2022 saw 7.6 tries scored per contest, down from 8.1 per game in 2022, but up from the 7.3 in 2020. As mentioned above the drop in time in play would have been higher had the same amount of tries been scored this season.
The correlation between time in play and scoring can be seen with Round 23, 2022 with just 51.5 minutes time in play thanks to 10.3 tries being scored across the eight games that round.
Another way we can see the statistical inflation being wound back is through looking at the distribution of average run metres per season. Below is a box and whisker plot of every player that has appeared in more than 10 games in a season since 2014, broken down by seasons. The chart shows the spread and a five number summary of a set of data. The numbers are the minimum, first quartile (25%), median, third quartile (75%) and maximum. The outside of the boxes represent the first and third quartiles, the middle of the box is the median and the “whiskers” at the ends are the extremes of each sample of data.
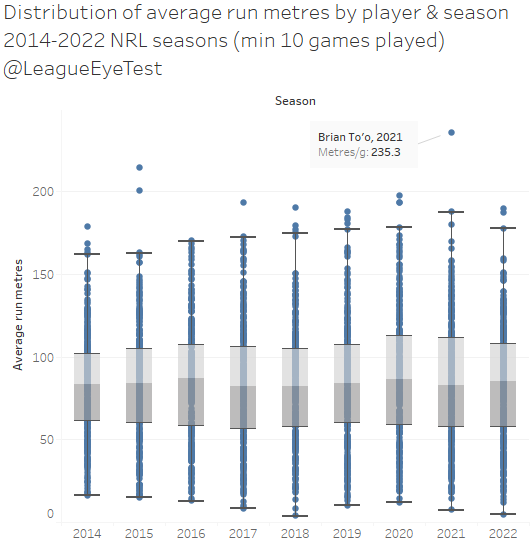
The 2021 season had the highest maximum out of any of these seasons at 187.7 metres per game, no other season was higher than 178 metres per game. And it also had the largest outlier of the past nine seasons with Brian To’o’s 235.3 metres per game.
2022 returned to something more normal with a maximum of 177.5 metres per game and only a few outliers just above that.
It’s a similar story for metres per run as well. Here’s the same chart for that metric instead of average total run metres.
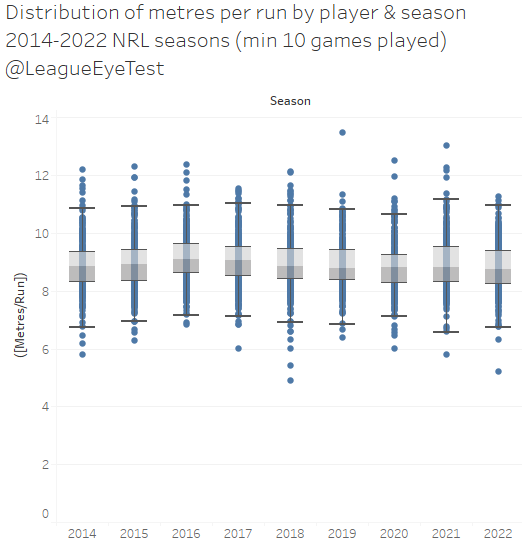
Again, 2021 had the highest maximum (11.16 metres per run) with a number of significant outliers at the top. Once more we see 2022 reverting to the mean with a maximum near other seasons (10.98 metres/run) and the fewest outliers during this span.
The last measure I’m going to use today is by comparing seasons form my own Eye Test Player Contribution Rating (ETPCR) metric. Below is the top 20 players since 2014. Prior to set restarts being introduced, the previous high was +2.537 also from Tedesco in 2019.
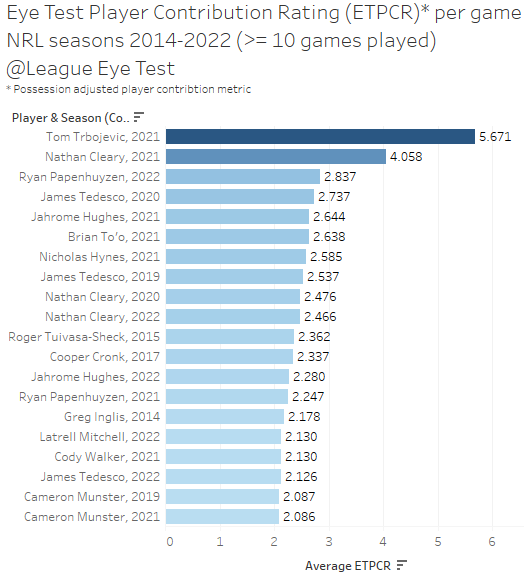
Eight players from the overall top 20 during the previous nine seasons come from 2021, and five of the top seven seasons. Both Tom Trbojevic and Nathan Cleary achieved preposterous ETPCR numbers in 2021, with Trbojevic doubling the former top number from 2020 which was James Tedesco at +2.737.
Besides Ryan Papenhuyzen taking third place overall with +2.837, Cleary was the only other player from 2022 to crack the top 10, and whilst there were five total players from this season in the top 20, the other three ranked 13th, 16th and 18th. Cleary returned to earth this season, with his ETPCR dropping back to 2020 levels at +2.466, whilst Trbojevic’s season was curtailed by injuries, and he missed out on the top 20 by a wide margin.
There’s plenty more ways to show how rugby league healed in 2022, but hopefully this has shown that the game seems to be headed in the right direction. On the field at least. Fingers crossed for a rule change free off-season and more progress in 2023.
If you enjoyed this post please consider supporting The Rugby League Eye Test through a donation via one of the links below.
Scan the QR code or copy the address below into your wallet to send some Bitcoin to support the site Scan the QR code or copy the address below into your wallet to send some Ethereum to support the site Scan the QR code or copy the address below into your wallet to send some Litecoin to support the site Scan the QR code or copy the address below into your wallet to send some Bitcoin cash to support the site Select a wallet to accept donation in ETH BNB BUSD etc.. Donate To Address
 Donate Via Wallets Bitcoin
 Ethereum
 Litecoin
 Bitcoin cash
Support The Rugby League Eye Test
Support The Rugby League Eye Test
Support The Rugby League Eye Test
Support The Rugby League Eye Test
Donate Via Wallets