Every season there are always questions around whether NRL players are actually “earning” their salaries, especially those on “reported” big money deals.
It’s low hanging fruit. Find a player who’s (allegedly) being paid big money having a bad run of form, find some talking heads from another era to question their performance and you’ve got yourself an easy story.
The answer isn’t always that simple. Players have good runs of form, coaches move players into different positions, change the amount of ball they receive, or there’s even lingering injuries that can play a part.
What if there a way we could quantify how much these players are worth based on how they perform on field? Could you convert their on field accomplishments (both good and bad) to a salary number and use that to determine if a player is being over or under paid?
Thanks for reading The Rugby League Eye Test. Subscribe below to receive new posts in your inbox
I’m going to use this post to run through a process that could be used to do such a thing. Is it perfect? No, but the results are encouraging enough that I’d be comfortable using it as a starting point for ranking players or putting them into tiers, being folded in with more qualitative data. As always, I’m not going to let perfect be the enemy of good.
Late last year, I’d already started work on a thought experiment about using the Eye Test Player Contribution Rating (ETPCR) to model how much a player is worth in dollar figures purely on their statistics alone. The announced salary cap increases had expedited my work but I’ve sat on it for a while waiting for a final cap number to be announced and agreed upon. And by agreed upon I mean actually agreed upon, not just what Peter V’Landys decrees. With there no sign of that coming anytime soon I’ve decided to post this anyway.
Therefore, the first of many assumptions in this piece will assume the proposed NRL salary cap of $11.45 million for the top 30 players will be final and the number that teams will be playing under for 2023. Which could all change by tomorrow morning, but for now let’s play devils advocate and go with it.
Before I even get into any more of the details, I’d like to explicitly emphasise here the following points to save some basic questions:
- These calculated salaries represent what a player is worth on statistical contributions alone
- I treat these numbers as a guide not gospel
- Age, ability, potential, intangibles, and fit (among many other things) play an equally important part
- I do not have any idea what these players are actually paid
However, whatever these numbers are, I will state that every single NRL and NRLW player is underpaid given the value the game creates. There’s nothing extra I could add to this discourse that hasn’t already been said better elsewhere. They deserve every dollar they are asking for and I’m extremely proud that they’re refusing to negotiate on an item like pregnancy and paternity policy. Some things are bigger than football.
No one is paying to see anyone from NRL head office or the media. The vast majority of the money should be going to the players. In fact I’d pay more to not hear or see from them. Maybe we can get a Milford School (not that one Wilfred) for NRL administrators & media up and running? But I digress.
I’ll re-post these caveats at the end of the article as well just in case anyone skips over them. Let’s move on to how this all works and what it might mean.
As to how this will come together, I’ve used a similar approach to The Athletic’s John Hollinger for his NBA free agent value articles. Hollinger looked at the number of minutes played by all players in the league above replacement level and developed a model that would project a players forthcoming salary based on their prior production above that replacement level.
As he stated in the above article, we’re not just valuing their performance for 2022, we’re looking at what they may be worth in 2023. Given the significant (proposed) increase in salary cap for 2023, this thought experiment is even more timely, although at the time of writing the players may not even take to the field this season.
How it all works
The first step is determining what replacement level is. I’ll save you the long and boring work behind it, but from looking at my historical data for ETPCR I’ve come to the following numbers for replacement level by player. Given that the average ETPCR for an NRL player is 0.0, even players in the 0.0 to -1.0 range are generally above replacement level.
And just what is replacement level? Generally, it is the level of production that could be achieved from a minimum salary player, theoretically picking someone out of either state cup competition to fill a spot. For this exercise, I’ve set the following replacement player levels by position:
Wing: -0.8
Centre: -0.9
5/8 & Halfback: -0.8
Fullback: -0.7
Hooker: -0.85
Prop & Second Row: -1.0
Lock: -1.1
Once we’ve set the replacement level, the next step is bringing getting a three year sample of ETPCR for every NRL player. From there we weight their statistics so that 2022 was worth twice as much as 2021 and three times as much as 2020. Doing this reduces the impact of the cooked 2021 stats and places more emphasis recent performances since we’re looking forward, rather than letting data from three seasons ago weigh as heavy as last year.
Now we can combine these and determine how many minutes were played at above replacement level. Since we know what the salary cap is for the top 30 players, we can then divide the total salary cap of 17 teams by the total number of minutes available above replacement level play league wide which gives us the rough dollar number to use to calculate our player salaries. It ends up being roughly $280 per minute of above replacement level production.
Regression to the mean
For all players for anyone who played fewer than 50% of games in a season (10 in 2020, 12 in 2021 or 2022) we’ve added in replacement level production to hit that threshold. Sean Russell played one game in 2022 for an ETPCR of +6.1, and would have been unlikely to continue that form for a whole season. Instead, we give him replacement level ETPCR data for games he “would” have played to produce a more realistic data point for his season.
For those players who were more than +1 ETPCR above replacement level, instead of giving replacement level minutes, we instead subtract 1.0 from their ETPCR rather than giving them replacement level minutes. This is to ensure players like Tom Trbojevic aren’t treated unfairly with this regression to the mean, given that even a hobbled Trbojevic would outproduce a replacement level player.
Projecting 2023 performance
The next step is to capture the age of every NRL player as of the start of the 2023 season, and then project an increase or decrease to their prior ETPCR data.
Age progression is on an curve by position, with some positions age more gracefully than others. As noted previously on the site, rugby league players generally tend to peak statistically around 26-27 with a few exceptions. Positions like halfback and to a lesser extent five eight continue to improve past their physical peak in the mid 20s as their ability to read games and rugby league IQ continues to improve even if their bodies start letting them down.
This means for a player like Adam Reynolds, we’d be projecting a decrease in his numbers from 2022 as he would be turning 33 by mid season. For someone like Dylan Brown, who will be turning 23 this season, we’d be projecting a continued increase in production.
One thing I haven’t done in this iteration is account for games played. Everyone on this list is assumed to be playing 24 games per season. The main reason for this to get an apples for apples comparison of what each player is worth assuming they lined up for every match.
If you’re enjoying the posts on this site and want to support independent rugby league content, please consider donating to The Rugby League Eye Test of a value of your choosing via the link below.
That’s probably overs, given that less than 60 players in this data set played more than 22 games in the prior season. And for players like Papenhuyzen and Trbojevic, who’ve suffered some devastating injuries in the past two seasons, it’s something that does need to be considered at some point. For now though we’re living in a fantasy world where everyone plays the same number of games.
I am projecting minutes played per season, which for the vast majority of back-line players makes a trivial difference as most average between 77-80 minutes per game. An extra minute here or there doesn’t change things drastically. There will be some differences for forwards who are playing a new rotation or have moved clubs, but for the sake of simplicity we’re just using the average of their past three seasons weighted heavier for more recent seasons, as we did for ETPCR.
The end result
Now we’ve put together our data, added in regression to the mean, adjusted for aging and projected minutes played, we can multiply this by the dollar per minute of above replacement level play and we’ve got a projected salary for 2023. The top 30 players are below.
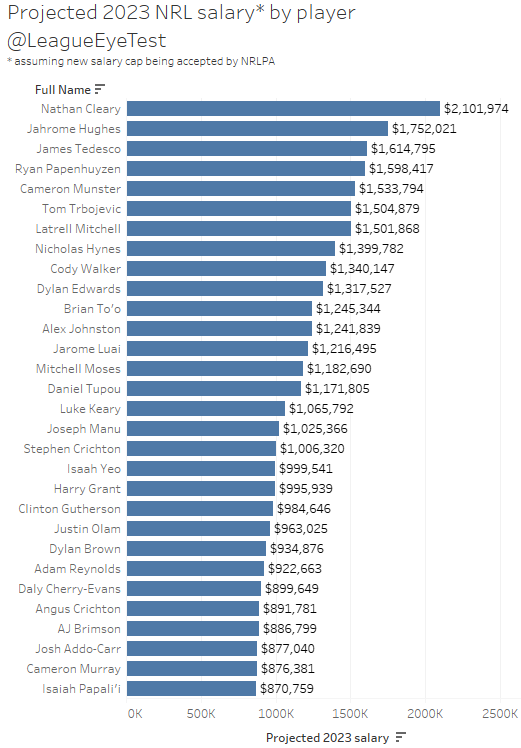
There are very few surprises in this list. Under the old salary cap, there would have been 13 players worth $1million+, although two of them have huge asterisks next to their names due to durability. With the intended salary cap increase this season, that number creeps up to with 18 players projected as being worth $1million or more, with two others that could be rounded up to that number.
At the top end, I don’t think anyone would argue that Cleary, Tedesco, Hughes and Munster aren’t worth what is listed here. There might be some pushback on Mitchell because he doesn’t fit the “modern” fullback role, but if you asked him to play like Dylan Edwards, you’d rob him of what makes him special. In my eyes he’s easily worth that dollar figure for the way he can impact games in an instant with very few touches.
As noted above, when fully fit both Papenhuyzen and Trbojevic fit the bill as $1.5million+ players ($1million+ under the old salary cap), but questions about their physical resilience will always surround them.
A player like Alex Johnston is probably over-valued by this method, as the statistic that correlates highly with winning and a higher margin of victory is (unsurprisingly) scoring tries. Which means he’s going to rank highly, but as mentioned before this is more the start of a process rather than the definitive final word. Is he worth as much as Brian To’o? Probably not, but is he one of the best wingers in the competition? Absolutely.
You’ll notice there’s very few forwards on this list, and with ETPCR not accounting for number of tackles made that’s understandable. After all, making more tackles has a negative correlation with winning and final margin, which is why it’s not included. It results in middle forwards and hookers being somewhat undervalued compared to other positions, but within their own position you can get a better idea of the scarcity of elite players.
The forwards that do make this list are the elite ones though. Harry Grant is the only hooker in this list, and he sits almost $200k ahead of second place Damian Cook (37th overall).
There’s only two second rowers, Angus Crichton and Isaiah Papali’I who come in at 26th and 27th respectively. If we didn’t take age progression into account, both Felise Kaufusi and Kenny Bromwich would have easily been the top back rowers, but with both now past 30 their production would be set to decline and they’re no longer going to enjoy the benefits of playing in an ETPCR boosting Storm outfit.
For forwards, Isaah Yeo was one of the best forwards in the game last season and sits 19th at a Ryan Matterson fine below the magic million mark, the highest paid forward in this list. The only other middle in this list is Cameron Murray, placing 30th at $891,000. James Fisher-Harris, who has the highest projected salary of a front row forward ranks 49th at $745,000.
Distribution of salaries
Let’s look at a histogram of salaries grouped by $200,000 bins up to $2million to see how they’re distributed.
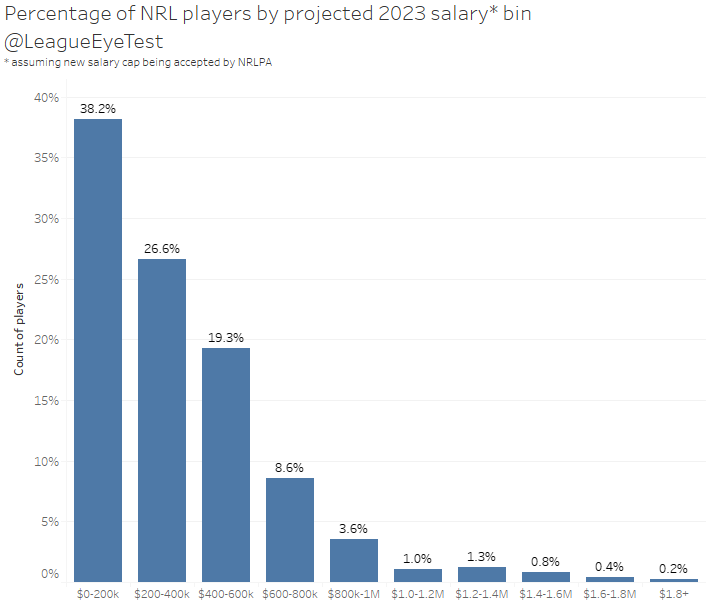
Just under 40% of players sit in the sub $200k bucket, with more than half of that bin made up of minimum salary players. About 25% of total players end up projected with a minimum salary for 2023. With the inclusion of a new team and an extra 30 full time first graders running around, many of whom have no prior first grade statistics available, that isn’t a surprise.
Only 76 players project as being worth more than $600k per season under this method. Which means that if you’re going pay that price for a player, you’d want to be securing a player in the top 10-15% of the league. Over paying for average players or in positions with relatively low scarcity is a sure fire way to ruin your salary cap.
For a visualisation of that, here’s a box and whiskers chart by position to see where the salary outliers are, with the main ones at key positions noted.
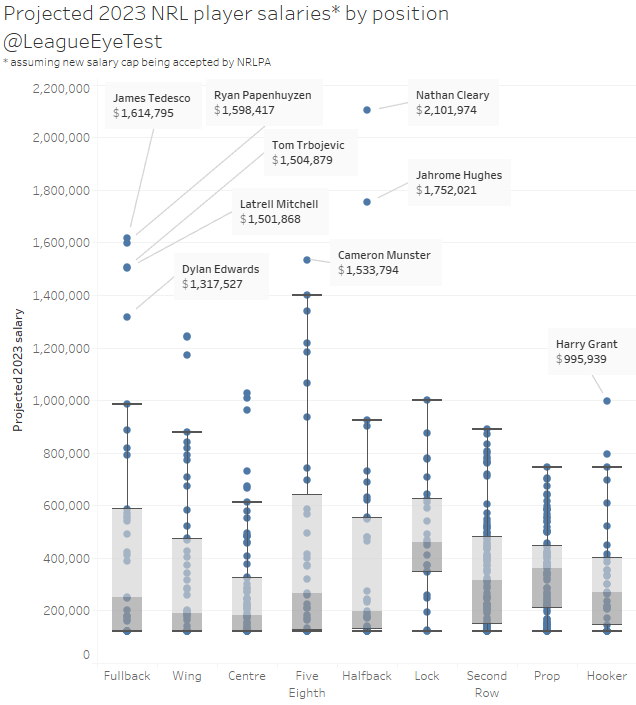
There are outliers at wing (To’o, Johnston and Daniel Tupou) and centre (Joseph Manu, Stephen Crichton, and Justin Olam) as well which aren’t noted as I don’t want to make a complicated chart even more busy.
The takeaway from this chart is that the shorter the gap between the whiskers (outer ends of each box, hence box and whiskers), the smaller the difference in production (and therefore salary) of the players within than position. You’re probably better off overpaying for a half or fullback, considering the few extreme outliers that exist, and seeking value in other positions like prop forward and centre, where the margin between the top 25% and the bottom 25% is far smaller.
For example, there are 10 second rowers who rank ahead of the first placed prop (Fisher-Harris as mentioned above at $745,000). And if you look at a box and whiskers plot of estimated salaries by each position, you’d see that there’s very few outliers at the front row position.
This would indicate to me that there’s more positional scarcity for elite back-rowers than elite middle forwards. The same goes for other positions as well like halfback and fullback. There’s no reason to overpay for elite middles, the difference between #1 and #20 isn’t as drastic as it would be for second rowers. Lock appears to have the biggest whiskers, but that’s driven by smaller player counts and some very good players (Yeo, Murray) at the top.
If you’re going to overpay for players, it’s far better to do so at key impact positions rather than support or work rate ones. Not exactly an earth shattering revelation, but we’ve got some numbers to back it up this time rather than just intuition or (the other) eye test.
Positional breakdowns
With zero commentary, below is a slideshow of the top 10 players by projected 2023 salary by position, with locks and prop forwards grouped together for a top 15. I’ll let you draw your own conclusions for now, with the only advice I’d be offering is to look at tiers of players and the gaps between .
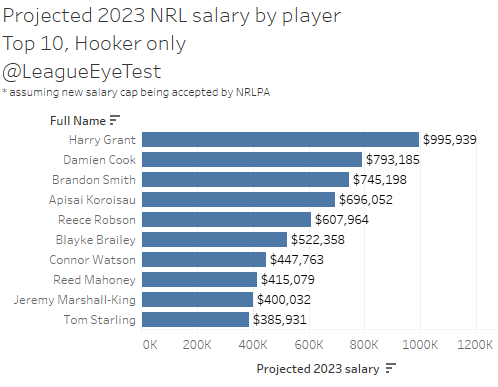
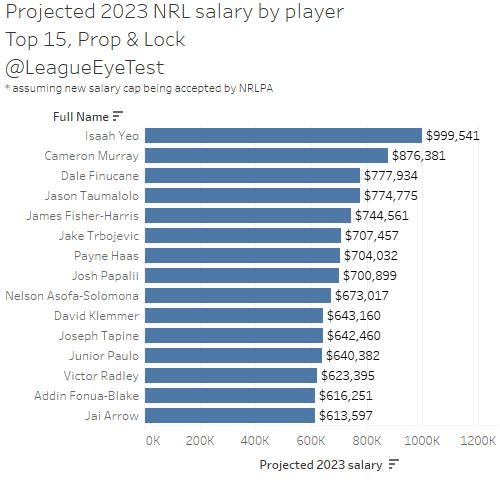
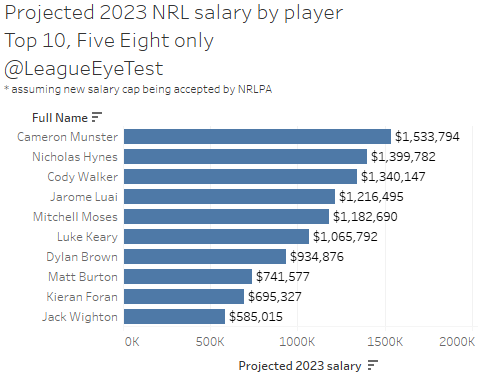
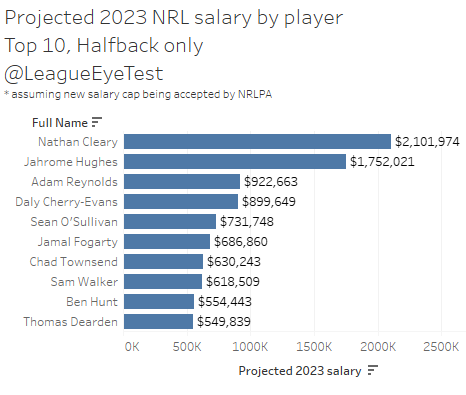
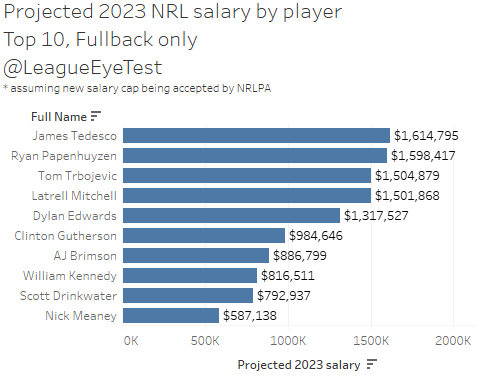
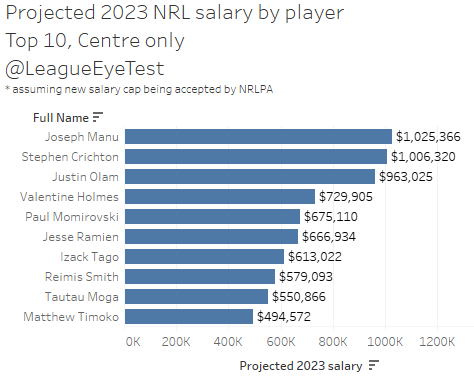
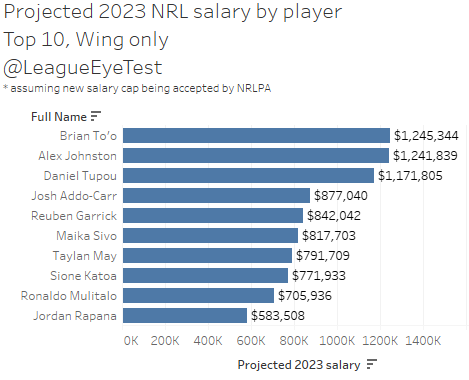
(Click on the arrows either side of the picture above to move through each position)
Drawbacks
One thing this method of estimating worth doesn’t do is measure ability, current or future. We’re looking purely at what value their level of statistical output over the prior three seasons is worth, which is going to under value players who don’t put up a lot of numbers. You could consider it an objective approach, which needs a subjective lens applied to it.
It also over punishes players on bad teams, which I had mentioned as an issue in the initial explainer for ETPCR linked here. Equally, players on good teams will tend to get a bump in their numbers. The initial assumption for ETPCR is that on good teams, all players are equally good and on bad teams, all players are equally bad, and adjustments are made from there based on how their numbers contribute to the team’s performance. Again, without context these numbers mean nothing.
A great example of this is Reece Walsh, who surprisingly grades out at a minimum salary NRL player for 2023 under this methodology. But that is due to the heavy weighting on the last season he played with the Warriors, who let in 700 points and Walsh was usually the last man in defense, trying to save the mess that was made in front of him.
Here’s Walsh’s per game percentile ranks of some key statistics for the 2021 and 2022 season which partly explain why he’s rated as a minimum salary player by this calculation. As noted in the image, the higher the number the better the percentile rank.
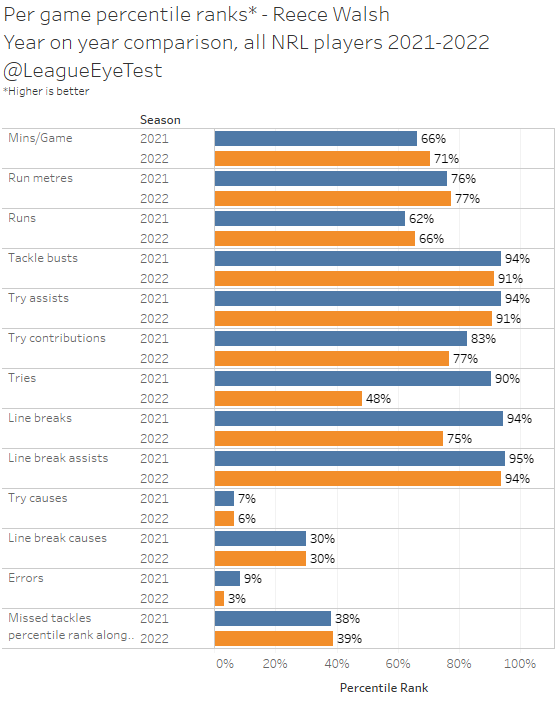
The first issue is the negative stats at the bottom – 6th percentile in try causes, and 30th percentile in line break causes. This means that 94% and 70% of all NRL players rank higher than Walsh for these statistics. Missed tackles didn’t change much either, at 39th percentile. But they haven’t changed much year on year, so the negative play isn’t solely due to that.
What is due to is an increase in errors (9th percentile to 3rd!), plus a decrease in creation and scoring stats. Walsh only scored 2 tries in 2022 compared to 9 in 2021, dropping him from the 90th percentile to just 48th percentile. His line breaks also dropped from 94% to 75%.
There’s no universe where you’d pay Reece Walsh a minimum salary given his age and tremendous talent. What we’re showing with this exercise is that a player with Walsh’s stats on an atrocious team like the Warriors of 2022 would usually be worth a minimum salary. If you look at the stats above, he’s in the 90th percentile for a lot of key statistics, but it’s the negative play that is the biggest issue in his game.
If we were to just use Walsh’s 2021 numbers when his attacking numbers were stronger, those 16 games would project him out to nearly $400k salary even before any age adjustments.
Again, the nuance of the extra weighting on the most recent season needs to be taken into account here, as well as the teams overall performance.
I know everyone will focus on the salary number, and I understand that. But the way I’d use this information is using it as a baseline to sort players into tiers for determining recruitment priorities, which then you’d bring in more qualitative information as suggested initially. Context is everything and without it these numbers are meaningless.
Applications
Now that we’ve projected these numbers, as the season advances, we can check back and see if players are hitting these numbers or missing completely.
Progression is not always linear. Someone like Stephen Crichton has increased his ETPCR each of the past three seasons, and with his 23rd birthday coming up he should continue to improve. Meanwhile his teammate in Edwards was 5th by ETPCR in 2020, 40th in 2021 and now grades out as the 10th highest projected salary in the NRL.
Like the other work I’ve introduced over the past three seasons I’d consider this somewhat of an alpha release. There’s plenty of assumptions here that could be challenged and moving forward I’d expect to be making changes where needed. It’s not the most mathematically or statistically sound method either, but as a thought experiment it seems to work and shows the value of production for most players. There’s an opportunity to use lower grade data such as NSW or Q Cup for players with insufficient games for this model, but at the moment I don’t have that data available nor the time to model it in.
Again, I will reiterate that a player having a higher salary than another does not indicate they are better than them. It just indicates that a particular player has had a better statistical output, especially in stats that correlate with winning and by higher margins, over the past three seasons. They may also be ahead due to age, with younger players projecting more favourably than those at the tail end of their careers.