At the end of the first four rounds of the NRL 2023 season, the average margin thus far this season is 9.1 points per game, or roughly half of what it was during the peak Vlandoball era of 2021 (18.3) for the same rounds. I wish that was a misprint.
Not that I’m complaining, and I’m sure fans and broadcasters aren’t either after. Close games mean more engaged viewers meaning happier broadcasters. If only there was a way for the head of the NRL to use this and extract some more compensation out of said broadcasters. But I digress.
It would be even closer if not for the Sharks towelling up the Dragons to finish the round, which was full of close results otherwise, one of which was the fantastic first match between the Broncos and Dolphins.
If you’re enjoying the posts on this site and want to support independent rugby league content, please consider donating to The Rugby League Eye Test of a value of your choosing via the link below.
And on that note, Liam of PythagoNRL fame has returned with the Maroon Observer, which is focusing on (unsurprisingly) rugby league in Queensland. I’d highly encourage subscribing to his Substack.
Back to the close games, here’s an update of my garbage time minutes statistic (number of minutes played with a margin of 18+/ more than three converted tries) for the first four rounds of a season since 2016, and it’s looking good.
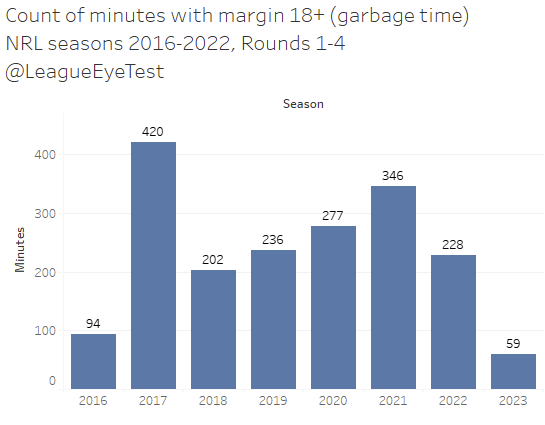
There’s been just 59 minutes of “garbage time” this season, down from 228 in 2022 and 346 in 2021. And 21 of those minutes came towards the end of the above mentioned Dragons v Sharks game. Before that it would have been under 40 minutes for the season. The 59 minutes equates to 15 just under minutes per round of garbage time, that number was 87 in 2021.
So why are we seeing such close games this season? Has something changed this year? There are a few theories floating around that I thought I’d look at.
Interchange depth
One is such as a 17th team thinning out rosters and resulting in less experienced interchange benches. Which if we look back at the age analysis I did two weeks ago is exactly what is happening, with the average age of an interchange player dropping since last season. With the stricter rules around head injuries, interchange benches are being used more and it’s forcing younger and less experienced players to endure longer stints.
Teams are using their interchange players less, with the average bench player seeing 31.5 minutes on field, down from 32.7 last year. Not a huge change but interesting considering the number of head injuries and serious injuries we have seen.
Thanks for reading The Rugby League Eye Test. Subscribe below to receive new posts in your inbox
Starting front rowers are playing over four minutes a game more during the first four rounds of the season (I see you Brad Arthur), which looks to be the only major change in minutes played that isn’t solely injury affected.
I don’t put a lot of weight into this one making a big difference, but it probably plays a part. Let’s move on and look at something else.
Total points are the same but margins are down
The average points scored in a game thus far in 2023 is almost the same as 2021, which is outrageous when you consider the average margin is half of what it was then. Here’s your proof, showing the average number of points per match in the past eight seasons.
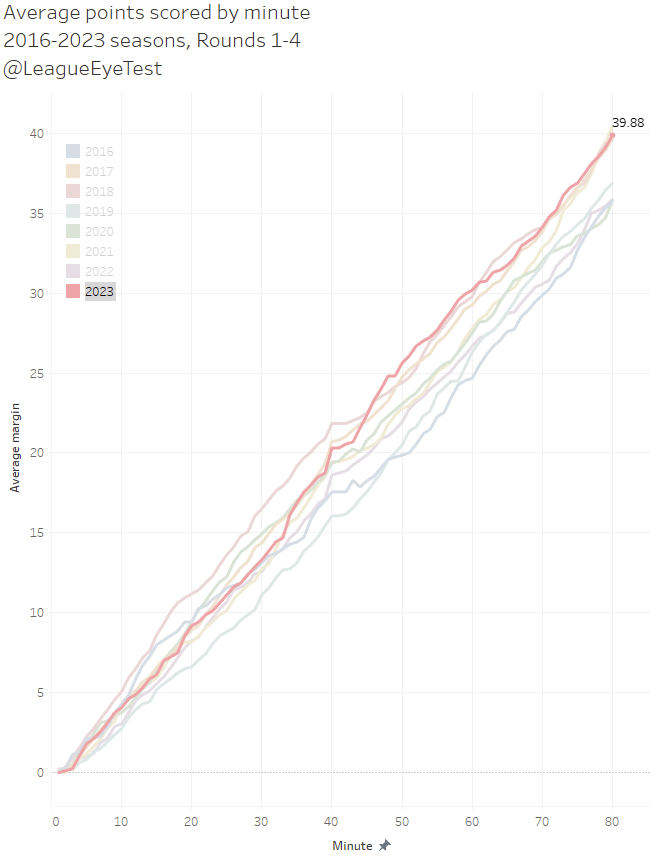
The line shows there’s less overall scoring in the first half of games this season, but more early in the second half. Part of that is due to a 52.3 average per game in Round 3, with the other three rounds sitting below 40 total points scored per contest.
Overall scoring is similar to 2021, but with fewer line breaks, indicating that tries are being scored more often from kicks where a line break isn’t recorded.
Despite similar point totals, there have been four tries fewer scored in 2023 than in 2021, yet there were 36 fewer line breaks two seasons ago than now. There were also more line breaks in the first four rounds of 2022 where 16 fewer tries than 2023 were scored.
What it also means is that despite the losing team kicking off (remember when people wanted that changed?), there hasn’t been continuous building of possession by one side after scoring points.
And why aren’t teams able to build possession?
Fewer penalties, more set restarts
It’s still not reaching 2021 proportions, but the number of penalties are down by 9% whilst the number of set restarts are up 25% year on year.
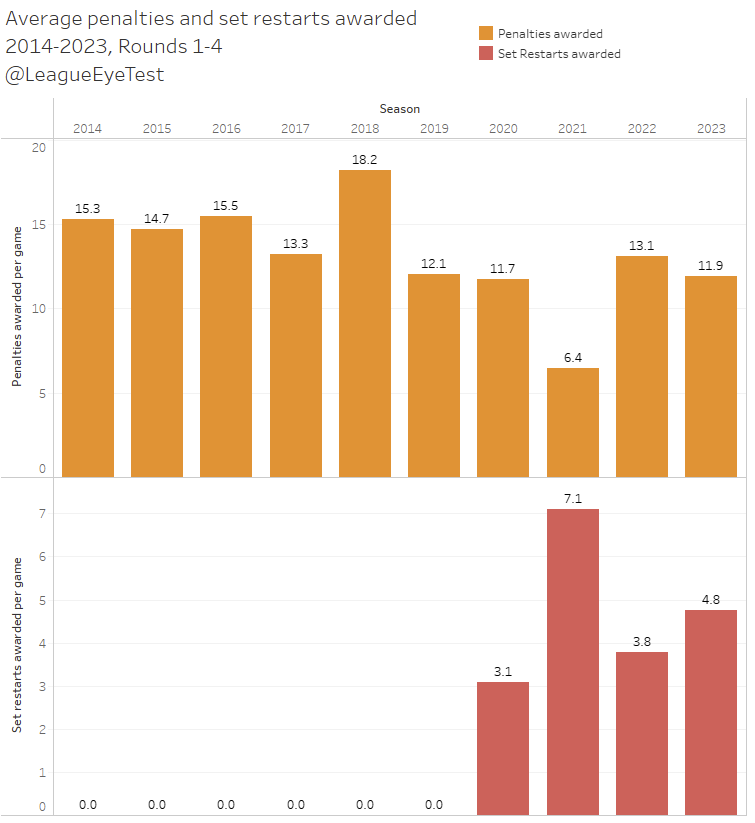
As we discovered previously, a set restart doesn’t penalise the infringing side sufficiently. Fewer penalties teams aren’t getting as many chances to advance the ball downfield from a free 20-30 kick for touch.
So whilst penalties are down, set restarts are still at a level where they’re providing continual possession that would eventually break one team down.
Teams are making more metres, but not substantially longer runs
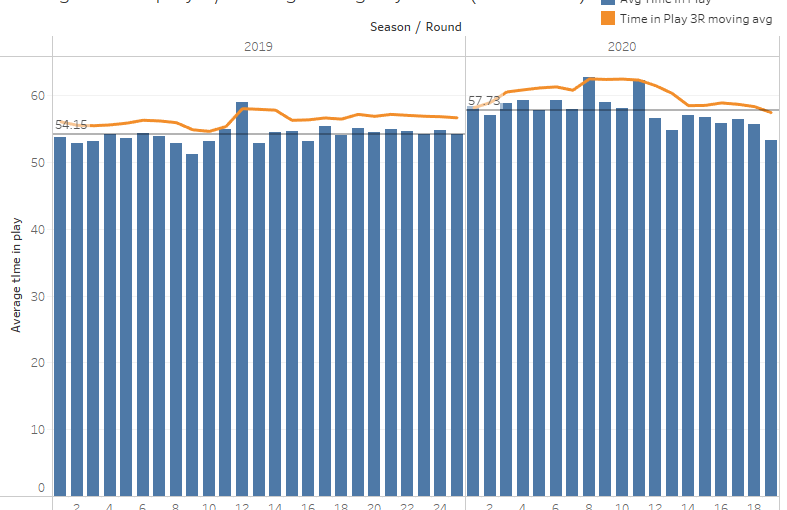
There’s been more time in play in the 2023 season so far, with an extra 300 play the balls over the corresponding rounds from last year, which means more runs and more counting stats to fill up buckets.
And despite that increase in play the balls, errors are basically flat on last season. Fewer offloads and fewer passes, more one pass hit up runs.
We are seeing slightly longer runs. The average run length in a game in 2023 is 8.67 metres, up slightly on 2022 (8.55) but down on 2021 (8.80) and a peak of 9.0 metres per run in 2016.
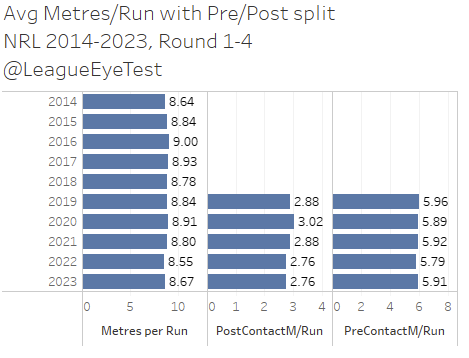
The interesting part of this is that post contact metres haven’t really changed (2.758 v 2.761) but teams are now making 5.91 metres pre contact opposed to 5.79 last year. A lot of work is done defensively at limiting movement after contact so it’s not a surprise to see that number stagnate.
What this possibly means is that teams are getting to the defensive line quicker, but they’re less likely to bend it with a strong run. And if you’re making the same metres post contact, you’re probably getting as far downfield as you’d like resulting in more long kicks to finish sets.
There’s another likely reason for pre contact metres increasing, which leads me to…
More and longer kicks
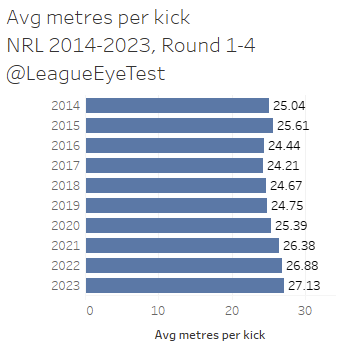
Teams are making more metres than ever from their end of set kick options and as a result team are starting with the ball even closer to their own line. There’s also been an extra 70 long kicks this year compared to the same point last year, with each kick now averaging 27.1 metres, the highest since 2014 which was helped slightly by Mitchell Moses kicking for more than 1000m on Thursday.
And with more long kicks comes more kick returns and kick return metres. There’s been 40 more kick returns after round rounds in 2023 compared to last season, for an extra 660 metres. This results in the average kick return increasing my nearly half a metre, from 9.4 to 9.9 per return this year. So if you’re wondering where the extra pre contact metres are coming from, this is probably part of it.
These numbers made me wonder if teams were starting from the same position on field as they were previously. Now I don’t have 2022 data, but for every year from 2016-2021 and the 2023 season.
In 2021 the average first tackle started 35.1 metres from a their own try line, down from a peak of 38.5 in 2018. From what I’ve seen so far in 2023 it’s slightly over 36 metres, and whilst I can’t compare to 2022 since I don’t have the data, that would be the second lowest starting point since 2016. The highest I have is 2018 where the average first tackle started 38.5 metres out.
And if teams are starting closer to their own line, and not making substantially more metres per run then that might lead to…
Fewer play the balls inside 20m
Which leads us to the real the real reason for the close games. Field position.
We established last week with the return of expected points that the number of play the balls inside 20 metres has a strong correlation with the amount of points an average team could be projected to score given the same possession.
We also established that it doesn’t always work out that way, and there’s little to no correlation with the number of play the balls inside 20 metres with points actually produced (The Dean Pay Theory). Sundays Dragons/Sharks match proved that, as St George Illawarra led the tackled inside 20 metre stat 28-27 despite being carved up 40-8.
That doesn’t mean you shouldn’t be chasing high quality possession, and generally being closer to the line for longer periods of time gives you a better probability of scoring.
Which is why you still want to be as close to your opponent’s try line as often as possible. But it’s not happening that often. Let’s take a look at the expected points from Parramatta v Penrith on Thursday evening.
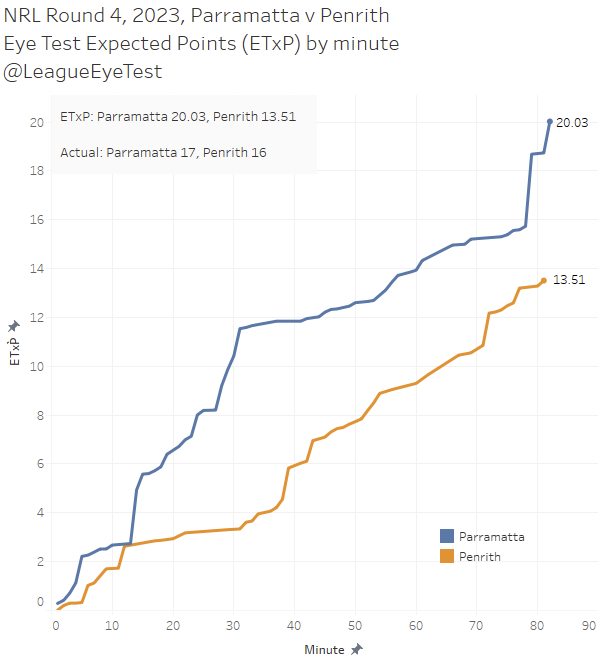
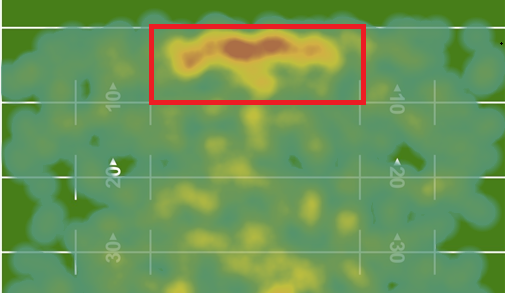
Penrith, the kings of sustained field position in the last three seasons, managed just 12 play the balls inside Parramatta’s 20 metre area, the lowest of any team in round 4. And you can see this in their expected point line where there are very few steep jumps, which indicate sustained possession close to the line.
Looking into the play the balls inside even further, below is the percentage of play the balls by season in three areas – inside a teams own half, inside their opponents midfield (50-20m), and inside an opponents 20m zone. And from here’s it’s clear what is happening.
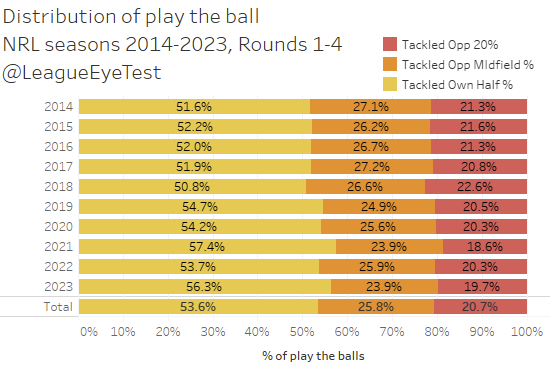
Just 19.7% of play the balls are happening inside 20 metres this season, down from 20.3% in 2022 and the second lowest since 2014. The only season lower than that was 2021, which as we’ve documented many times is a huge outlier. Sides with the leads continued to pile on points, which means more kick offs, which means more play the balls for trailing sides coming out of their own half. And they could pin them down inside their own area by giving away a set restart.
This can be seen with the percentage of play the balls in a team’s own half sitting at 57.4% in 2021, and over 56% this season. Again if you’re playing out of your own half, you’re not likely to be scoring points.
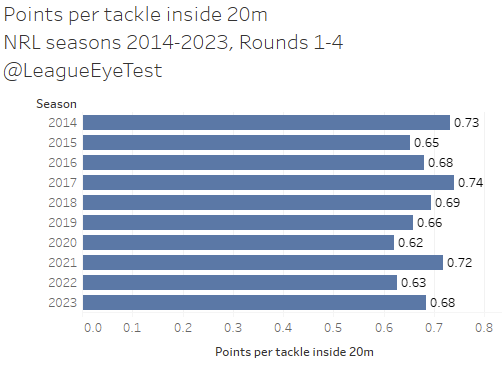
What we are seeing is that when teams do get inside 20 metres, they’re being more efficient with the ball. 2022 was one of the lowest seasons for points per tackle inside 20 metres at 0.63, and it’s moved up to 0.68 this year.
As noted above there’s a theoretical but not actual correlation between possession close to the line, but you’re still far more likely to score if you are further down the field.
All of this paints an interesting but somewhat expected picture as to why we’re seeing closer games. At a high level it’s because teams aren’t in scoring positions as often, which isn’t a revolutionary finding.
The reason for it is pretty straight forward – post contact metres aren’t increasing as defenses improve, which results in more long kicks to end sets and no build up of possession. There’s not a substantial increase in metres per runs, and combining that with a drop in penalties and an increase in set restarts it’s harder to consistently get far enough downfield to be in a position to score points.
When teams do get into scoring opportunities they are able to put up points, but the challenges outlined above make it harder for them to put on consecutive scores.
All of this means we’re not seeing the one sided dominance that we saw two seasons ago, and that’s a great thing for all involved, an probably the only thing that everyone in the game can agree on.