The month of April has closed and after nine rounds of the 2023 NRL season every team is at least one third of the way through their campaign.
That makes it a good time to update every team’s progress by expected points to see which of them are over or under performing. We did this a month ago, but with only 4-5 games played the sample size was small enough that a lucky win or loss had too much influence.
As we did last time, we’re going to compare each team’s on field performance with what they would have been expected to score and concede based on the field position and possession that they and their opponents have.
We’re doing this with the expected points model (ETxP) that I debuted on the site in February last year. As usually, if you’re a new Eye Test reader then I’d suggest taking some time to read the explainer on the site if you’re unsure about the expected points model I’m using.
For those time poor like myself, the quick rundown is that I’m using the probability of scoring a try from any position on the field and assigning a point “value” to starting possession from that location on a specific tackle number. Add up each of those instances and we get an expected point total for and against, which we can use to track against real life performances.
First, we’ll start by looking at actual for and against, to get an understanding of where teams are sitting from on field results.
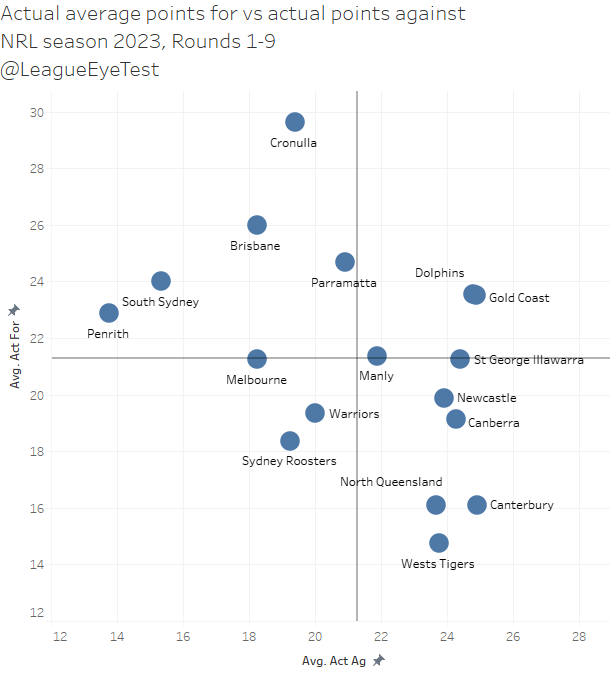
There’s nothing particularly noteworthy here, but it’s still useful to set the scene. The stronger teams this season are sitting in the top left quadrant with high points scored and low points conceded, while the bottom right quadrant shows those struggling score and defend.
Now let’s look at the same chart by expected points for and against.
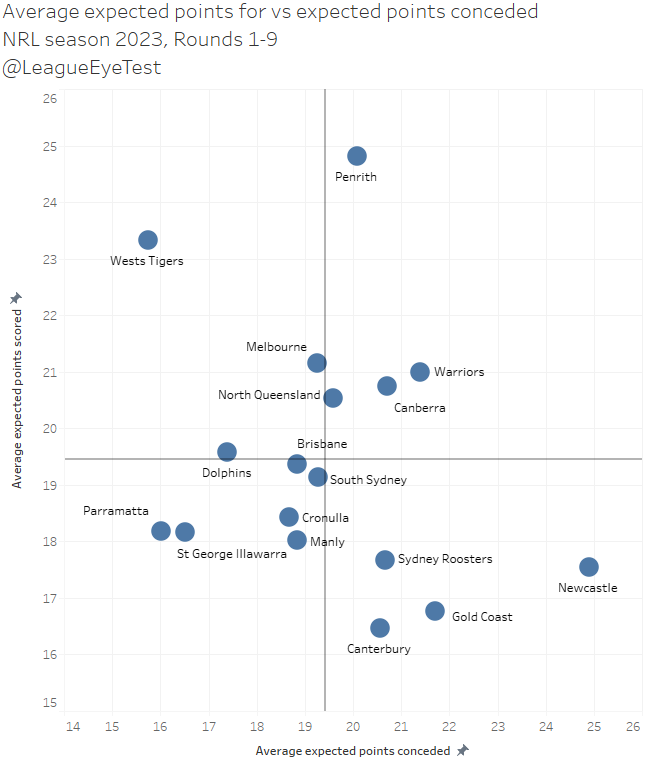
Here’s where things start to diverge. Penrith, despite sitting 4-4, have been incredibly dominant as usual with their attacking field position, with an averaged expected score of 24.8 this season. What has changed is that defensively they’re allowing more than the average expected score of 19.5 this season, at 20.1.
Under this analysis the Wests Tigers should be one of the leading sides in the competition. At 23.3 expected points per game, they would place second in the NRL for attack and their 15.7 average expected points conceded is the best in the competition.
This shows that the issue for the Tigers isn’t field position, as they are able to get in positions to score and are the best in the league at keeping opponents out of scoring areas. Obviously this means they’re not scoring when they should and allowing points from positions that don’t usually yield a try, which is highly concerning.
The Gold Coast and Canterbury have some of the worst field position in the competition, with the Dogs averaging just 16.4 expected points and the Titans not much better at 16.8. Keep that Titans number in mind for later. Newcastle has the highest overall expected points conceded in the NRL at 24.9 per game, showing that despite their progress prior to the Eels loss, their control of field position still leaves a lot to be desired.
If we break down these expected results by net actual wins over expected wins, we get an understanding the high performing teams and those failing to meet expectations that their field position and possession would suggest.
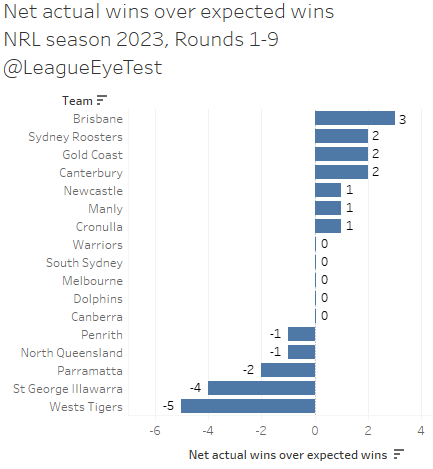
Brisbane sit +3 on net wins over expected, which might indicate they’ve been somewhat lucky this season with their results. Was their loss to South Sydney more representative? Possibly but not having Payne Haas available and missing Ezra Mam is enough to make me question the value of this result.
If you look at the course of the game by expected points the Broncos were in it until the second half when the Bunnies forwards, specifically Tom Burgess and Tevita Tatola ran rampant through the middle of the field and Brisbane couldn’t contain their field position.
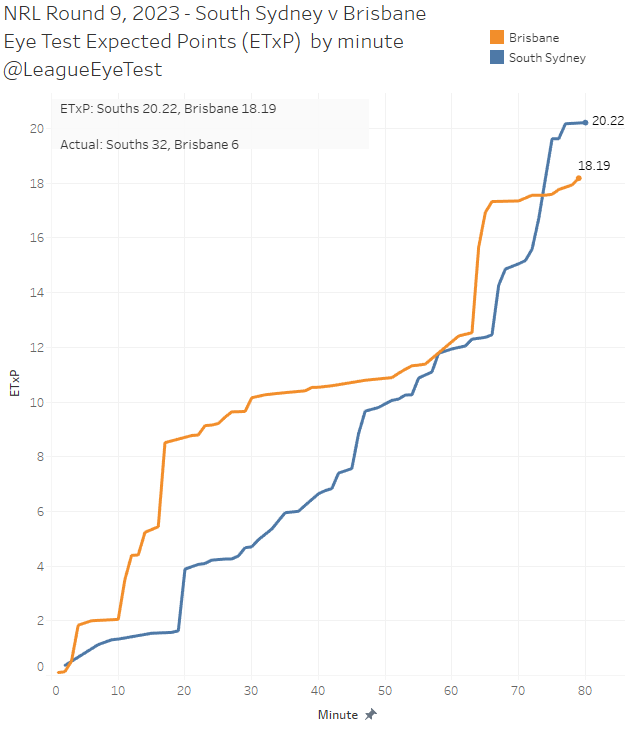
Souths were behind most of the game on expected points but you can see the volume and quality of possession they had in the second half from the above chart. The reason for the expected scores being so close is that the tackles inside 20 metres were even – 26 apiece.
This game resulted in the Broncos losing their first post contact metre battle of the season, which can be seen below. As an aside, the only drawback to a 17th team is that it ruins my lovely 4×4 trellis chart. Time to bring in 18th, 19th and 20th teams so this looks complete again.
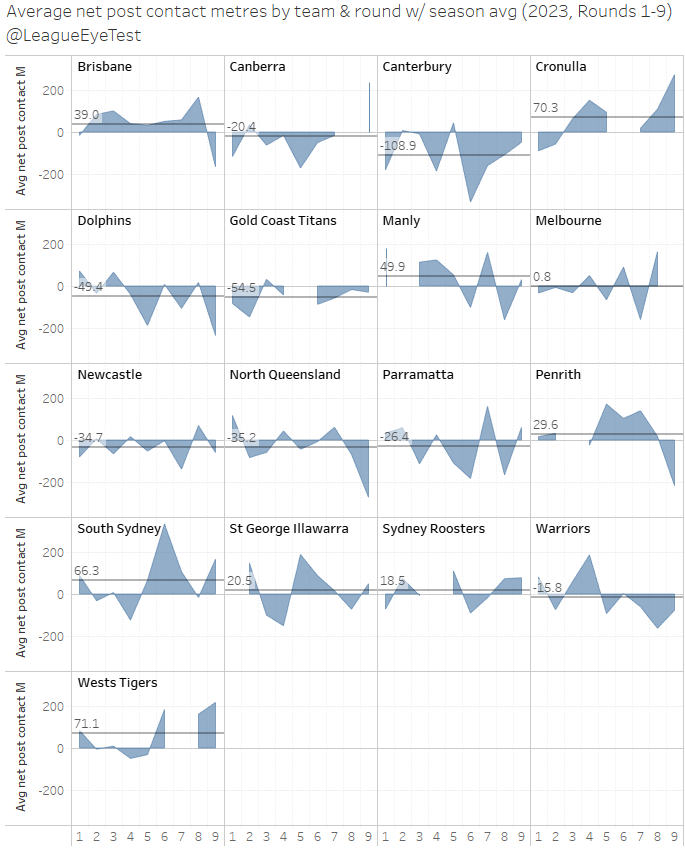
The Broncos were averaging 65 post contact metres more than their opponents prior to the Souths loss, equal first in the league with Penrith. That number has now dropped 39 per game, behind Souths and Cronulla.
Again, it’s very clear here just how much the Tigers have been under performing, at -5 net wins against expected. This has been something of a theme from the last few weeks of content on the site despite none of the posts being about the Tigers.
Their numbers this season have been mind boggling, from going over 500 minutes without leading, starting their sets further downfield than any other team, to spending the most time in an opponent’s 20 metre zone but being winless and unable to score points, the Wests Tigers have been an incredible anomaly in 2023.
The Penrith win could be something that gives them the confidence needed to meet their expected performances moving forward. That said Saturday night’s game was a perfect storm of circumstances that is unlikely to be repeated.
The Tigers were rank outsiders, the Panthers were missing important parts of their forward pack and the weather was atrocious. If Nathan Cleary didn’t think he was playing for New South Wales and hung onto the ball the Panthers probably picked up that win.
And if you had a keen eye, you would have seen above just how badly Penrith lost the post contact metre battle with the Tigers. Penrith conceded over 200 post contact metres more to the Tigers, something absolutely unheard of during their recent dominance.
The next chart looks at which teams are scoring more than expected. Here a higher number is better, indicating that you’re scoring more than an average team would be expected to.
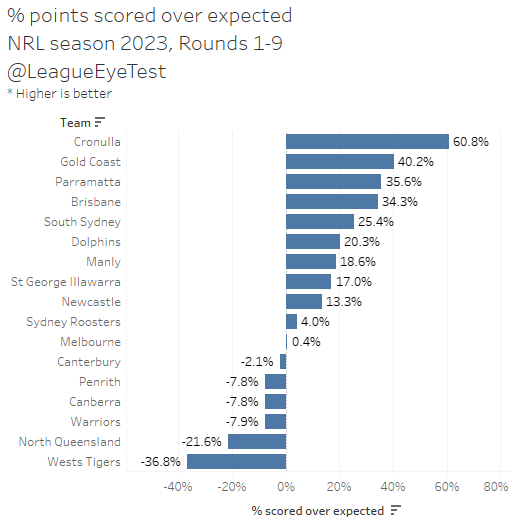
Cronulla are leading the way here, at nearly 61% more points than expected from their eight games, which is impressive as they sit 12th for expected points scored, indicating that a significant portion of their scoring is coming from long range. The question will be, just like last season, is this viable over the course of a season?
The Gold Coast are outperforming their expected scoring at 40%, but as we saw previously their field position is one of the worst in the NRL so here’s an example of percentages not telling the full tale. with Parramatta (+35.6%) and Brisbane (+34.3%) also scoring more than 30% above expected.
Again, we can see why the Tigers haven’t been able to move up the ladder, scoring at 37% below expected. All that possession is meaningless without points and the Tigers need to improve their red zone efficiency if they want to avoid the wooden spoon.
North Queensland are the only other team scoring at a rate of lower than 10% against expected at -21.6%, when you combine that with how poorly the defense has been in 2023 it’s not hard to understand why last seasons preliminary finalists aren’t competitive this season.
Now let’s look at the same chart but by points conceded over expected. Here a lower number is better, indicating that you’re conceding fewer than an average team would be expected to.
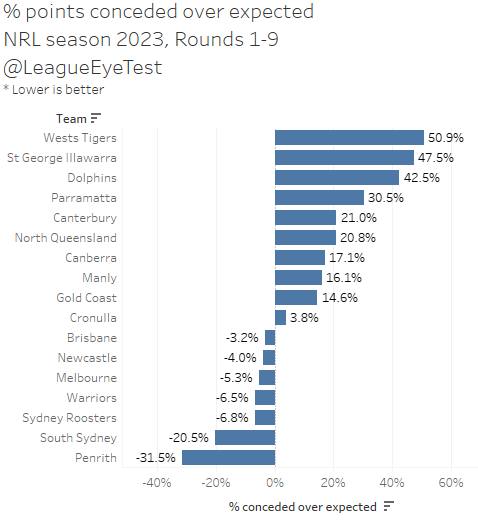
And as you’d assume, the Tigers are struggling here too. They’ve allowed 51% more points than expected in their eight games this season, which combined with 35% fewer points than an average team would score with the same possession and field position is a recipe for disaster.
The Dragons aren’t much better, conceding 48% more than expected given their opponents’ field position. It showed on the weekend too, as they were unable to put away an injury riddled Canterbury side despite a mountain of possession.
The expected points chart for that game isn’t pretty reading for Dragons fans.
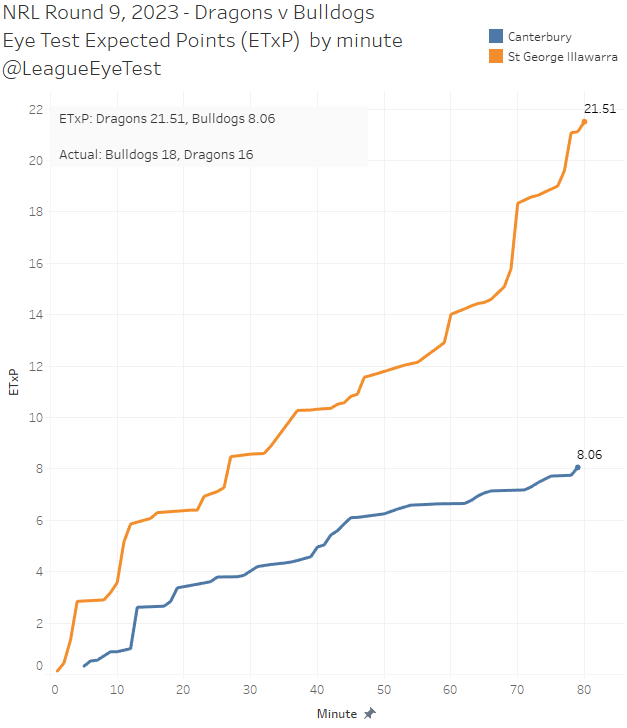
The Dragons had enough field position and possession that an average team would have won the game 21.51 to 8.06, but we know the Dragons aren’t even an average team under coach Anthony Griffin in 2023.
To highlight how these percentages against expected need the context of average field position, we’re now going to plot the actual points scored against expected points scored. This allows us to create four quadrants – dominant, efficient/lucky, inefficient/unlucky and incompetent – based on their actual and expected scores against league averages.
First up here’s actual average points scored plotted against expected average points.
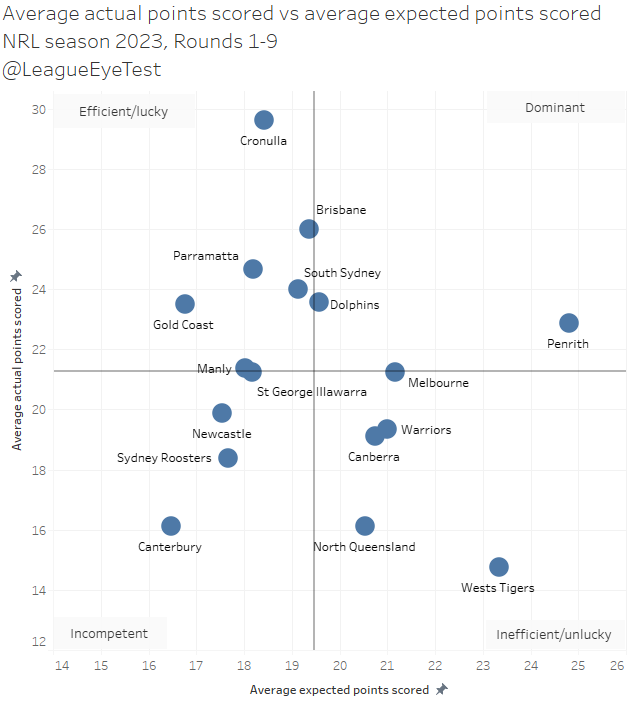
Using these quadrants there’s only one real dominant team this season, that being Penrith. A few teams are straddling the line of that quadrant, notably the Broncos, the Dolphins (!) for higher actual scores and Melbourne for higher expected scores.
Again, we can see just how efficient the Sharks are, leading the NRL in points scored from middle of the pack field position.
We can also see the issue with the Gold Coast that was mentioned previously, where they sit highly in efficiency, but that is purely because they’re scoring tries from very low quality field position.
And whilst the Bulldogs sit firmly in the incompetent quarter this season, averaging just 16 for actual and expected, it’s difficult to be too hard on them considering the slew of injuries they’ve suffered.
Finally let’s check on defensive performance against expected.
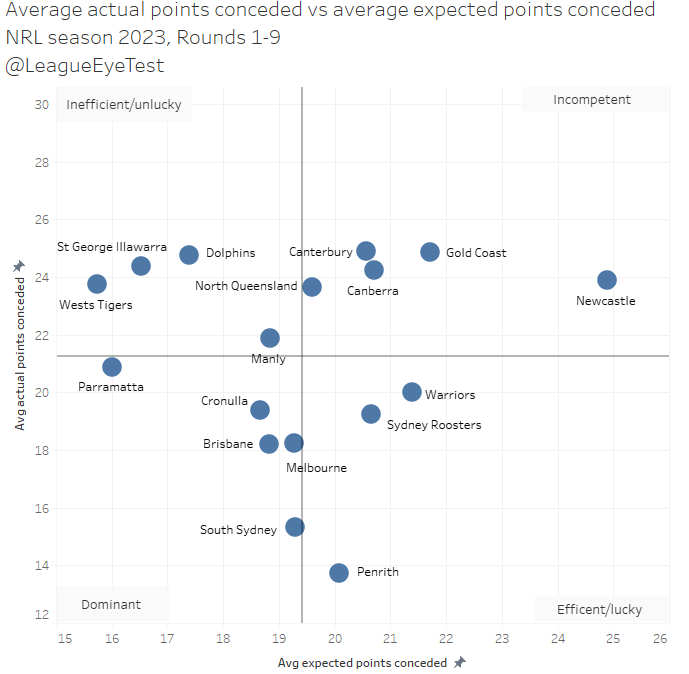
There are some differences her compared to the attacking chart. Whilst there’s a few teams sitting in the dominant quadrant, they’re all sitting on the periphery of the area. Parramatta skew more to the low expected points conceded, indicating that they’re still doing a good job this season controlling their opponents field position. We touched on this last week when looking at how the Eels haven’t had the volume of possession they usually do which has been hurting their performances.
On the other side of the quadrant, there’s four teams that are allowing similar expected scores with varying degrees of on field success. At the high end, the Sharks are allowing nearly 19.4 per game, one point more than Brisbane and Melbourne at 18.2.
The closest thing to a dominant defense this season is South Sydney. Whilst we saw earlier that Penrith were conceding 32% fewer points than expected this season, their field position isn’t great and they’re allowing more than the league average for expected points (20.1 vs 19.5). This isn’t a terrible position to be in, given that they’re still able to contain their opponents even with more favourable field position.
This is where Souths have the upper hand on the Panthers, as they’ve not only allowed the second fewest average points per game in the NRL at 15.3, they’re also slightly better at dictating field position. Their 19.3 expected points conceded per game does sit mid table, but it’s below the league average as noted in the Panthers example.
We also get a better idea of the incompetent defenses this season, with North Queensland, Canterbury, Canberra, and the Gold Coast all sitting in that quadrant. That might seem a bit harsh on the Raiders, who are 3-1 in their last 4 and are one of just two teams, and unlike the other three teams they have a positive net tackled inside 20 metres this season at +15.
The problem is that they were sitting in the negatives for that stat prior to Round 9, and only pushed into the positives on the back of having 23 more tackles inside 20 than the Dolphins on Saturday afternoon.
To tie all this together, we can look at a new addition to the last time we did this analysis with an expected points ladder. The table below shows the NRL ladder ranked by expected win/loss record, with the last column showing the variance from the actual ladder, with the number of spots difference between actual and expected ladder.
I’ve also shaded the expected for and expected against where blue is better and orange is worse to make it clearer who is performing better for each metric.
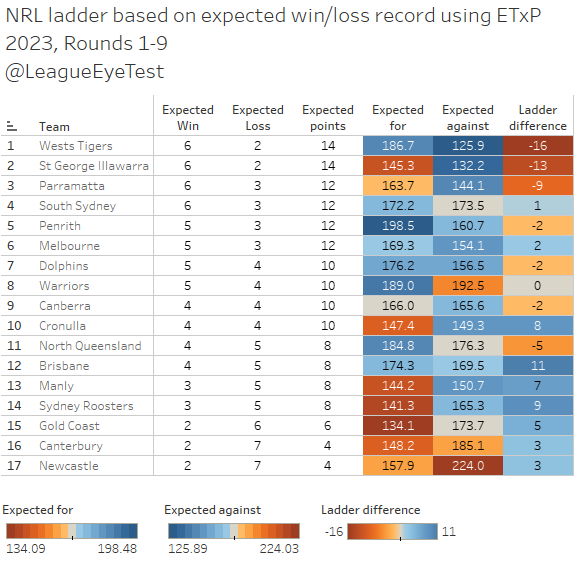
Under this model, the Tigers and Dragons have had enough field position that an average team would have won 6 games and lost two with the same possession, and they’d be sitting first and second if they had performed as well as an average team.
You might look at this and say “well Rugby League Eye Test, this is ladder rubbish because clearly the Tigers and Dragons are dumpster fires”. And you’d be partly right, both teams have been dumpster fires this season.
The key here is to remember that the expected score is what an average team would score or concede if they or their opponents had similar field position and possession. Basically, the Tigers and Dragons have had sufficient quality field position, and have held their opponents to low value field position that an average team would have won six of their eight games.
The fact that they are 17th and 15th respectively means they aren’t average teams, they’re not below average teams they’ve been terrible teams. It doesn’t make the model invalid, it means that their performances have been so bad that even an average team would be highly successful playing those games. If either team were even below average they might be sitting around 8th position. They’re not even that though, they’re poorly coached, incredibly inefficient attack and woeful in defense.
It’s not a new phenomenon for expected points either, as the Dean Pay Bulldogs of 2021 would have placed 8th by expected wins, but they were so conservative with the ball and unable to score that they ended up 16th with just three wins.
It also shows that possession and field position alone is largely meaningless without the context of what a team does with that possession. From above we saw the Tigers had the best net tackles inside 20 metres in the NRL, but they’re still last. You don’t need more play the balls to score points.
The Eels and Rabbitohs also sit with six wins, but without facing a bye also have three losses and occupy third and fourth place respectively. Souths are only one ladder position away from their actual result, whilst the Eels are nine spots ahead, indicating how slow they’ve started the season.
League leaders Brisbane place 12th on eight points, indicating they’re performing significantly better than expected results by sitting 11 spots higher. The middle of the table is sitting largely where they should be, with spots 4 through 9 only 2 positions different based on expected wins and losses.
Lastly we can see again how the Knights, Titans and Bulldogs have been struggling, all three sitting with just two expected wins. The Knights in particular have the worst expected against total in the comp and sit last on this ladder, compared with 14th overall.