Another NRL round has concluded, and yet again the Gold Coast Titans have surrendered a lead that they should have held on to. After leading 14-0 at the major break, they capitulated and threw away a lead that was defend-able, succumbing to Canterbury 20-18.
The last 12 minutes of this game were particularly diabolical for them, with the following string of penalties occurring whilst holding on to an 18-14 lead (that they would eventually surrender):
76th minute – dangerous tackle (Aaron Schoupp)
73rd minute – ball strip (David Fifita)
69th minute – dangerous tackle (Tino Fa’asuamaleaui)
68th minute – dangerous tackle (Isaac Liu)
And that doesn’t even count the dropped ball from Kruise Leeming in the 75th minute. Their expected point chart for this game shows just how much quality possession the Bulldogs had late in the game.
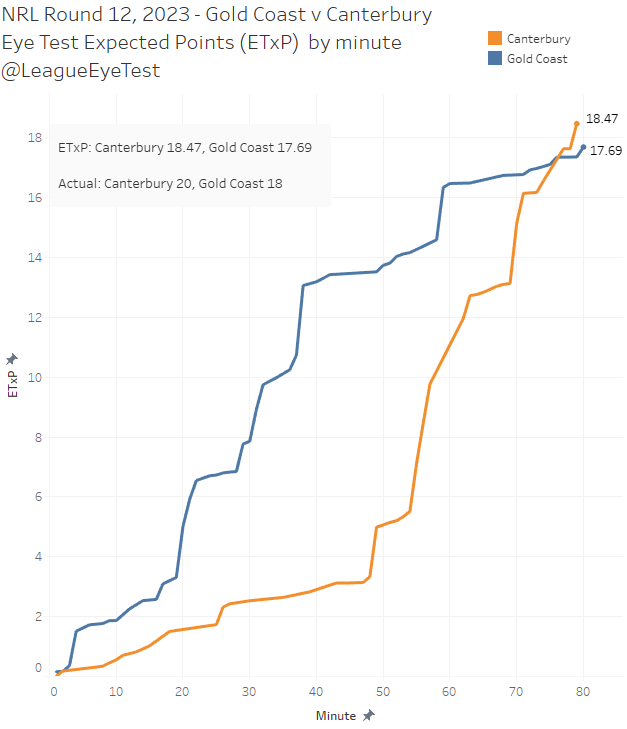
Clearly a game they shouldn’t have lost, as from the 50th minute you can see how much high point value possession the Bulldogs had. But even late in the game all the Titans had to do was hold the ball, not give away possession and they could have ground out a win.
If you were trying to throw a game (not suggesting they were), you couldn’t do a better job. Discipline is obviously an issue but not the only problem. Justin Holbrook must be thanking his lucky stars that they’re situated on the Gold Coast and not in Sydney, as a team with his record would be torn to shreds by the Sydney media.
This isn’t the first time we’ve looked at the Titans woes, the first being in July 2022 when we discovered that they don’t really do anything well. They sat mid table at best for most statistics and well in the bottom half of the competition in others.
The good news is that they’ve managed to do something very well this season (we’ll get to that shortly), but the same issues holding a lead is still a problem.
Why are they giving away these leads so easily and so often? Let’s take a look into some of the numbers to see if there’s a reason why.
Looking at average margin by minutes of a Titans game tells a familiar story of second half collapses. There’s nothing unusual here from an overall trend, with both 2021 and 2022 seasons seeing a small positive margin after 40 minutes turn into a larger negative one after 80. The Titans have not had a average positive margin after 80 minutes in the first 12 rounds of any season since 2016.
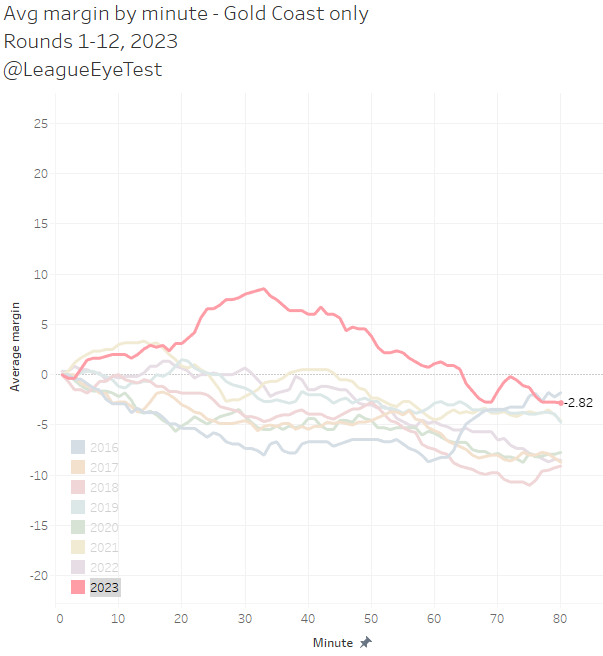
The big difference here is just how strong the Gold Coast have been in the first half. Their +6.0 point average margin at half time is the best since 2016, and it peaks at +8.55 points after 33 minutes. No other Titans side has had an average lead of more than 1.5 points past the 20th minute (2019 season), and no Gold Coast team during that period has had an average lead after the 44th minute. Something has clearly improved this year, and I’ll get to that later.
This year the Titans are holding a decent lead until the 50th minute (keep this number in mind for later), and a minimal lead until the 64th minute when the wheels fall off and they drop from +0.55 to -2.73 in the space of five minutes. They manage to mount a small comeback straight after and get the average margin back to -0.18 in the 72nd minute but it drops again to the final -2.82 after 80 minutes.
Not that you needed this chart to tell you about the Titans second half woes on the scoreboard, but as always, I’ll point to one of the main purposes of analytics is “being less wrong”.
It looks even worse if you split the minutes played this season by whether a team was leading, trailing or even on the scoreboard. Here’s every NRL team over 12 rounds this season, with percentage splits for trailing (red), leading (blue) and even (orange).
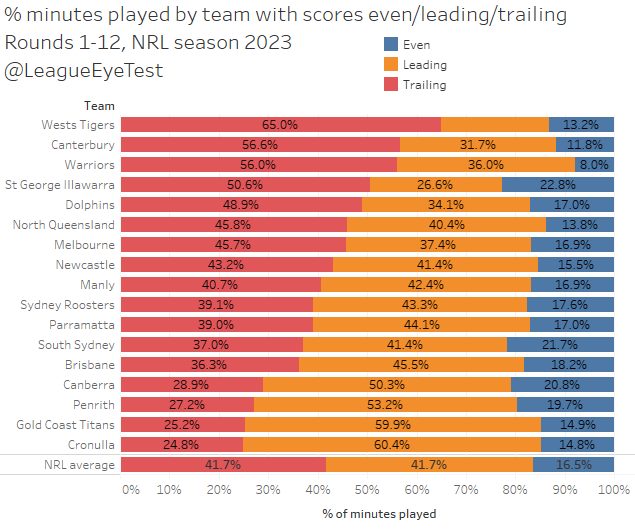
The Titans (10th with a point difference of -31) share a similar profile to the Sharks, who sit in 3rd place purely by points difference (+88). Both teams spend about 60% of minutes leading and only 25% behind on the scoreboard.
Yes, only one other team this season has spent fewer minutes trailing or even on the scoreboard than the Titans. Yet one team is 5-6 and the other is 7-4. Given how close this season is these sort of losses are (again) going to haunt the Gold Coast when they’re looking at another season without finals football.
To put these second half foibles in perspective, I’m going to revisit a chart I used in a 2021 post about the Raiders second half woes. At the time they had the worst second half average margin of any team since 2014. Here’s an extract:
“The Titans should be very happy the Raiders exist because otherwise we’d be talking about their second half capitulations instead.”
The updated chart is below, showing just how woeful the Titans are after the break this season compared to the first 12 rounds of previous seasons.
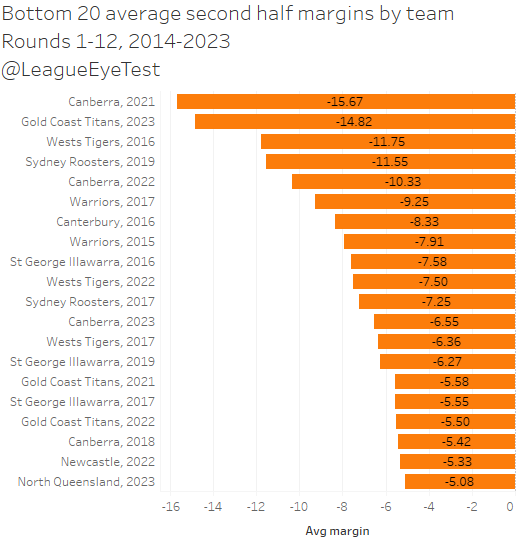
The 2023 Titans are still lucky that the 2021 Raiders exist, because their -14.82 average margin in second halves this season is only outpaced by the Canberra side of two seasons ago. Given the outrageous nature of results from that season, and just how close the 2023 season has been, that number from the Titans this year looks much worse in context. Only three other teams have been down double digits on average in second halves alone, those being the 2016 Tigers, 2019 Sydney Rooters and 2022 Raiders.
One thing that’s changed for the better this season is how the Titans have become very efficient with the ball. They’ve become very good at scoring with limited field position. If you look at their wins by expected points this season, they should be 2-9, which shows that they’ve won several games where they’ve been behind on possession.
For the season their actual points scored is 44% higher than expected, second in the competition to Cronulla. Credit to Holbrook here, he’s put together a team that can score points from low value situations which hasn’t been something the Titans have done previously.
Having an experience half in Kieran Foran helps, as does an actual dummy half and not a part timer, even if he’s not their first choice. David Fifita finding a rich vein of form certainly doesn’t hurt either. Friend of the site Jason Oliver from the wonderful Rugby League Writers demonstrated the impact Fifita is having this season with the ball on their site today.
What hasn’t changed though is that they still concede far too many points from situations that they shouldn’t be conceding from. Their actual points conceded over expected is +27%, placing them well in the bottom half of the NRL. For all the positive work they’ve done in attack, they’ve not seen similar improvement on the other side of the ball.
What is the issue defensively then?
One area is that the Titans give up the most play the balls inside 20 as a percentage of total play the balls. Now as we’ve established many times before, the correlation between tackled inside 20 and scoring points is tenuous at best, so that doesn’t automatically ring alarm bells.
But when you combine it with their drop in second half performance you can see why it’s a bit more concerning. Here’s just the second half numbers for percentage play the balls inside each area, sorted by play the ball percentage conceded inside 20 metres.
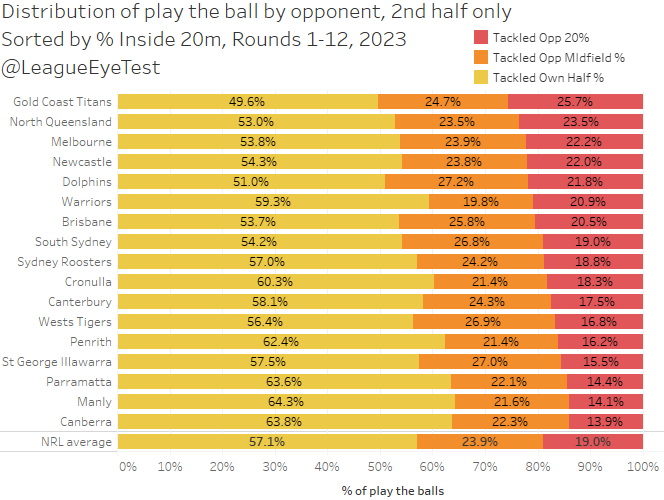
Here we can see that the Gold Coast just give away field position in the second half of games. Opponents don’t even spend half of their play the balls in their own half during the last 40 minutes of a game against the Titans, the only team in the NRL to allow such field position.
To compound that, their opponents are spending nearly 26% of time inside the Titans 20 metre zone, by far the worst in the NRL for second halves and over 2% higher than the next worst team (the Cowboys at 23.5%) and well above the NRL average of 19%.
If we compare their own play the balls by 10 minute buckets through the course of a game, we can start to understand what is happening. Below is a chart of the Titans net play the balls (own versus conceded) by 10 minute buckets.
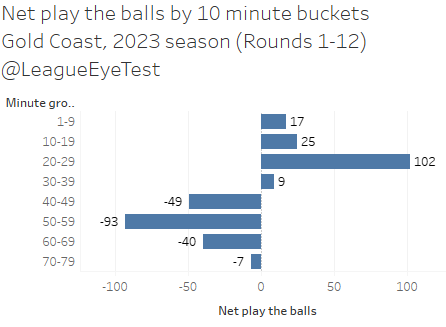
Here we can see why the second half can be so cruel to the Titans. They’re securing more possession early in games, with +102 net play the balls over 12 rounds between the 20th and 29th minutes. However in the second half, they’re giving away significantly more possession, and if you noted before that the wheels start to fall off around the 50th minute you’ll spot that from the 50th to 59th minute they’re 93 play the balls behind their opponents during this period.
If that sounds like a lot, well it is. Even some of the more dominant teams in the competition, like Penrith, have a peak net play the ball difference of around +40, with the Panthers high occurring just after half time. Even a second half dominant team like Souths don’t see the swings that the Titans do, peaking at around +30 from the 60th to 69th minute.
Knowing these trends, now let’s take a look at the heat map of play the ball locations for the Gold Coast this season. Here’s the Titans overall heat map for first halves.
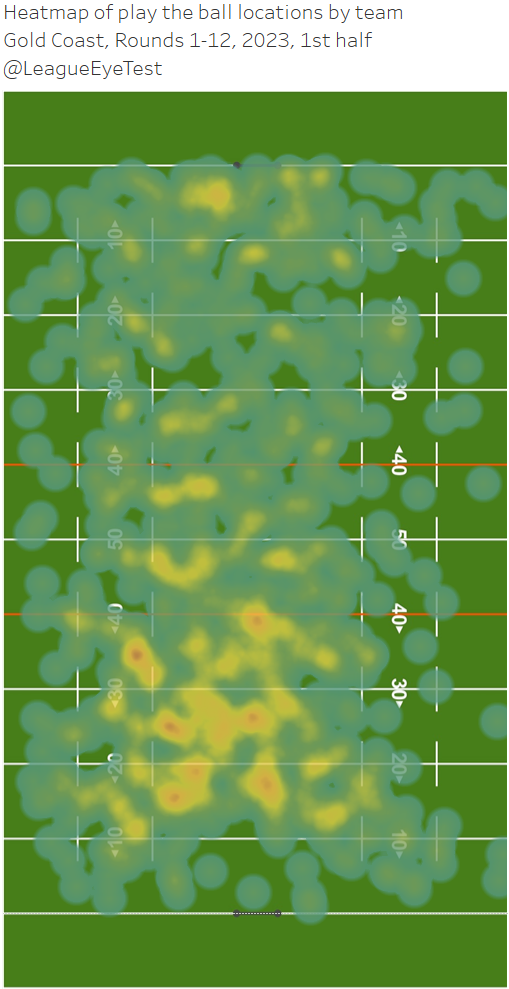
Looks pretty normal, a lot of time in their own half and a good proportion of play the balls at their opponents goal line. But what happens when we split it for just the second half only?
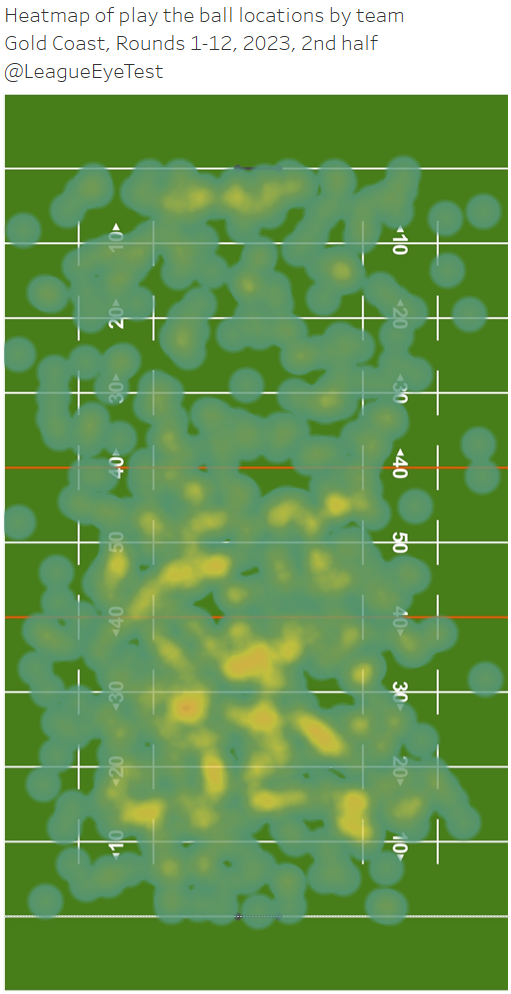
The area close to the goal line reduces in concentration, and there’s an overall reduction in high intensity areas. What if we look at the heat maps by opponents then? Here’s were the Titans were playing the ball in the first 40 minutes.
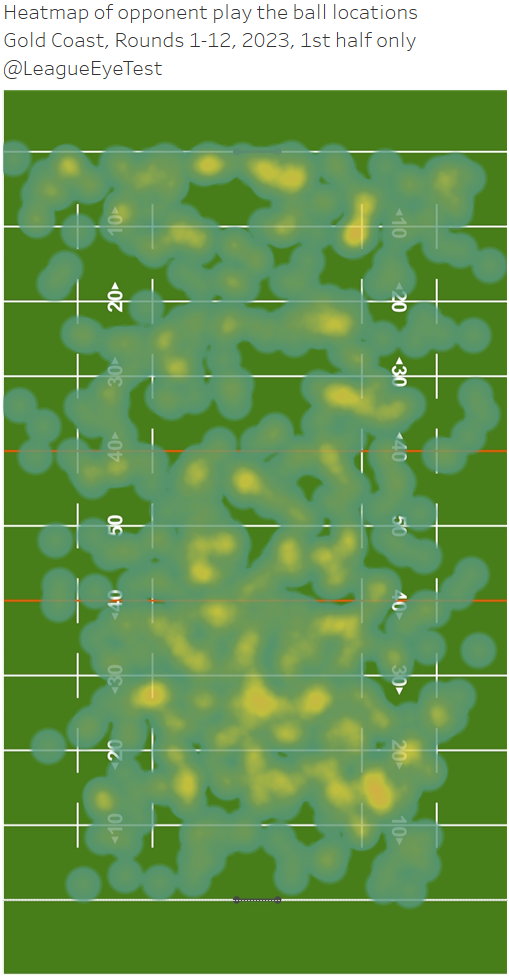
The first half heat map looks excellent for the Titans, not many areas of high intensity which indicates low volumes of possession. And the second half?
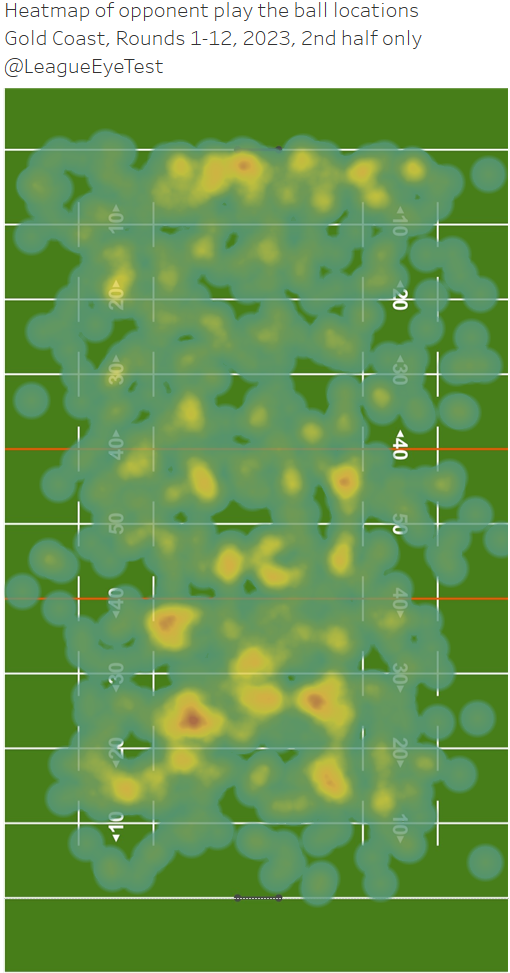
Yikes. There’s a higher concentration of play the balls inside 20, especially in high point value positions close to the line. But there’s also some high intensity areas in red in their opponents own half, indicating again that the Gold Coast are providing their foes with far too much ball in the second stanza.
To delve into this some more, let’s break down a few metrics by first and second halves. The charts below show the average for the first half (blue dot) and second half (orange dot), with the grey bar representing the difference between each point.
First up is average margin per half.
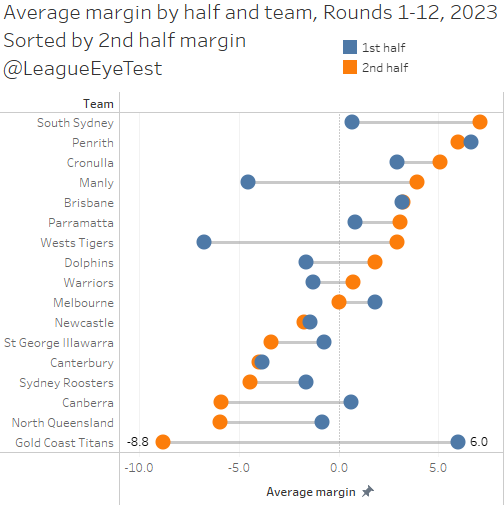
Again no surprises here, we showed the Titans 14 point swing earlier and this just highlights them going from one of the best first half teams at +6.0 points to the worst second half team at -8.8.
Now let’s look at the average number of completed sets per half.
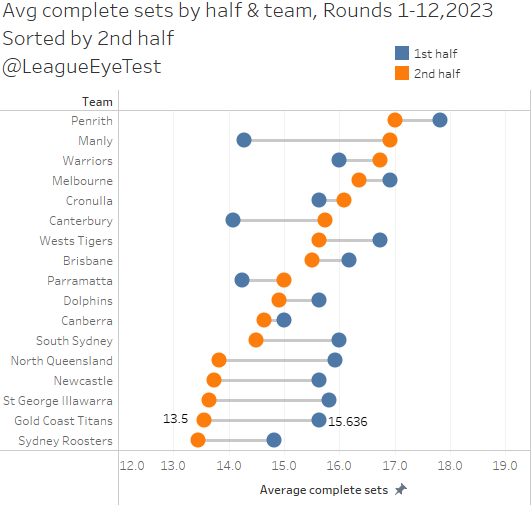
Again we can see the volume of possession the Titans are giving up, only averaging 13.5 complete sets themselves in the second half of games, 16th in the competition and only ahead of known complete set phobes the Sydney Roosters.
One area the Titans don’t lack in is metres per run.
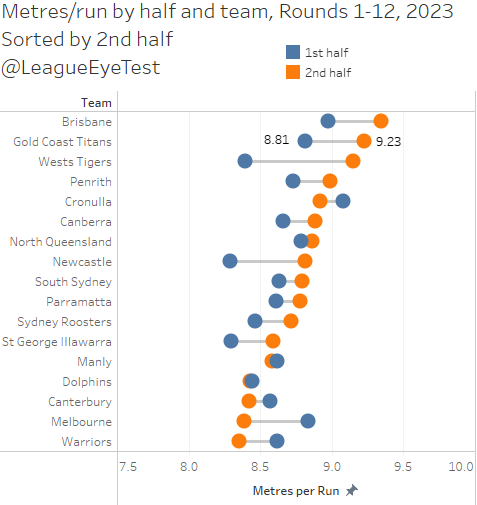
They’re second in the competition for metres per run after the 40th minute at 9.23 metres. Clearly the issue isn’t getting the ball downfield, it’s having enough of it to do so.
And if you flip that chart to run metres conceded, the problem is exposed again.
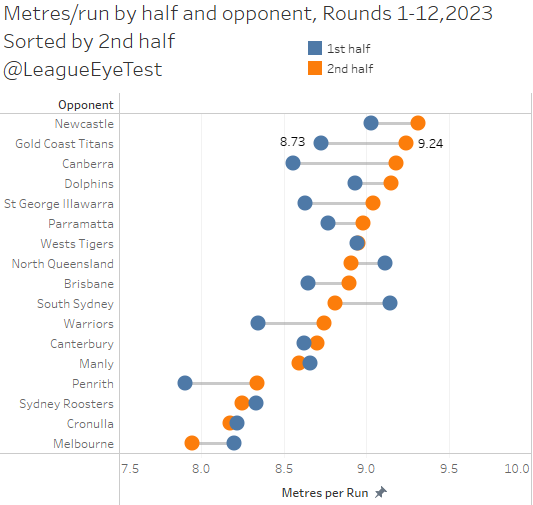
The Titans allow 9.24 metres per run in the second half, second most in the NRL for a net metres per run of -1 centimetre. If you’re going to allow these sort of numbers you need to at least have parity for possession, which we’ve demonstrated the Titans do not.
Compounding things are that the Titans just do not wrap up ball carries after the break.
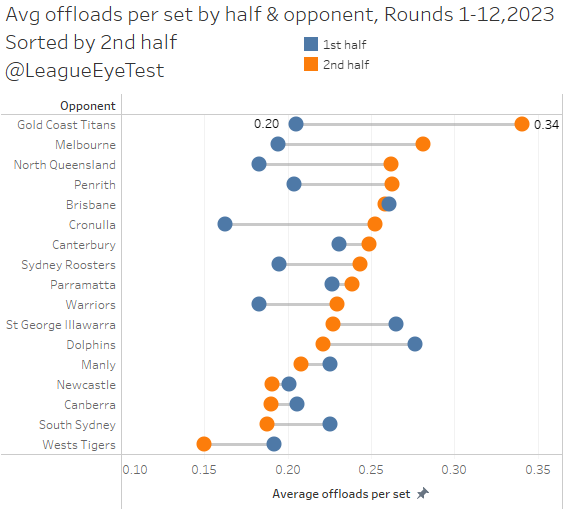
The number of offloads per set in the second half allowed by the Titans is significantly higher than the rest of the NRL, after being middle of the pack in the first half. Are their middles getting tired? Whatever the reason, their inability to stop second phase play late in games isn’t helping.
And here’s something else that also doesn’t help – errors created.
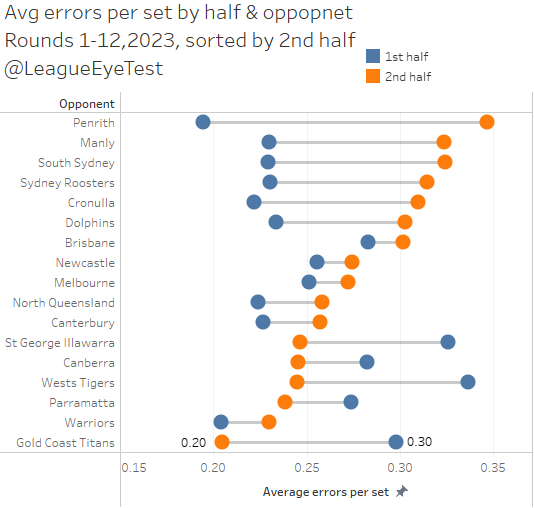
Despite letting opponents offload at will, the Titans don’t force errors in the second half. They rank last in the competition at 0.2 errors per set, and are one of a handful of teams who force fewer errors after the main break than before it. Logic would indicate that fatigued players would make poorer decisions and drop the ball more, yet it doesn’t occur against the Titans.
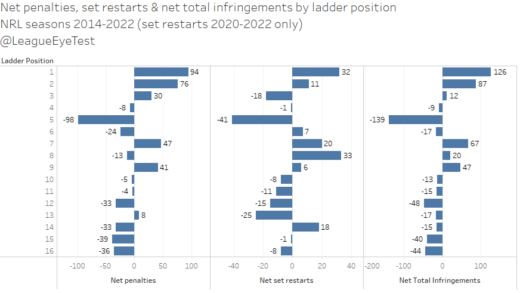
And if you want to look at things from a discipline perspective, below is the average number of set restarts awarded and conceded this season.
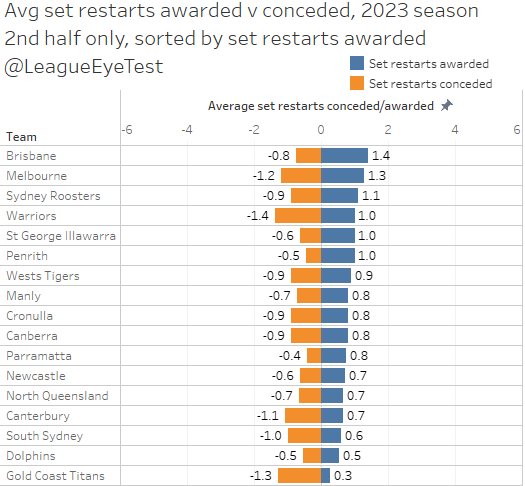
Here we can see that not only do the Titans receive the fewest in the second half at 0.3, they also conceded the second most at 1.3, only behind the Warriors at 1.4. This circles back to the volume of possession the team gives up, as you can’t be awarded a set restart if you don’t have the ball.
In the end a lot of the Titans issues are happening due to the volume of possession they’re affording their opponents. How that happens seems to differ by the game, whether it’s from incomplete sets, poor last tackle options or giving away untimely penatlies. We’ve shown how from the 50th minute onwards that teams playing the Gold Coast see considerably more ball than the Titans, and at a rate far higher than other teams in the competition.
Even the best defensive sides would struggle to contain the volume of ball that under those circumstances. But the Titans aren’t even an average defensive side, and faced with a plethora of play the balls past the 50th minute it’s not a surprise that their defense cracks and they cannot hold a lead. How much you weight the blame on fatigue or coaching probably depends on how you view Holbrook as a coach.
It’s somewhat of a similar situation the Eels face which I documented a few weeks back, but unlike the Eels the Titans have shown they can score without needing their own high volume of ball.
In last years post I theorised that Holbrook’s position was untenable with these sorts of results, and it’s hard to argue that anything has changed in twelve months. They still have issues containing opponents late in games, despite being able to play efficient football in the first half and build a lead.
The positive spin is that these issues should be fixable. Controlling possession, reducing errors and negative play, showing more effort and commitment in defense (especially with respect to wrapping up the ball carrier) are all things that a coach should be able to improve. It’s not as though they don’t have the talent on the field to compete.