Origin fever is hitting peak levels this week (although apparently not in Adelaide).
Which means it’s the midpoint of the 2023 NRL season and as we did last year and the year before , is time for the regular roundup of the Eye Test’s advanced statistical leaders over the first half of the competition.
For new readers to the site, in this post we’ll take each of the advanced metrics for rugby league that I’ve created and adjusted over the past few seasons and see which players are performing well, and for some of them, not so well.
The challenge with most statistics this season is that we’ve had a bye introduced every round due to a 17th team being introduced. Which means some teams have played 13 games, some 12 and some 11, resulting in a ladder and statistical leader boards that don’t compare like for like.
Technically not even the midpoint of the 2023 season as we have 27 rounds, but I’m not releasing something halfway through Round 14 just to be precise.
That won’t be an issue with any of my metrics thankfully, as I’m not living in the early 2000s and all of the below measures are rate based, usually by number of possessions and minutes. The one exception is the Eye Test Player Contribution Rating (ETPCR) which is a per game metric. However, it is normalised to an average number of play the balls per game (135 each in attack and defense for a total of 270) so whilst it’s not completely rate base it is normalised so the impact of a team having a high number of possessions is limited.
If you are new to the site, I would recommend looking through the explainers these metrics to understand the point of them and the player behaviour I’m trying to show. I’ll also try pick out a player or two from the top and bottom lists and go in depth a bit more about their season, why they rank so high or low, how it compares historically or to others in their position.
As I know that disposable time isn’t something that a lot of us have these days, so for each statistic or measure I’ll give you a quick rundown beforehand, so you’ll understand the concept even if you haven’t read the explainers.
All stats are from Fox Sports Stats unless noted otherwise. Let’s kick if off with the site’s catch-all metric ETPCR.
Eye Test Player Contribution Rating (ETPCR)
The quick version is that Eye Test Player Contribution Rating (ETPCR) is a possession adjusted attrition metric that compares a player’s production to the average player.
The slightly longer version is that accumulating statistics that correlate with winning (such as tries, line breaks, tackle busts, try assists) will increase your ETPCR, but generating negative statistics (like try causes, line break causes, errors or missed tackles) will decrease it. These statistics are then weighted by how their team performs in attack and defense, and normalised for possession so that statistics amassed with high possession can be accurately compared with those from low possession. An average NRL player will have an ETPCR of 0. If you want an even longer explanation, there is one available on the site here.
Now let’s look at the top 20 players by ETPCR this season up to Round 13.
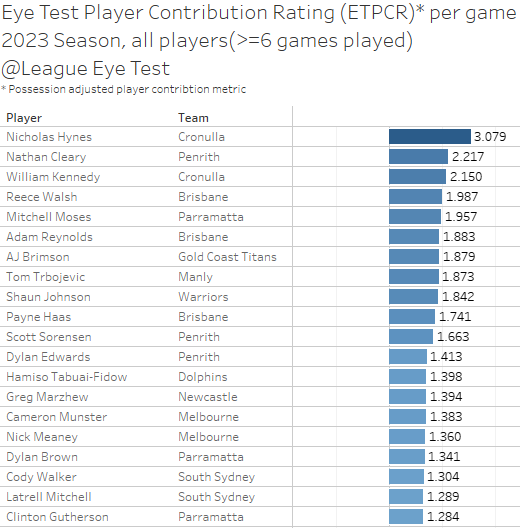
Cronulla’s Nicho Hynes has been the standout thus far in 2023, with an ETPCR of +3.079. This means that Hynes is worth +3.079 per average game consisting of 135 play the balls in attack and defense, and that number makes him the clear number one.
Second place goes to Nathan Cleary at +2.217, with the Sharks William Kennedy an unlikely (but deserving) third place at +2.150, and the only other player along with Cleary and Hynes above +2 points per game.
Brisbane’s Reece Walsh (+1.987) and Mitch Moses (+1.883) make up the rest of the top five. Other notables include Payne Haas (+1.741) as the highest forward, slightly ahead of Scott Sorensen from the Panthers at +1.663. Haas has clearly been the form forward in the competition and Sorensen has benefitted from playing extended minutes on the best team in the league. To show how far ahead Haas is, the next best forward is David Fifita at +1.137.
Jahreem Bula would place right below Sorensen on this list at 1.606 but has only played five games so he just misses out hitting the threshold. That number underlines just how impactful he has been for the Tigers turnaround in the last month.
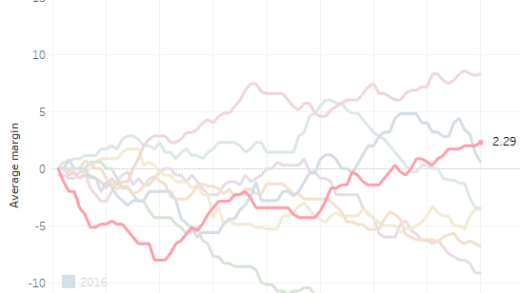
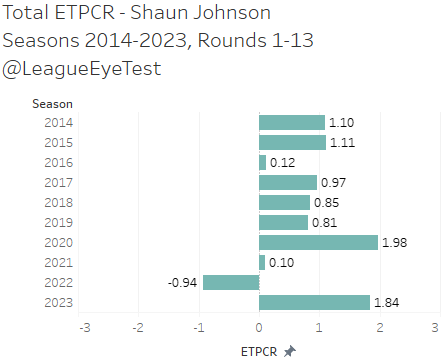
It’s also again worth pointing out just how good Shaun Johnson has been this season, with an ETPCR of +1.842 which places him eighth among all players. I used the below chart in an earlier season post about the Warriors improvements, but it’s worth including again to show how Johnson is having one of his best years in a long time despite being on the wrong side of 30 after multiple serious lower leg injuries.
Another player I want to note, but only in passing because we’ll get to him later is the Knights Greg Marzhew. In 2022 he had the 24th lowest ETPCR at -1.360, but in 2023 he has the 14th highest at 1.394. We’ll get more into Marzhew later.
Now we get to the less glamorous part of ETPCR – the Bottom 20.
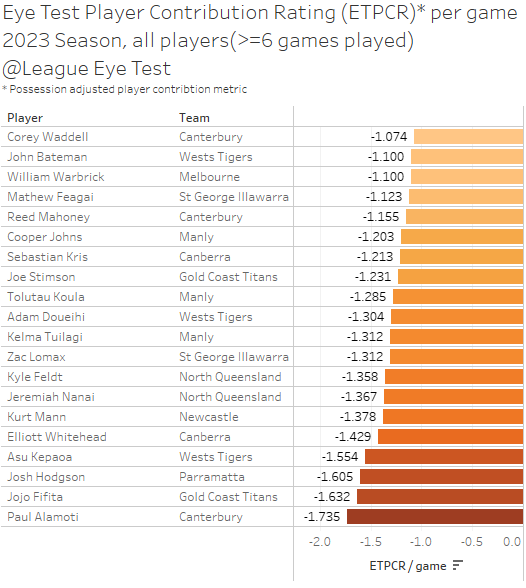
Canterbury’s Paul Alamoti takes the unwanted spot of lowest ETPCR this season with -1.735, beating out JoJo Fifita from the Gold Coast (-1.632) and Parramatta’s Josh Hodgson at -1.605.
Hodgson’s appearance here is quite notable, as he’s playing 55 minutes per game and almost every other player on this negative list is playing at least 70 minutes. The man he replaced isn’t doing much better, with Reed Mahoney having an ETPCR average of -1.155 from his time with the Bulldogs this season.
Why is Mahoney down this low? Part of the reason is the number of missed tackles (highest in the NRL per Fox Sports Stats), and he’s inside the top 20 for errors which we’ll see below.
The remainder of the list has a number of players from teams who have underperformed this season, including last years darling Jeremiah Nanai, who has the 7th worst ETPCR in the competition at -1.367. I’d call this reverting to the mean but it’s more like reverting to the bottom 1%.
John Bateman (-1.100) sitting in this list probably isn’t what the Tigers were wishing for when they brought him back to the NRL.
Error Rate
In short, this metric measures on average how many touches per player it takes for them to commit an error. It could also be called the Burgess Index. Anyway, here’s the list of the worst hands in the NRL so far this season.
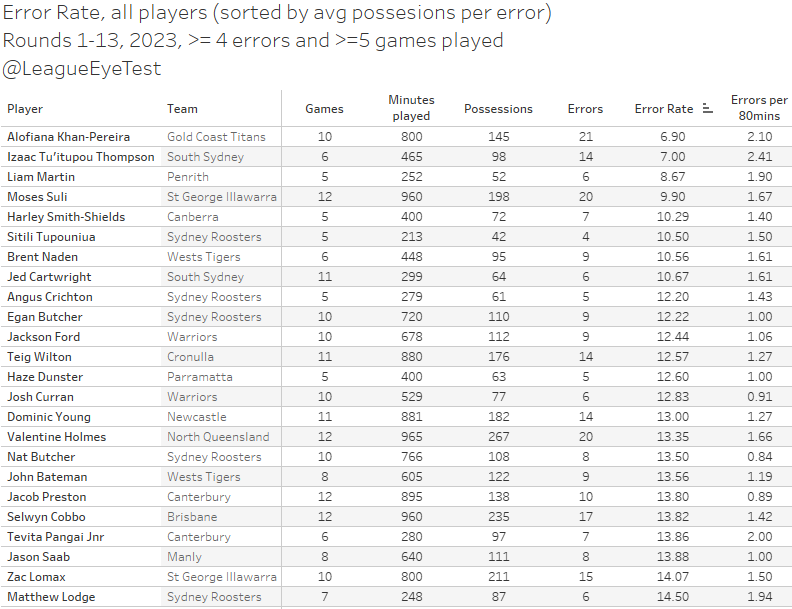
This year’s leader is Gold Coast Titans rookie Alofiana Khan-Pereira, who has committed the second most errors in the league with 21 from just 10 games. With 145 touches, or 14.5 per game, he is committing an error on every 6.9 touches a game which is roughly 2.1 errors every game.
Rounding out the top three are South Sydney’s Izaac Tu’itupou Thompson with an error every 7 times he receives the ball, and Penrith’s Liam Martin who has 6 errors in his five games at a rate of one every 8.67 touches.
From his 10 games this season, Khan-Pereira committed at least one error in nine of those games, and at least two in seven appearances and three or more in four matches. Given how impressive he has looked when he has been able to hold the ball, it isn’t hard to think about how the Titans might have been travelling if he could cut that rate in half.
Another thing worth noting here is that usually error rates are high for players with a low number of games and/or touches. Which makes sense – a coach isn’t going to stick with a player if they’re not confident of them controlling the ball or giving possession away freely.
Which makes Khan-Pereira’s error rate somewhat of an outlier. Moses Suli also has 20 errors thus far in 2023, but his error rate is barely under 10.0 at 9.90.
The previous lowest error rate up to Round 13 in prior seasons was from Suliasi Vunivalu, who committed 17 errors from 165 touches at a rate of 9.71. Prior to that you’d have to go back to Dale Copley in 2014 for a player to have 20+ errors at a rate lower than one every 10 touches. Not exactly elite company and hopefully he can overcome this in a similar Selwyn Cobbo did in 2022.
I would also note that with the threshold implemented I’ve cut out Declan Casey (7 errors from 33 touches in three games, a rate of 4.71) and Ata Mariota (3 errors from 17 touches in 5 games for a rate of one every 5.67 touches).
To help visualise this I’ve put together a scatter plot of errors v possessions from the 13 completed rounds this season.

Here you can see where Khan-Pereira sits almost in a zone by himself. Reece Walsh has slightly more errors (4) but has over double the number of touches so his rate doesn’t sit inside the top 20. Valentine Holmes also has 20 errors but with 267 touches he’s only committing one ever 13 times.
What we can also see from this chart is who the safes dummy halves are in the competition. There are four #9s with over 1100 touches and 6 or fewer errors (incidentally all from NSW) – Damien Cook, Api Koroisau, Blayke Brailey and Reece Robson. There are another two hookers with a similar number of possessions – Reed Mahoney and Harry Grant (both Queenslanders), but both have committed 14 errors this season.
Also of note is that there are two dummy halves with zero errors this season – The Warriors Wayde Egan (715 possessions) and Moses Mbye. Eels fans will also note that Josh Hodgson has the same number of errors as Cook despite having 40% fewer touches of the ball.
Tackle Rate
Tackle Rate shows the rate at which a player completes a tackle or a run with the ball, or makes a decoy or support run, adjusted by possession and minutes played. Typically, middle forwards are short changed in statistical recognition unless they’re playing big minutes because most media just use counting stats and how many buckets people fill up. The birth of this site came from these metrics, as I wanted to see which players were getting through more work in short periods of time.
Simply stating tackle counts presents no context. If two players made 50 tackles, but Player A did in 60 minutes and Player B in 80 minutes, Player A was completing them at a higher rate. Similarly, if two players completed 20 runs in 80 minutes, but Player A’s team had 170 play the balls while Player B’s team had 130 play the balls, Player B would be taking on a larger amount of his teams’ workload.
There is some additional context to these numbers. Interchange players are on field for fewer minutes and can spend more energy over a shorter period of time knowing they’ll get a break. Bad teams also spend a lot of time tackling, which inflates tackling numbers.
As does being a bad defender. Teams don’t run at Dylan Brown when they play the Eels, they run at Mitch Moses. Let’s normalise not using high tackle counts as a sign of good defense, more a sign of where a team focused their attack.
With the theory out of the way, here are the leaders for 2023.
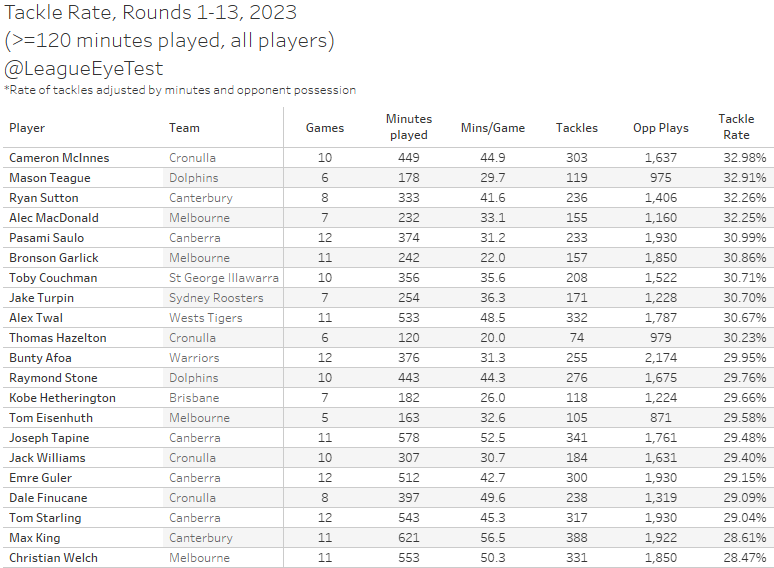
Cronulla’s Cameron McInnes takes top spot at 32.98%, indicating he completes a tackle on one third of every play the ball the Sharks face whilst he is on the field. Second place goes to the Dolphins bench forward Mason Teague at 32.40% and third place is Canterbury’s Ryan Sutton at 32.26%.
Again, it’s worth noting that Canberra’s Ata Mariota would easily top this list if he had played enough minutes. The Raiders middle has a tackle rate of 38.66% from 95 minutes played this season. That is part of the reason why I implement a threshold of at least 120 minutes (based on the assumption a player would play 4 games of 30 minutes or 5 games of 24 minutes).
Single game tackle rates can easily push into the high 40% ranges – Josh Kerr had a rate of 53% playing 19 minutes in Round 11) – and they tend to stabilise as minutes played increases. We’ll have more on that, and Kerr, later in the post.
Ball Runner Rate
Ball Runner Rate metric looks at the rate at which a player completes a run with the ball, adjusted by possession and minutes played. It looks purely at how often they run the ball, there’s no influence for quality of run here, just how often they’re doing it.
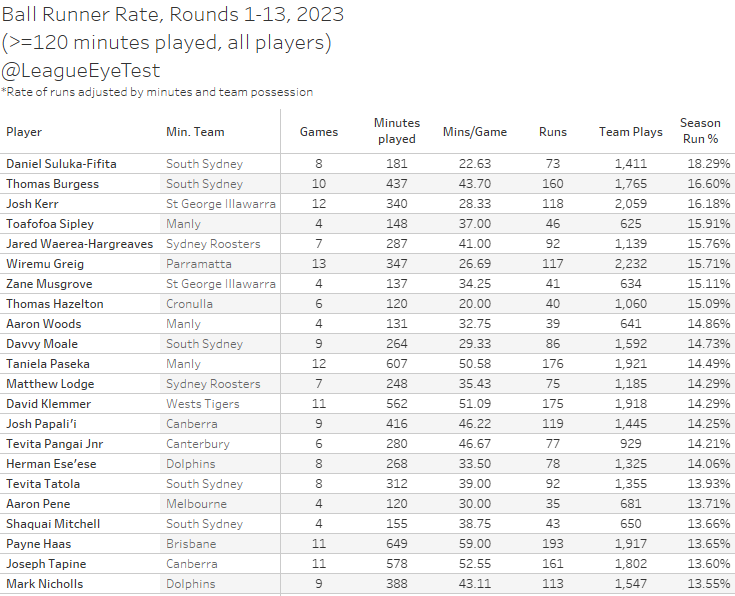
Number one this year is Souths interchange forward Daniel Suluku-Fifita, who had completed a run on 18.29% of play the balls whilst on field for the Bunnies this season. That rate is nearly 2% higher than his closest competition, Tom Burgess from Souths, who completes a run on 16.60% play the balls. Third place is taken by the aforementioned Kerr, with a rate of 16.12%.
I’d be negligent here if I didn’t mention the impressive season Wiremu Greig is having, placing fourth here at 15.71% from 13 games. The impressive part is that his work rate with the ball hasn’t dropped with increased minutes, which we can see below.
Here I’ve plotted the number of minutes Greig has played with his Ball Runner % for the season so far.
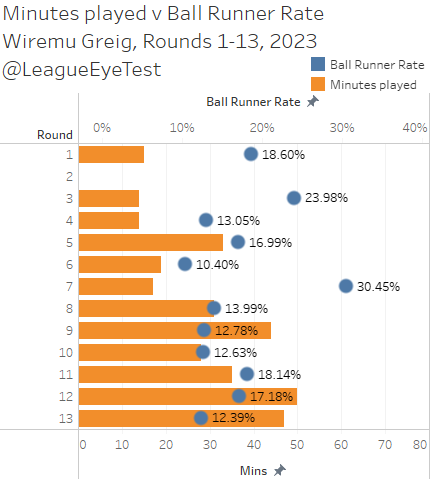
Whilst he has seen some huge numbers above 20% in low minute games, he’s also had games with a ball runner rate higher than 17% in minutes of 30, 33 and 50. Even his “low” rates in the 13% range are higher than the average for a middle (11-12%). His emergence as a middle that the Eels can rely on has been one of the bright spots of their season, and the increasing number of fans populating Wiremu Greig Island shows that Parramatta fans are recognising it.
This year we’re also going to look at the hardest working backs. Below is the Ball Runner Rate chart just for fullbacks, wingers, and centres.
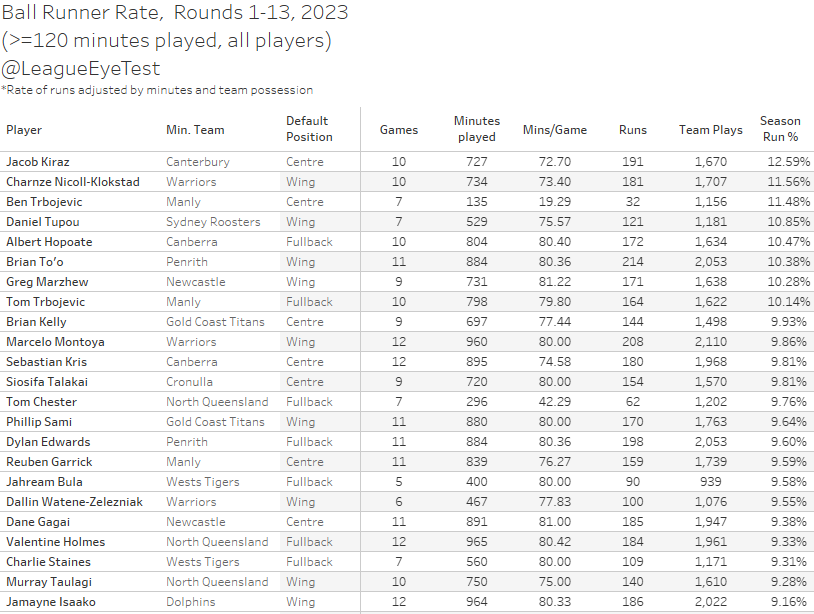
It shouldn’t be too surprising to see the Dogs Jacob Kiraz leading here, with a rate of 12.59% which would embarrass most middle forwards. That’s over 1% Charnze Nicoll-Klokstad in third at a rate of 11.56%, with the Sea Eagle’s Ben Trbojevic third at 11.48%
Below them are a number of other usual suspects in Daniel Tupou, Brian To’o and Greg Marzhew, with Albert Hopoate and Tom Trbojevic joining them as the only outside backs to complete a run on more than 10% of play the balls whilst on field.
I noted before that these Ball Runner Rate numbers just measure quantity, not quality. What if we overlayed the number of tackle busts with the number of runs per game as a proxy for “quality” runs? The results are below.
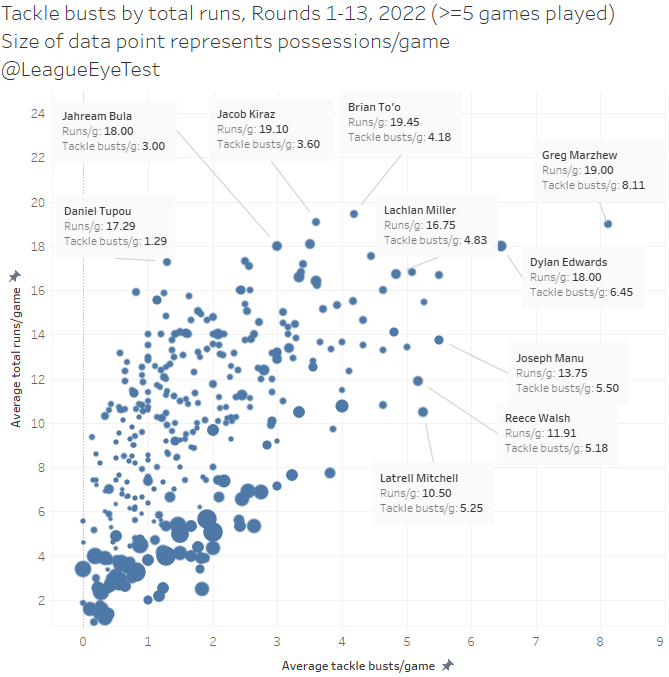
We can see here where the players above sit, and Marzhew may be the most impressive of all of them. Almost 20 runs per game with an average of almost eight tackle busts per game. No one else in the NRL is approaching even 6.5 per game, with noted stat accumulator Dylan Edwards at 6.45 per outing.
That’s the difference between a runner like Marzhew, Edwards or Joseph Manu, who are high volume runners who also evade defenders, and those like Daniel Tupou, who averages a similar number of runs to Edwards but only breaks 20% of the tackles.
I’d also like to use this space to do a victory lap on Marzhew, whom I noted in late 2021 could be in for a huge 2022. He wasn’t because he’s got obvious defensive issues and whatever Justin Holbrook had against him, but I noted at the time he was in the 98th percentile for a number of per game stats including runs, one pass runs and run metres.
It’s great to see him showing how impactful he can be this season for the Knights after struggling to break into a Titans side that could have used his explosive style.
Total Run Rate
Total Run Rate takes the Ball Runner Rate metric and incorporates option runs (supports & decoy), to identify those players who make a high number of runs but don’t always complete one with the ball.
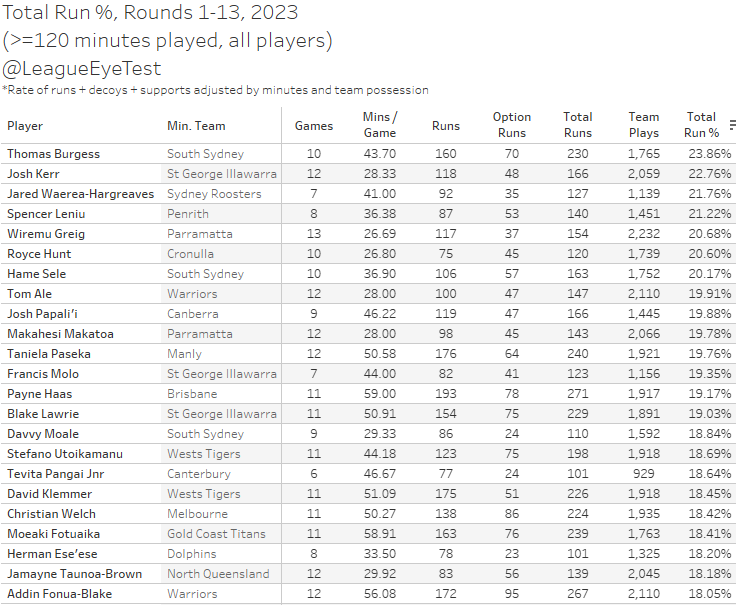
The top player by this metric is South Sydney’s Tom Burgess, who completed a run, either with the ball, as a support player or decoy on 23.86% of the Bunnies play the balls this season. This means he’s completing one of those run types on nearly 1 in 4 play the balls whilst on field and is one of just two players above 23%. The other is Kerr again from the Dragons, at a rate of 22.76%.
The big difference between those two is that Burgess puts up the same numbers as Kerr for Total Run Rate with an extra 15 minutes on field, playing nearly 44 minutes per game compared to just over 28. The Roosters Jared Warea-Hargreaves continues to be productive in the twilight years of his NRL career, placing third at a rate of 21.76% playing over 40 minutes per game, which are tremendous numbers for 34 year old prop forward.
And again, there’s that Wiremu Greig showing up in fourth spot, although his option run numbers are similar to Warea-Hargreaves who appeared in five fewer games.
Former Run Rate king and future Rooster Spencer Leniu sits in fifth spot for what might be considered a “down” season for him. The numbers show he is being used more as a decoy this season, with 53 option runs representing 38% of all runs by Leniu this season. That number is up from 29% in 2022 and just 19% in 2021 when he was leading this metric.
Involvement Rate
The last stat we’re going to look at combines Total Run Rate & Tackle Rate. Good indicator of players who put in on both sides of the ball. Some will be high in Run % but not Tackle % (Andrew Fifita was a great example in prior seasons). Not that there’s anything inherently wrong with that, too little emphasis is placed on the role a player is asked to fill. So again, we’re looking at the quantity of involvement but not quality.
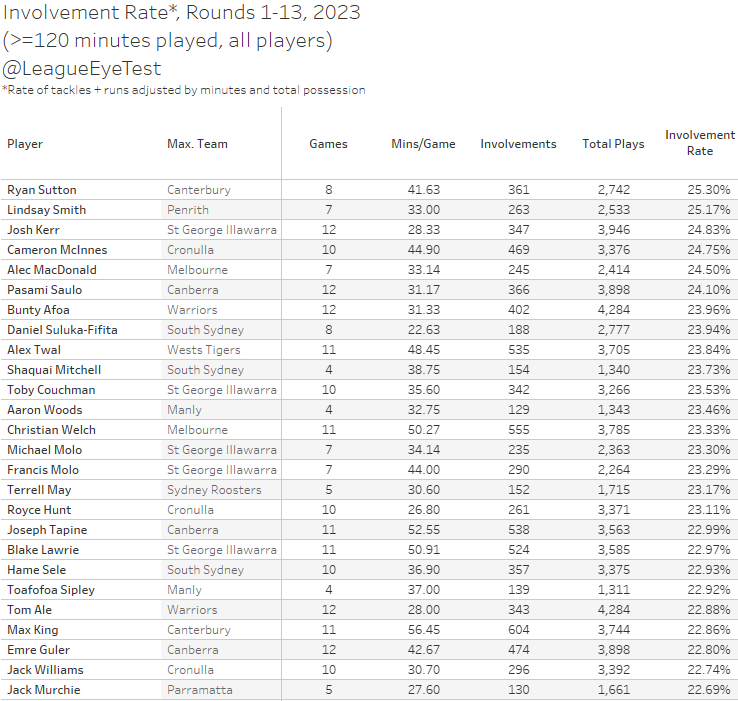
Canterbury’s Ryan Sutton can make the claim to be the most active forward in the league this season, with an Involvement Rate of 25.30%. This indicates that Sutton completes a run, support or decoy, or completes a tackle on 1 in four play the balls whilst on field, a tremendously high rate.
Lindsay Smith from the Panthers is the only other player above 25% at 25.17% which is good enough for second place. Kerr shows up again, placing third for Involvement Rate after placing high for both running metrics before, with a rate of 24.83%.
Kerr’s placing here and performance over the past few seasons is another great example of how a players work rate changes with minutes played. Below is a chart of the average minutes played per season (Rounds 1-13) for Kerr compared with his involvement rate.
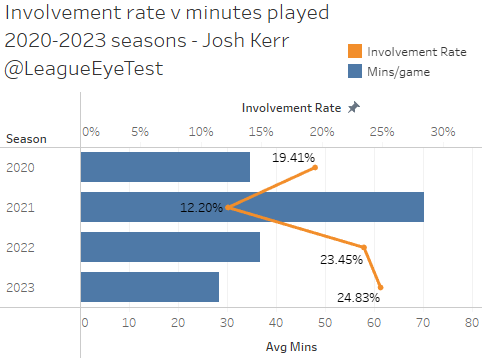
You can clearly see how the impact of increased or decreased minutes had on Kerr’s involvement rate. For 2021, when he was playing 70 minutes per game his involvement rate was just 12.20%. That number is less than half of what his 2023 Involvement Rate is, but that is due to him playing just 28 minutes per contest. It’s obvious that players cannot put in the same amount of work across increased minutes, but sometimes I feel that context is lost when we just talk about how many tackles a player made.