Another month, another chance to update on how efficient each NRL team has been in attack and defense for the 2023 season.
Previously I had been framing how teams perform compared to their expected points as over or performing, but I’ve had a thought based on some feedback from the April update and it’s better explained as an attacking and defensive efficiency metric than on overall performance alone.
In a way I had been doing that by comparing teams expected points with actual scoring and putting teams into inefficient and efficient buckets, but this would just be extending it further. It won’t change the analysis, you’ll still see the same charts and outputs, but the findings will be spoken from a team efficiency point of view.
If you are new to the site, there’s a thorough explainer that goes into the details of the expected point model (ETXP) that I use for this analysis. The condensed version is that it assigns a point value to the location of every play the ball and tackle number based on the probability of scoring from that location.
As you’d expect, possession closer to the try line has a higher probability of scoring, so teams that dominate possession will fare better in this regard. That said, there’s little correlation between tackles inside 20 and scoring points, because not every team is average and some execute better than others. Readers of my previous updates in March and April will know how poorly the West Tigers have fared here.
With that out of the way, let’s get into the numbers post Round 14 which marks the end of May.
First up is a plot of actual points scored versus actual points conceded per game to get a picture of where teams are sitting from their on field performances.
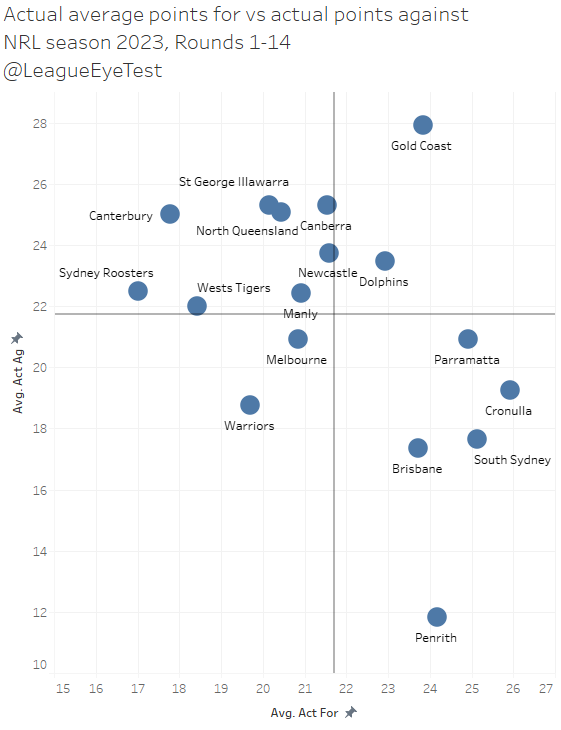
Penrith are the standout here to no surprises, conceding fewer than 12 points per game but scoring more than double that themselves. The only teams close for opponent stinginess are the Broncos and Rabbitohs, both allowing fewer than 18 points per game.
On the attacking side of the ball, there’s a clear distinction between the top 7 teams and the bottom 10. Along with the Panthers, there are six other teams (Broncos, Rabbitohs, Eels, Sharks, Dolphins, and Titans) averaging at least 22.9 points per game.
Then you have a gap of almost 1.5 points per game scored down to the bottom ten, led by Newcastle at 21.6, with Canberra at 21.5, and the Sydney Roosters bringing up the rear at just 17 points scored per game.
Now we have established what teams are truly doing on field, we can move on to their expected scores and fire up some comparisons to see which teams are being the most efficient with the ball.
For the plot expected points for and expected points against. I’ve split the chart into four quadrants:
- Dominant – above league average in both actual and expected points
- Efficient/lucky – above league average in actual points but below average in expected points
- Inefficient/unlucky – below league average in actual points but above league average in expected points
- Incompetent – below league average in both actual and expected points

No surprises again to see the Panthers out in front here, averaging 26.6 expected points per game and conceding just 18.0. Those of you with good memories will remember how the Wests Tigers were dominating expected points last month, and that has somewhat continued here, averaging 23.1 expected points for and conceding just 14.9.
Other than those two you could throw a blanket over most of the competition, which is possibly one of the reasons why the ladder is so close this season.
Now let’s plot those expected numbers against their actual numbers to see if any clearer trends emerge.

It’s similar to the expected for and against plot from before, with Penrith sitting solely in the “Dominant” quadrant. The Wests Tigers own the “inefficient/unlucky” quadrant, but with over half the season gone I’d be weighting that heavily towards the former rather than the latter, even if they’ve been much better of late.
Looking at the opposite quadrant, the rest of the higher on field scoring teams mentioned sit here, with every single one of them is averaging fewer expected points than the average NRL team. Which is why I’d be classing them all as “efficient”, scoring higher than league average from possession that would usually yield less than league average points. From there you have the glut of mid-table teams without anyone able to break away from the pack.
Lastly, we have the “incompetent” corner, occupied by two sides that played each other on Sunday. Both sides have struggled to cross the line this season, which is astonishing when you look at the Roosters history, and possibly fueling that is both teams’ inability to generate substantial amounts of high point value possession.
Historically that hasn’t been an issue for the Roosters, who have shown the ability to strike from anywhere on the field. And it’s also been (recently) the case for the Dogs, who were the poster children under Dean Pay (and to a lesser extent Des Hasler) for generating whopping expected point scores through endless nonthreatening waves of possession.
Next, we’ll move on to looking at points conceded plotted against expected points yielded.
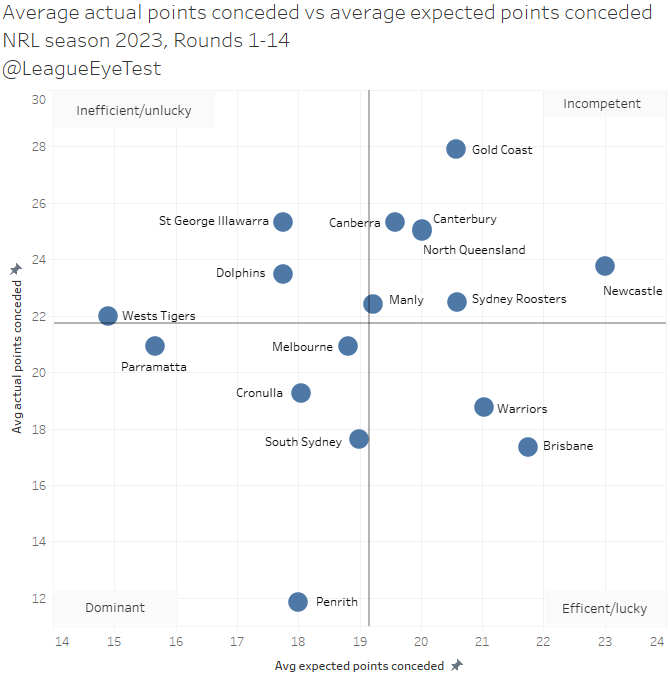
Here’s where things start to show us some interesting insights. In the “dominant” quadrant we still have the Panthers mostly on their own, with Parramatta, Melbourne, Cronulla and South Sydney manning the fringes. The Sharks and Storm showed this weekend that they probably don’t belong in this area currently, and there’s too many question marks over all sorts of things at the Eels to consider them even a chance of September football.
The “incompetent” quadrant houses the usual suspects, a few of whom we’ll examine in more detail shortly. And the “inefficient” quadrant is largely unoccupied other than the dumpster fire that is the Dragons and the Dolphins, who aren’t conceding a lot of points but are letting teams downfield too often.
What really drew my attention from this chart is not only that the Warriors sit inside the “efficient” defense quadrant, which is mind blowing on it’s own, but the situation around the Broncos position.
Brisbane have conceded the second most expected points in the competition, giving up 21.8 points per game based on opponent field position. That number is only behind Newcastle, who give up 23.0.
This makes the actual points per game conceded by the Broncos even more impressive. They’re only allowing just over 17.0 points per game, similar to Souths, but are defending higher point value field position than the Bunnies, or any other of the top defensive sides in the competition.
Penrith only allowing 11.8 points per game makes complete sense when you see how stingy they are with opponent field position, and the same can be said for Cronulla and South Sydney to a lesser extent. But the Broncos are routinely holding teams to low totals despite allowing them quality field position and high volumes of possession.
Here’s a plot of the expected points by minute from Saturday evening’s Brisbane v Cronulla game, which further emphasises the point.
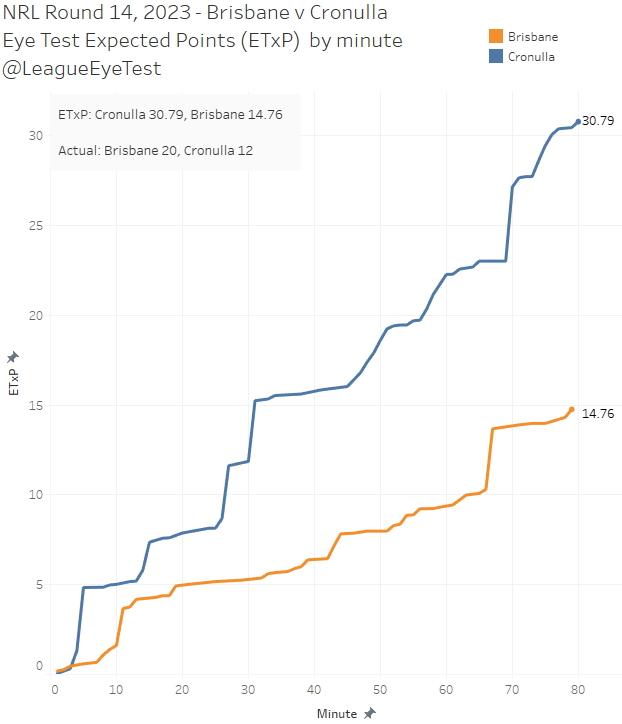
The Sharks had enough possession to score nearly 31 points, but only ended up with twelve. Their ability to defend under such pressure is something that friend of the site Liam noted on the Maroon Observer this week as well. Cronulla had 48 tackles inside the Broncos’ 20 metre zone on Saturday evening and were able to score just twelve points. That’s the seventh highest amount of play the balls in the red zone this season. A very Tigers-ish performance.
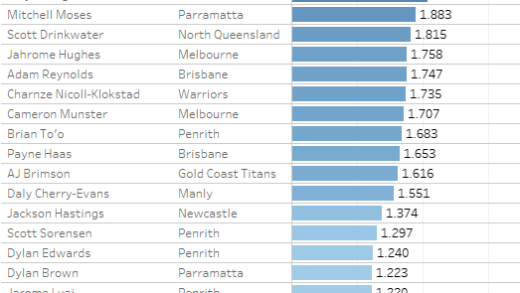
Given what we’ve just uncovered, let’s look at each teams percentage scored or conceded over expected scores from the 14 rounds played thus far. I’ve also included a line for the 14% above expected that is the NRL average. For this chart, higher is better.
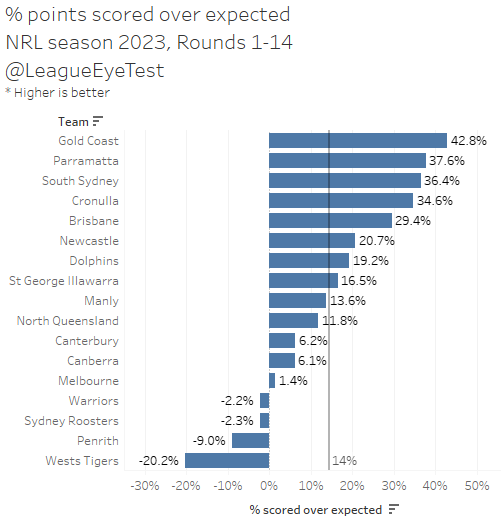
Here we get a good look at just who are the more efficient teams with the ball. The Gold Coast, the best team in the competition inside 40 minutes, lead here scoring at 43% above expected.
As we noted recently on the site, there’s a distinct trend here with the Titans being able to score from low value field position, as long as they have the ball. The issue is that past the 50 minute mark, they have an amazingly low amount of ball themselves, and gas out from continuous defense. It makes perfect sense that they’re so dominant here, because their issues aren’t necessarily with the ball.
The other notable point here is that Penrith, despite being so dominant, are actually -9% lower than their expected points. Again, this isn’t unforeseen, as their game plan is based on having a high volume of possession and breaking teams down through constant attacking phases. I’d also note that the Wests Tigers look diabolical here at -20%, but that’s an improvement from -37% a month ago.
Let’s flip that chart now and look at how well teams are defending, by comparing their points given up against what an average team would be expected to do. Remember lower is better for this chart.
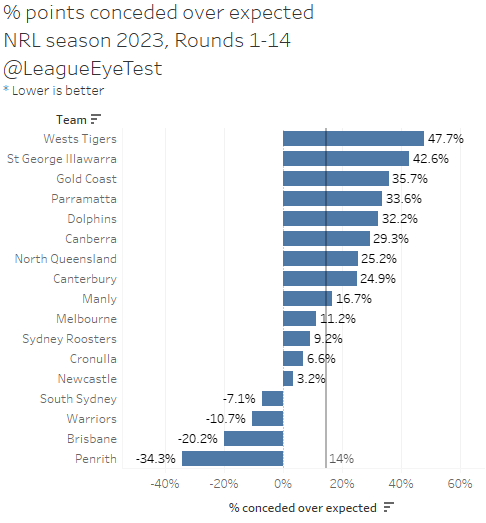
This is where we can see some of the poorer defensive teams stand out. The Tigers and Dragons are given if you’ve watched them play this season. The Tigers number is significantly worse though as we saw from the chart above, they have one of the lower expected point totals conceded. That is, they’re allowing points from situations where an average team wouldn’t allow points.
The Gold Coast allowing 35% more than expected underpins the issues they’ve had defensively. If you’re going to be efficient with the ball, but inefficient defending it, you need to ensure you’re winning the possession battle all game otherwise you’re incredibly susceptible to huge changes in momentum. Which happened again as the Titans surrendered another half time lead in embarrassing fashion.
And speaking of needing to win possession battles, we have the Eels at -33.6%. This is yet another telling data point, with Parramatta yielding the second fewest expected points in the competition behind the Tigers, but allowing one third more points from that possession than an average team would.
Being a strong defensive team that can control field position is useless if you can’t prevent teams from scoring as well. Otherwise you’re digging a hole you can’t get out of without endless amounts of your own possession. Hey – that’s yet another thing we’ve already deconstructed on the site this season.
As we move to the bottom of this chart, we again see that the Bunnies and Wahs are above average defensively this season both on field and through expected points. We can also see that Penrith just suffocate their foes, giving up one third fewer points than expected from the scant field position they allow. Given the NRL average is +14%, the Panthers are basically allowing half the points from similar field position than the rest of the competition would be.
And again we get to Brisbane. They’re allowing 20% fewer points than expected this season, double the amount of the third most miserly team (the Warriors). As much as we laud the Panthers defense, similarly substantial praise should be made in the direction of Brisbane, as the profile of the play the balls they are defending is drastically different.
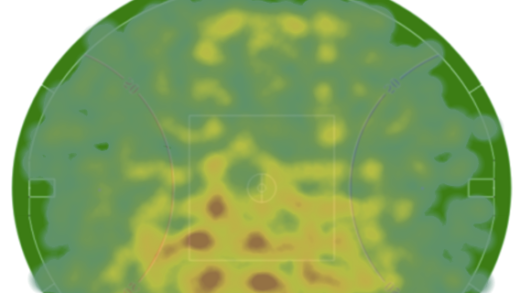
Firstly, let’s look at the heat map of play the balls by Panthers opponents this season.
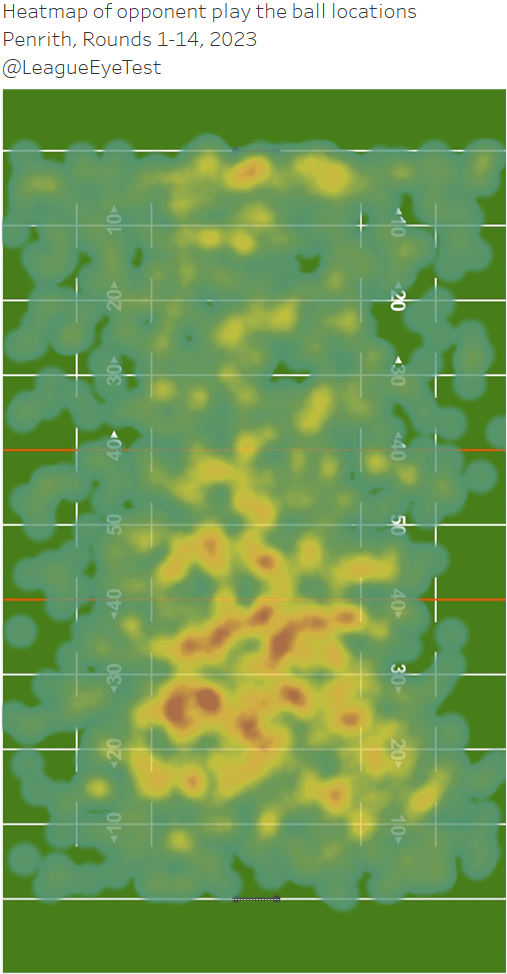
You can see the most intense areas of the field are inside a teams own half, and more specifically inside 40 metres. There’s very little red showing inside their own half, indicating Penrith aren’t having to defend their own red zone that often.
Now let’s check out the same chart for the Broncos.
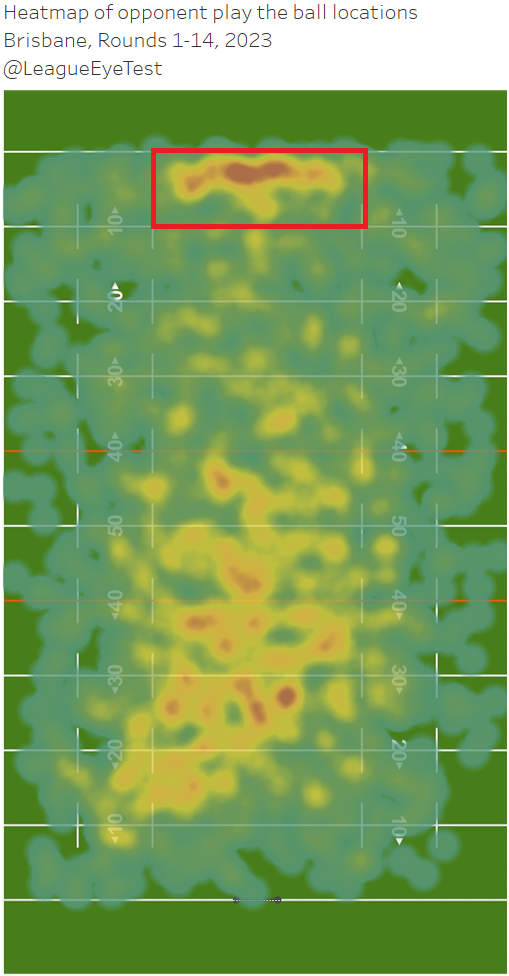
It should be painfully obvious but I’ve highlighted the main difference here. Brisbane have defended 194 play the balls in the middle half of the field 10 metres out, almost 40 more than second placed Canberra at 156, and 60 more than third (Canterbury). That number is also 100 play the balls, or nearly 17 full sets more than the Tigers have defended, yet they’ve conceded more points than Brisbane.
Need some more evidence? Here’s the average net play the balls inside 20 metres after 14 rounds this season.
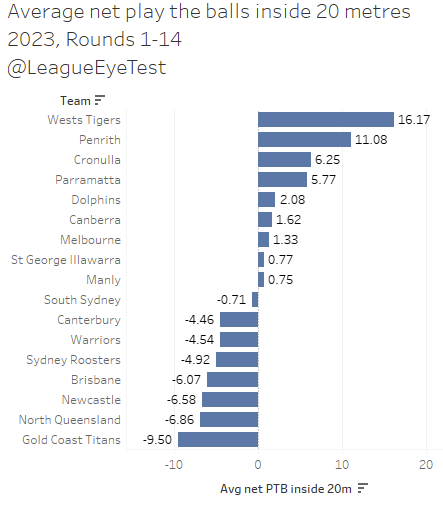
Brisbane are allowing six more play the balls than their opponents, the fourth worst mark in the league. Penrith are second, with 11 more play the balls inside 20 than their opponent. I’ve used averages because due to byes the Panthers have played two additional games over the Broncos, who haven’t had a bye yet.
But for reference here are the totals. Penrith have a net play the ball inside 20 margin of +133 after Round 14, second in the NRL. Brisbane is -85, third worst in the competition. Meaning the Panthers have had 22 full sets of six more inside opponent red zones, while Brisbane has had 14 full sets fewer play the balls in the same area.
If it’s not become clear yet I’ll spell it out – the Broncos defense this year, specifically through the middle is elite, especially when you consider where they’re defending compared to Penrith. The Panthers may be conceding the fewest points in the league but they’re not letting teams get to those high point value positions. Brisbane may be letting teams get close to the line, but they’re stonewalling them once they do. Both are elite defensively, just in different ways.
Brisbane also have the lowest percentage of tries scored in the middle of the field of any team in the competition. There are some issues with their left edge defense if you check out the link from Stats Insider above, but the heat map above shows that teams don’t appear to be attacking that section of the field as often given those numbers would suggest. I’m not sure why you’d be constantly trying to crack the Broncos through an area where they’re obviously not leaking points, but then maybe that’s why I’m not an NRL coach.
Given their impressive goal line stands, it’s no surprise then that their net wins over expected is so high, which can be seen below.
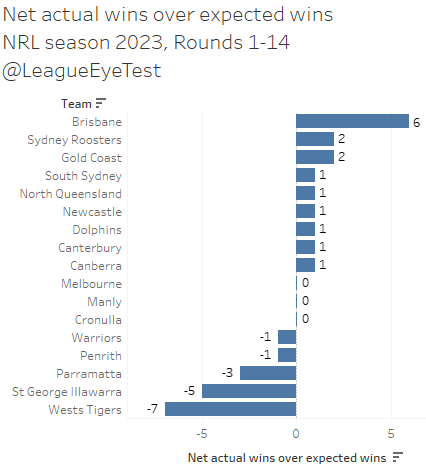
Brisbane have won six games more than an average team would be expected to given the same field position they’ve accrued and yielded. No other team has more than 2 wins over expected this year. On the other end of the scale, the Tigers, Dragons and Eels are all losing more than an average team would in the same situation, which makes sense looking at their performances.
Winning games where they’ve been on the losing side of the possession battle is a sign they’re committed in defense, since teams will often crack under the pressure of constantly defending their line. And it’s a trait that is incredibly important in September when you can’t solely rely on crossing the line more than your opponent. As we know, defense wins premierships.
And if you look at their average margin by minute for the season compared to prior years, that commitment to defense can be seen.
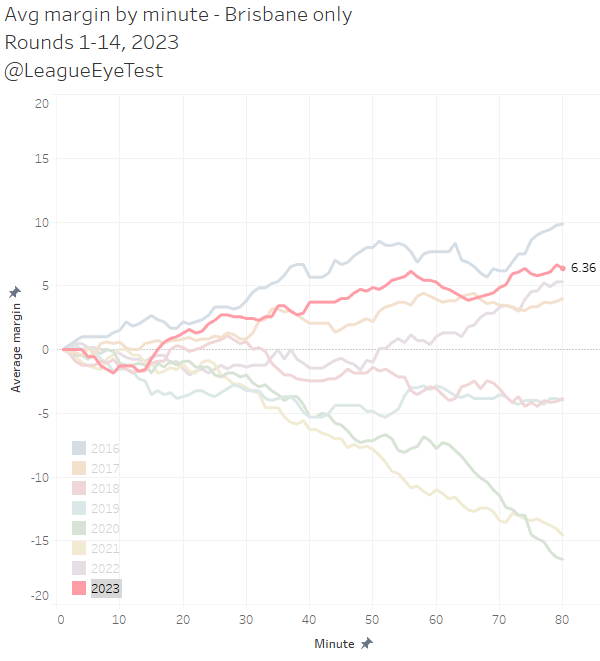
Similar to prior seasons (2016 being the exception), the Broncos are generally behind on the scoreboard after 15 minutes. This year it’s to the tune of about 1.5 points in arrears up to that point in time. That swings back a full three points to being ahead 1.52 after 21 minutes. Unlike prior seasons, their solid defensive structure is keeping them in games until they can get across the line, rather than capitulating once they trail on the scoreboard. Their margin after 80 minutes is the highest outside of 2016 from the last eight seasons as well. Coach Kevin Walters deserves a lot of credit for their attitude this season when they don’t have the ball.
Brisbane aren’t this years Cowboys either. The average ladder position (at match time) for North Queensland opponents in 2022 at the same point of the season was 8.9, the highest in the NRL which would indicate they had a soft draw. It wasn’t much tougher for Cronulla either, as their average was 8.8. The average ladder position (adjusted for a 17th team to make comparisons with last year valid) for Broncos foes this season is 7.8, meaning they’ve arguably played better quality teams than the Cowboys did to this point. And that 7.8 is one of the lowest in the NRL this season, indicating they’ve had a tougher draw than most other sides.
Yes, Brisbane has had the luxury of playing teams situated 16th and 17th on the ladder, but other than the Eels in Round 8, they have not faced a team lower than 8th. And yes, one of those games was after Round 2 when the Dragons sat third thanks to a win and a bye. And yes, they’ve had a “soft” draw in a different way with so many games in south east Queensland reducing their travel burden.
But as regular readers know I’m a firm proponent of the saying that you can only play who is in front of you. And the Broncos have been winning road games with a 7-1 record for games flagged as “away”, no matter how close they are to home. Their last two in Cronulla and Napier have been sufficiently far enough away to destroy the narrative around their travels. The only other team with more than four away wins so far is Souths, who have a road record of 6-2.
Given the state of the competition they’ve probably faced their toughest stretch of games as well. Over the next month they face the Knights, Titans, Dolphins and Bulldogs to end the Origin period of the season. Their run home looks a lot easier as well with the Roosters and Eels under performing.
Most of the talk around the Broncos this season has been about their attack, and rightly so. Reece Walsh and Ezra Mam have done amazing things with ball, Kotoni Staggs is playing better than the year he was selected for NSW, Adam Reynolds continues to make Souths look foolish for letting him walk away and we’re running out of superlatives to describe Payne Haas’s career year. And that’s not even getting into what Pat Carrigan or Selwyn Cobbo are doing.
But it’s the defensive side of the game that Brisbane has been most impressive in my eyes this season and will be something to keep an eye on moving forward. You can point to the Bunnies dropping 32 points on them earlier in the year, but they’ve also faced Penrith twice and allowed them just 27 points in 160 minutes.
It’s hard not to get caught up in the vibes, but there actually may be an actual Kevolution occurring.