
This article was originally posted on Medium in November 2019.
In my first article on some new advanced statistics for rugby league, I looked at a statistic for rugby league called Tackle %. The aim was to quantify how often a player made a tackle during their time on the field.
As correctly pointed out in some feedback to the article, Tackle % will always skew heavily for middle forwards as they make most tackles during a game. Part of that is intended, as there are plenty of statistics to evaluate performance with the ball. Yet there’s very little to evaluate middle forwards other than some statistical buckets labelled “Tackles” or “Runs”.
However, Tackle % only covers the defensive aspect of rugby league. Runs will tell you how many times someone hit up, but not the rate. If we want to evaluate how involved a player is when their team has the ball, then the answer would be Run %.
The methodology
Hopefully Run % should be reasonably self-explanatory if you read the Tackle % article. If you didn’t, it is the estimated % of team plays where a player made a run or hit up. Team plays are calculated the same way as opponent plays were in my Tackle % article. In a nutshell it is the number of team Play The Balls plus team Kicks and team Tries. Add them together and you’ve got an estimate of the number of plays that a team had in a game, since Play The Balls alone don’t count for what happens at the end of a set.
The aim is to identify players who are contributing a high rate of runs while their team has the ball, ideally pinpointing impact forwards off the bench or outside backs that regularly bring the ball out of their own area after an opponent kick.
A note about Run % is that we’re not looking at quantifying how good a run was, just the rate that a player attempted a run. There is scope for a Run %+ metric that would take into the quality of a run by looking at total metres, pre/post contact metres or tackles busts. To simplify things, we’re just looking at how often a player took a run with the ball regardless of the outcome.
Does position matter?
Like Tackle %, comparing Run % across positions can be fraught with issues. The chart below has been updated from the previous article to include average Run % by position in the lighter shade of red, with the dark red representing tackle %.
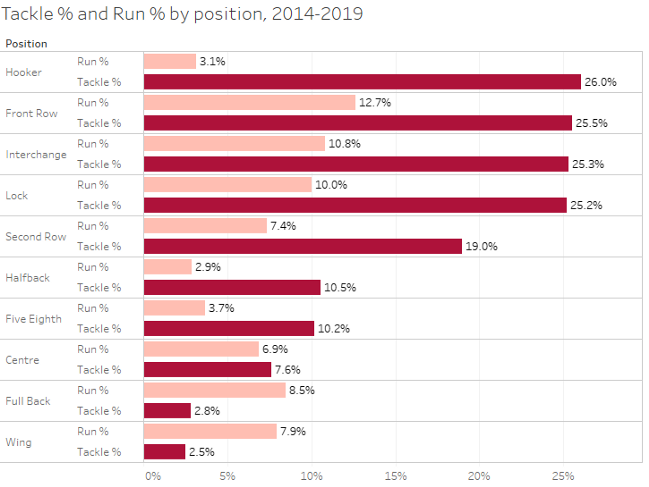
Middle forwards again fare well, with front rowers, locks and interchange players all sporting a Run % at least 10%. Unlike Tackle % though, immediately it is apparent that you can’t compare hookers with other middle forwards as you could with tackles. With creative and running dummy halves being coached out of the game, their role these days is centred around defense and distribution, and it shows with hookers having a Run % of just 3%, the second lowest of any position on the field. Other middle forwards are fair game for comparison as well interchange players, although again interchange data is skewed by utility replacements as it was for Tackle %.
There are also some new combinations that could be considered for comparison, notably centres and second rowers (both in the high 6% range), as well as fullbacks and wingers (both in the 8% range). Wingers and fullbacks make sense for comparison given the type of runs they make mentioned above.
The results
Looking at the top 20 players by Run % from 2014–2019 (see table below), as expected the top players are middle forwards.https://medium.com/media/23b360cebc8885e5756e312e9a33e577Top 20 player NRL seasons ranked by Run %, 2014–2019
David Klemmer’s 2014 ranks as one of just two seasons with a Run % higher than 18%, and he also possesses four of the top thirty performances (2014, 2015, 2016, 2018), showing that even as his minutes increased from 21 per game in 2014 to 56mpg in 2018, he still running the ball at an elite rate. It was only as his minutes crept over 60 per game during the 2017 and 2019 seasons that his Run % dipped, falling below 14% both years.
Andrew Fifita stands out as another of the heaviest workers with the ball over this period. His 2014, 2015 and 2016 seasons rank 5th, 6th and 8th respectively, all between 16.7% and 17%. That is significantly higher than the front row average of 12.7%, indicating just how often Fifita gets involved when the Sharks have possession.
Other players with multiple seasons inside the top 30 include two each from Paul Vaughan, Tom Burgess, Martin Taupau, Paul Vaughan and Tevita Pangai.
For the most recent season, the Raiders Corey Horsburgh was top of the Run % chart with a run on 16.18% of Canberra’s plays this season. That percentage equates to almost one run (0.971) per set of six tackles. Having an interchange player who can be regularly relied upon to take one hit up per set is huge benefit and ensures other middle forwards don’t have to carry all the work.
The next two spots for 2019 were taken up by Melbourne forwards — Christian Welch with 15.64% and Nelson Asofa-Solomona with 15.32%. No surprises to see Welch or Daniel Alvaro inside the top 20, as they are always looking for work no matter who has possession.
Whilst the above three players rank first, second and third by Run %, they only rank 108th, 153rd and 25th by volume of runs. By using Run %, we’ve quantified the involvement of these players and showed why they are so valuable to their teams despite playing limited minutes. To highlight the disparity between volume and rate for runs, only Taupau ranks in the top 10 for both volume (6th) and Run % (4th).
Is there a difference between starting and interchange players?
Another advantage of using examining Run % data is that it highlights differences between starting on the field or on the interchange bench can affect a player’s performance.
A great example of this is Andrew Fifita’s 2019 season. Fifita has historically had one of the highest Run % in the NRL over the past six seasons, as shown above with three of the top ten spots over that period. But his 2019 season was not spectacular due to injury and suspensions, posting his lowest Run % in years at just 14.14%. Eventually he was benched in Round 20 in the hopes of igniting some fire under him. The results of his 2019 season are below, with the final column showing the % difference from the average player at each position.https://medium.com/media/1db0aeead4d8f17070274e76dce80050Position comparisons ranked by Run % for Andrew Fifita for the 2019 NRL season
It looks to have worked well. In those four games off the bench his run rate increased by over 4% to 18.90%, which is 43% higher than the average interchange player. It would also be the third highest Run % by any interchange player from 2014–2019 (with at least four games played).
Granted this is a small sample size of games, but does show how the switch to the bench forced Fifita to lift his involvement and earn his spot back in the starting line-up for Round 25.
The flip side of this is that you can also identify players who put in the same amount of work regardless of where they start the game. Below are the Run % stats for Tevita Tatola and Moeaki Fotuaika, both of whom had excellent 2019 seasons yet had minimal differences in their Run % whether they were starting or used as an interchange player.https://medium.com/media/d232065a8912da0139319be316b34c28Position comparisons ranked by Run % for Moeaki Fotuaika and Tevita Tatola for the 2019 NRL season
Tatola had less than a 0.5% variance between starting and coming off the bench last season, and was slightly below average when he started at prop. The difference for Fotuaika was just 0.2% higher when he was used as an interchange player and was above average when starting in either position. It’s not hard to see why he’s one of the few Titans that would be desirable by other NRL clubs.
Comparisons within positions
Like Tackle %, we can hone in on a signle position to spot players who are performing above or below the average. One player who stood out after looking at this data was Ryan Papenhuyzen. The Storm fullback was a rising star in 2019, and part of the reason was how often he looked to make something happen with the ball.
Below are the top ten full backs for 2019 who played at least four games. You can see from the last column that Papenhuyzen was nearly 40% ahead of the average fullback last season, again highlighting how often he was looking to get involved.https://medium.com/media/e5b6a9a40377836a19afc98475d6a210Top 10 full backs ranked by Run % for 2019 (min four games played)
Delving deeper into the six games he started in the #1 jersey for Melbourne, not only did he have the highest Run % of any fullback by a wide margin (over 2% ahead of second placed Roger Tuivasa-Sheck), his 14.11% ranked him 29th of all NRL players for the season. No that is not a misprint. Some notable players that Papenhuyzen had a higher Run % than include Payne Haas, David Klemmer, Jason Taumalolo and Addin Fonua-Blake.
Keep in mind this isn’t including any of his games off the interchange bench where he was rotated through the middle of the field, this is purely the games he started at fullback. He was also only one of two non-forwards in the top 100 for Run %, the other being the Warriors Ken Maumalo (12.77%) who also had a breakthrough season of his own. Maumalo’s 12.77% was the second highest Run % by a winger (playing a minimum of four games) in the past six seasons, only trailing Blake Ferguson’s 13.05% during his breakout 2018 season with the Roosters.
Not only can we identify high involvement outside backs, but we can also see those who aren’t contributing as much. Eels fans could tell you how little Bevan French would get involved unless the ball was close to the try line. And it shows, with French owning three worst seasons below an average winger (again a minimum of four games). His 2016, 2017 and 2018 seasons were all at least 80% below the average. Souths’ Corey Allen took that nod in 2019, running the ball 57% less than the average winger in his ten games at that position last season. Not the sort of results a pack of tired forwards would like to see.
The downside with using Run % is comparing utility interchange players against the average. For example, when Ben Barba played 11 games off the bench for the Sharks in 2015, his Run % was 73% below the average interchange player. This is due to his minutes as his performance was largely being compared against middle forwards. Granted, this was also a problem with Tackle %, and would only be alleviated by reclassifying utility interchange players into their actual on field positions.
As with shown Tackle %, there’s a void in rugby league statistical analysis that looks at rates or incidences of actions occurring, with almost all metrics looking at volume only. The eye test will tell you that Andrew Fifita did lift his effort when benched this season, but previously there is was no way of quantifying it. This is partially solved with Run %, as we can now see just how often a player makes a run when their team has the ball. And now involvement with the ball is quantifiable, along with defensive involvement, it is possible to combine both sides of the game and look at a more wholistic view of player involvement. But I’ll save that for next time.
If you enjoyed this post please consider supporting The Rugby League Eye Test through one of the links below.
Scan the QR code or copy the address below into your wallet to send some Bitcoin to support the site Scan the QR code or copy the address below into your wallet to send some Ethereum to support the site Scan the QR code or copy the address below into your wallet to send some Litecoin to support the site Scan the QR code or copy the address below into your wallet to send some Bitcoin cash to support the site Select a wallet to accept donation in ETH BNB BUSD etc.. Donate To Address
 Donate Via Wallets Bitcoin
 Ethereum
 Litecoin
 Bitcoin cash
Support The Rugby League Eye Test
Support The Rugby League Eye Test
Support The Rugby League Eye Test
Support The Rugby League Eye Test
Donate Via Wallets


