It’s hard to believe we’re already one month into the NRL season. It feels like only yesterday we were all laughing about the escort advertising behind Buzz on NRL 360, but it’s been four rounds and five weekends since the opening weekend in Las Vegas.
Over that month we’ve had plenty of upsets, some incredible finishes and even more impressively the game has continued to build on the momentum created by the Vegas launch. Round 4 culminated with topped off by a thrilling one point victory by the Tigers over the Eels yesterday, which topped off a record round for crowds.
The Eels loss is a tough one for Parra fans, and we’ll delve into some of their numbers later. The expected point chart from this match highlights how dominant they were early.
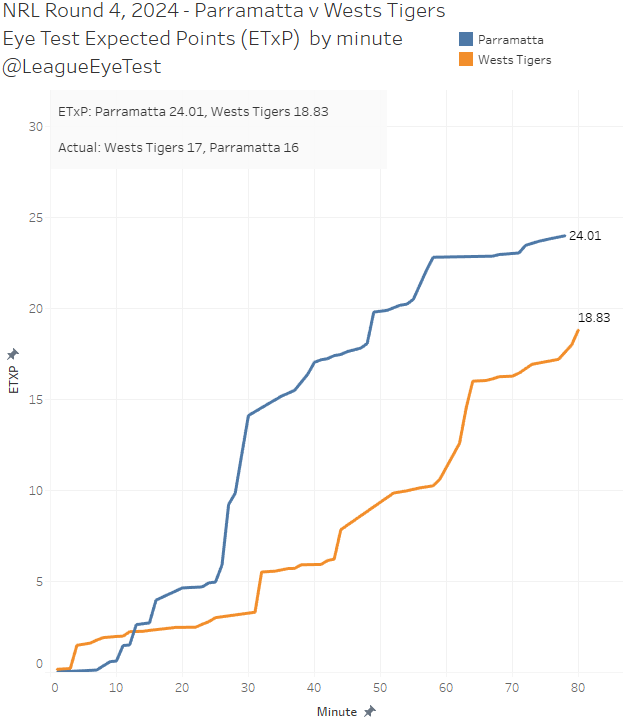
Parramatta had enough possession to be ahead on expected points by 17.05 to 5.94 at half time, and were only able to add on seven more points worth of possession after the long break. They kept the door ajar just long enough for the Tigers to claw their way back into it. It’s another performance that is making Benji Marshall’s modern coaching methods look incredibly successful for a club that hasn’t seen any of it recently.
Having an even and somewhat unpredictable competition has certainly helped continue the early season momentum. For the first time since 2016, there isn’t have an unbeaten side heading into Round 5. The last time that happened there were five teams with a 3-1 record after four matches. Eventual grand finalists Melbourne were one of those teams, but interestingly the team that beat them for the premiership were not, as the Sharks started 2-2.
A month of the season passing also means it’s time for the Eye Test to bring back its monthly efficiency updates. For new readers, at the end of each month I look back and compare each teams expected point outcomes with their actual on field scoring results.
If you’re not aware of this site’s expected point metric, there’s a full explainer on the site. The quick version is that each play the ball location has a point value associated to it based on probability of scoring a try on each particular tackle number. Sum up the value of every play for each team and you get an expected score, which would be what an average team scored from the same field position and possession.
Comparing expected points with actual points is a useful way to see which teams are (or aren’t) efficient with the ball, and which sides are (or aren’t) performing well defensively. Later in the season I’ll focus on one or two teams from these charts and dive deeper into what is making them so successful or why they’re under performing. But with just four games played for most of the competition, I’m just going to focus on some of the bigger trends for now until we get some more data points.
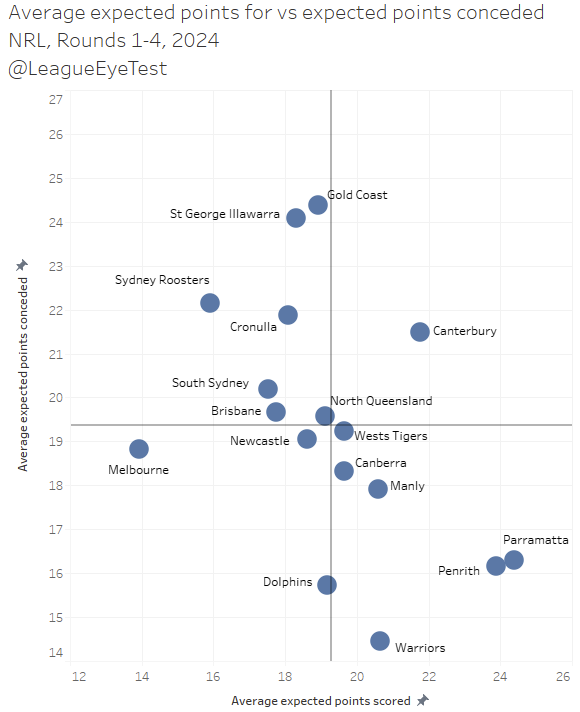
To start things off, we look at a plot of average points scored versus average points conceded from the first month of the season. We’re looking at averages here because until Round 27 we won’t have everyone on the same number of games. Here’s how each team stands after the first month of the season. Teams conceding more points will be higher on this chart, and teams scoring more points will be further to the right.
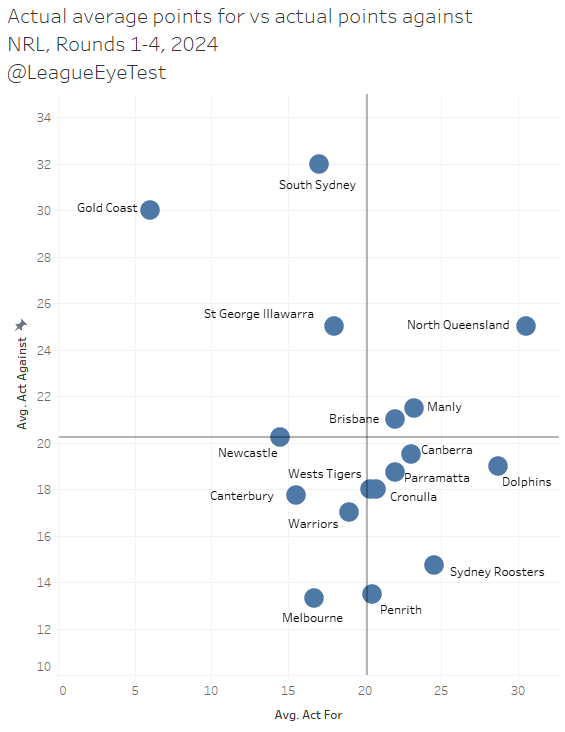
A few things stand out on this chart. Firstly, there’s been three standout teams defensively thus far, all allowing fewer than 15 points per game – Melbourne, Penrith and the Roosters. After that there’s a glut of teams in the middle, all allowing between 16 and 22 points per game (the Y axis)
Then there’s the four teams that have been quite poor defensively, all leaking more than 25 points per game. Some of those would be obvious like South Sydney and the Gold Coast, and to a lesser extent the Dragons. The Cowboys were somewhat surprising to see here given they’re 3-1 and sit third on the ladder. But they’ve conceded 100 points in four games, and even in their wins they’ve allowed 18, 21 and 24 points along with the 38 points the Broncos scored on them Friday night.
North Queensland are leading the competition in points scored, with 122 in four games for an average of 30.5. The Dolphins have shown they can cross the line too, averaging nearly 29 per game. After these two, there’s a tier of sides averaging more than league average at 20-25 per game led by the Roosters at 24.5. Then there’s another tier below that averaging less than league average, between 14 and 19 points per game, of which Melbourne are the only one inside the top eight.
And then there’s the Gold Coast, out on an island with their own level of ineptitude, averaging just six points from three games this season, which is largely being propped up by the 14 they scored in Round 4 after accumulating just eight in their first two outings.
Given we know what the actual performance has been like scoring wise, next up we look at their expected points accrued compared with their expected points yielded. It’s a good way to look at how much high point value field position teams are using or conceding. Here’s the expected point plot from the first month. Again, higher on the Y axis is bad defensively, and further to the right on the X axis is higher scoring.
There’s a few quick takeaways on this chart. Penrith and Parramatta have very similar expected point profiles – both scoring around 24 expected points per game but only conceding around 16 per contest. This indicates that not only have they been able to push the ball into high point value areas of the field, but they’ve also been able to limit their opponents to lower value field position. Both are usually good indicators of teams that are successful, at least during the regular season.
Any thought that the Warriors would drop of defensively seems amiss, as they’re allowed the fewest expected points per game this season at just 14.5 per game. That’s even lower than Penrith from the same period last year, who allowed just 15.8 per game. It’s early days but the Warriors defense has carried over this season so far, and they’d have to be considered one of the top contenders for the 2024 premiership.
Melbourne is struggling with field position after three games, only amassing 13.9 expected points per game. Part of this is how difficult their set starts have been. Of all NRL clubs, they have the worst average metres downfield on tackle one in the competition, by a whopping four metres.
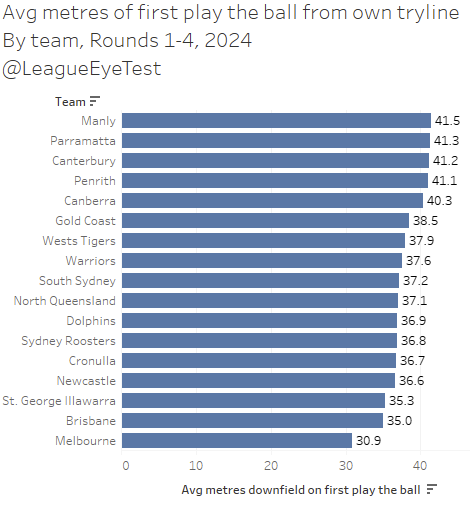
Their first play the ball occurs just 31 metres out, over four metres worse than the 16th placed Broncos at 35 metres. That Melbourne are struggling with field position isn’t surprising given the injury issues they’re dealing with in key positions, and they’ve been able to secure wins despite this under performance. It bodes well for later in the season when they do have all of their playmakers available, and with Cameron Munster likely to be named this week that could start in Round 5.
Back to expected points conceded, the Titans and Dragons again look well below average defensively, and the Dragons result is probably worse than it looks given that they were able to pad their record with a 28-4 victory over those Titans.
Much has been made of the Dogs improved defense, and it’s largely true. However, the expected point chart above doesn’t necessarily show that. Their 21.5 expected points yielded per game is up on last year (18.7), but they’ve nearly halved their actual points conceded. If they can fix their issues with the ball (we’ll get to that later), they should be able to stay out of the bottom four.
Now we’ve established the actual and expected performances per team, we can check how teams are executing compared to their expected points compared with their actual for and against. First up we compare expected points gained versus actual points score, as a percentage above or below, to get an idea of efficiency in attack (a reminder here that higher is better).
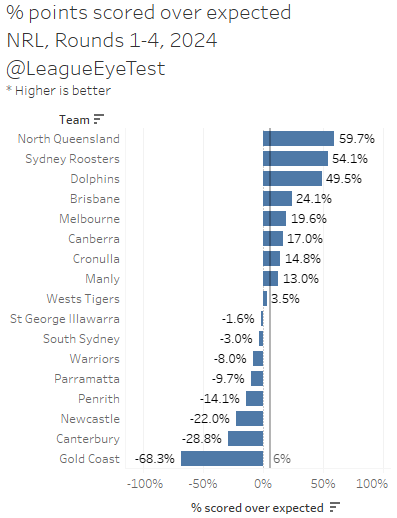
North Queensland are leading the league, scoring nearly 60% of points above their expected points, which is what an average team would accomplish given the same field position and possession. The Roosters, who possess the best point differential in the NRL and Dolphins (who are first on the ladder) are also hovering around 50% above average, indicating they’re the most efficient sides with the ball this season, not needing a lot of possession close to the line to score points. League average after four rounds is +6% over expected, which nine teams have surpassed.
On the other end, the Titans are at an eye watering 68% below expected with the ball, scoring over two thirds fewer points than an average team would in the same situation. I’m not sure how well a spray from Des is going to work but they probably can’t get much worse. This certainly can’t be the first month that Steve Mitchell envisioned when he signed Hasler. As maligned as Justin Holbrook was, at least they showed up for part of a game. Hasler’s Titans are barely showing up.
Canterbury’s issues getting across the line are seen here too, as they are scoring 28% fewer points than expected, with Newcastle also struggling to post points at -22% below expected.
Now we look at expected points conceded versus actual points conceded, again as a percentage, to get an idea of how strong a teams defense is. Again, a reminder that lower is better for this chart.
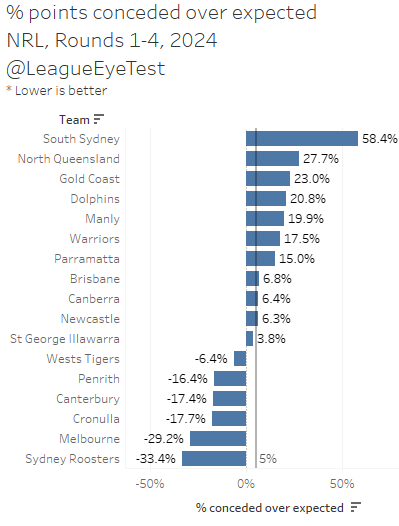
And here’s where we get some firm numbers on just how dreadful South’s defense has been, allowing 58% more points than expected. This means they’re allowing significantly more points than an average team would from the same field position, which usually indicates they’re giving up points from low expected value situations. They’re the only team giving up more than 30% more points than expected, and even the awful Titans are only conceding +23%.
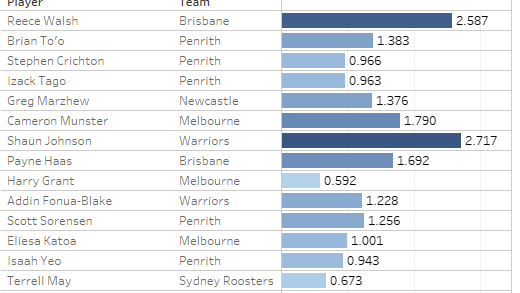
What compounds these issues for South Sydney is their inability to control the ball. Their error rate this season (average number of touches per error committed) is atrocious and has been since last season. Below is the error rate of every team this season, sorted by errors per possession.
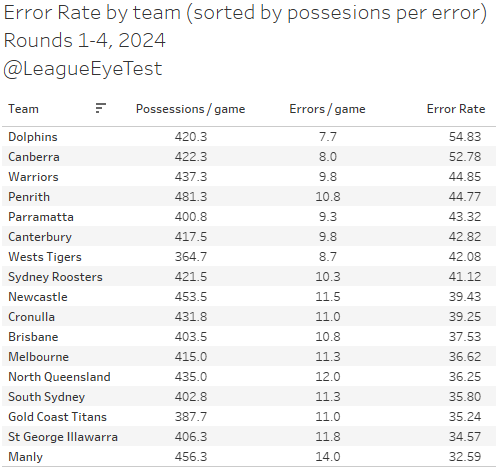
Souths are averaging an error once every 36 touches, only ahead of the Titans, Dragons and Sea Eagles. Last season they were also third last with one error every 37 touches, and in 2022 they were dead last at one every 34 touches. They’re almost 20 touches worse than the top team in the competition this season THE Dolphins at an error every 55 receipts.
Surprisingly none of their issues were fixed by dropping Lachlan Ilias. If they can hold the ball and be gifted good field position, then they can be dangerous. But with a slow, immobile and old pack and a back three who look allergic to gaining metres coming out of their own area, it’s hard to see where things turn around this season for the Rabbitohs.
Canterbury’s improvement on defense here is plains as day, allowing 17% fewer points than expected. Last year that number was +8% above expected after four rounds, placing them in the bottom half of the competition before ballooning to +70% by the end of the season, which was last by multiple lengths. The focus on defense seems to be clearly paying off for the Dogs in 2024, especially if you’re like me and tend to focus on processes and not necessarily results.
North Queensland’s Jekyll and Hyde start to the season is evident again, with the second worst points over expected conceded at +28%. Being able to outscore inferior opponents without worrying about your defense is a fine recipe for regular season success but won’t get you far in September. Just ask the Sharks.
The issue with both charts is that they’re lacking the context of the expected points. There’s no indication of how much high point value field position a team has had, which makes the percentage above (or below) expected less meaningful.
For example, Penrith are 14% below their expected point total, which seems counter intuitive considering they scored 26 on the Eels, 34 on the Broncos and 22 on the Roosters. Yes, they’re scoring less than expected, but you’re not seeing the high volume of field position they have had.
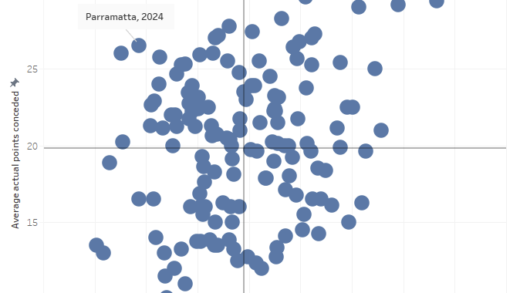
To solve that problem, if we compare the average expected points gained versus average actual points scored, we can plot these into a chart with four distinct quadrants. This is based on them being above or below the average expected and actual points per game for the season thus far.
- Dominant – high expected points, high actual points
- Efficient/lucky – low expected points, high actual points
- Inefficient/unlucky – high expected points, low actual points
- Incompetent – low expected points, low actual points
As noted earlier, I’ve added the “lucky” and “unlucky” labels to the efficient and inefficient quadrants as one bad game or a few bombed tries could move a team from efficient/lucky to inefficient/unlucky, especially early in the season. Again, it’s very early in the season and the sample sizes aren’t robust enough yet to get more than an indication of how teams are traveling.
This new chart gives us similar information to the percentage above expected charts we saw previously, but with the added context of just how much quality field position each team has, or in the case of Melbourne, has not.
First up, here’s average expected points compared with average actual points scored, with each quadrant of the chart labelled appropriately.
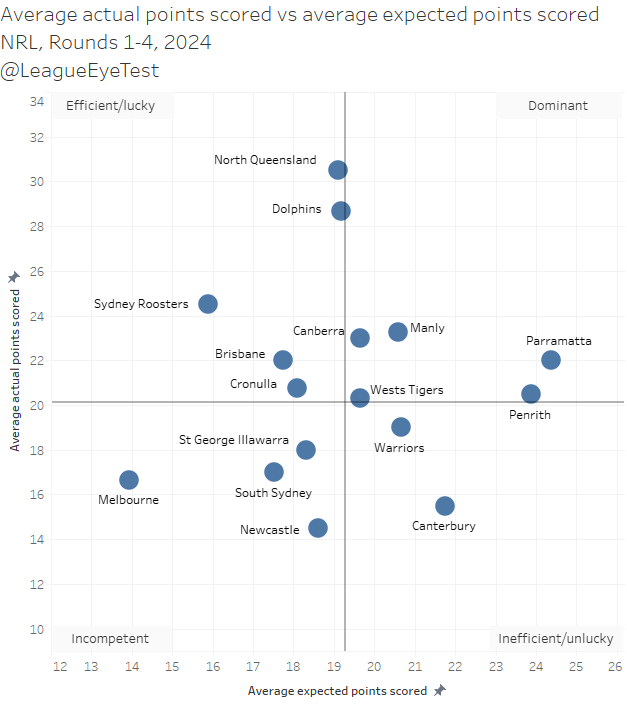
Here’s that much needed context. The Eels are dominating teams with the ball this season, averaging the most expected points and sixth for actual average points per game. They sit firmly alone in the ‘dominant’ quadrant, with four other teams on the boundaries – Canberra, Manly, Penrith and the Wests Tigers.
Interestingly the Panthers haven’t been quite as dominant as they have been in prior seasons, when they’d be firmly entrenched in that quadrant, on the back of mountains of high expected point value possession.
The Tigers have improved under Marshall so far, going from an incredibly inefficient team that couldn’t score despite mountains of possession inside 20 metres, to a team that has captialised on high expected point value field position. They’re still on the edge of being inefficient, but they’re much better than they have been previously.
For Parramatta to be so dominant with field position but only sit ninth on the ladder is a concern. With things going their way they could have easily been 4-0 with victories over Penrith and the Tigers, but they’re scoring 10% fewer points than an average team would with the same field position. They’re also allowing 15% more points than they should for the paltry 15 points of expected field position they concede. Clearly there’s some work to do with the Eels, but like the Broncos they’ve had key players miss time and Mitch Moses cannot be easily replaced.
Manly’s position on this chart is mainly due to their inefficient finishing against the Dragons on Saturday. The Sea Eagles had 32 tackles inside the Dragons 20 metre zone in the second half alone. The expected point chart from that game shows just how might high point value possession they had, far more than enough possession and territory in the second half to secure a victory.
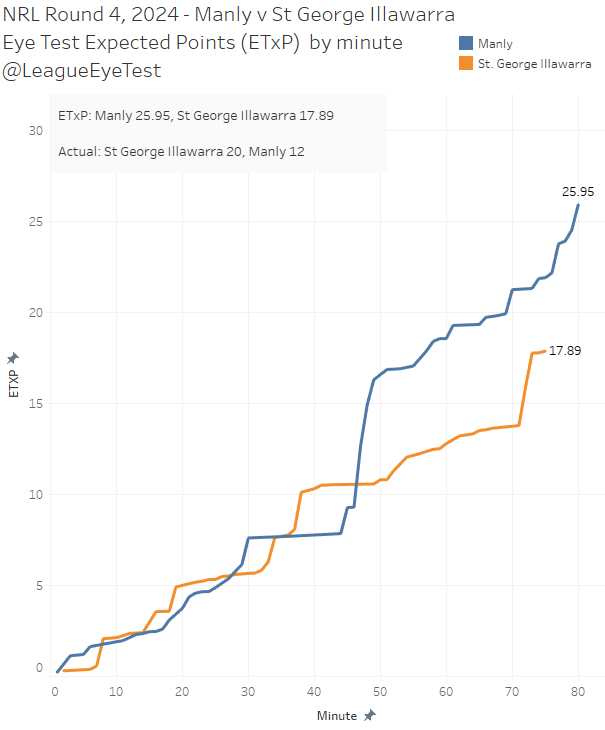
Yet from the 61% of possession and 66% of territory they had after half time, they could only break the Dragons line once, in the 77th minute through Haumole Olakau’atu. For now, I’d treat this weekend as an aberration rather than the norm for the Sea Eagles. Prior to this week they were sitting firmly in the efficient attack quadrant with the Roosters and Dolphins, and that’s where I’d expect them to be for most of the season given their ability to score long range tries.
The efficient/lucky quadrant contains most of the usual suspects who can post points quickly from low expected point value areas due to their creativity and speed. Most notably sitting here are the Roosters, Broncos and Cowboys, with the Sharks and Dolphins creeping in as well. The Dolphins ability to put on points, as well as control opponent field position could make them a sneaky top eight pick. However their three matches have been against the Titans, Dragons and Cowboys, who as we’ve seen are leaking points more than most of the league. For now Fins are up though.
Flipping down to the inefficient/unlucky quadrant we have just two occupants – the Warriors and Canterbury. As noted above, the Warriors ability to restrict field position allows them to be less efficient with the ball. They’re not that far below league average in actual points scored, and a few higher scoring games (they’ve only bested 20 once this season) would push them into dominant territory.
As noted above, the Dogs difficulty troubling the scorekeeper can be seen here. Possibly having 12 utilities and a half who loves to kick bombs above all else isn’t the most efficient form of attack. Not giving your best attacking player in Stephen Crichton more touches, especially early in sets, might be an issue too. But they’re clearly in a better state than they were twelve months ago and as usual, friend of the site Jason Oliver of Rugby League Writers has a great breakdown of how they’re structuring their attack.
Like Manly they dominated second half possession, with 31 play the balls inside the Bunnies 20 metre zone, with nothing but a last minute try to Connor Tracey to show for it. The expected point chart form their loss to Souths has plenty of similarities to the Sea Eagles one above.
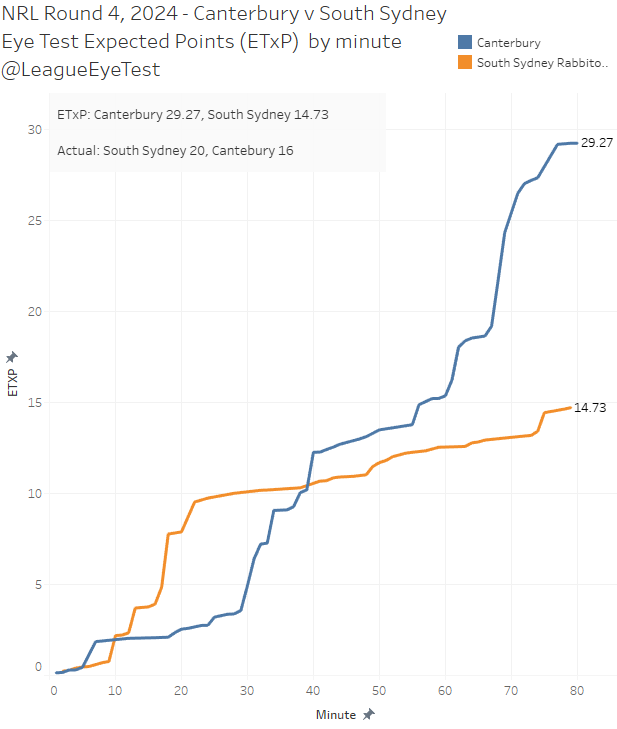
Still, at least they are generating relatively good field position, which is more than you can say for the Dean Pay snoozefests of the late 2010s. Progress isn’t always linear, and it’s far easier to fix a wonky attack during the season than plug a leaky defense, the latter of which the Dogs seem to have improved on from their 2023 campaign as we’ll see shortly.
Lastly for the attacking chart we have the incompetent quadrant, somewhat unfairly led by the Storm, for all the reasons mentioned above. I don’t put their attack issues on the same level as the Dragons or Bunnies, who look either old and or slow, or the Knights who look disjointed and need to find a spark to save their season.
And to finish up this week, here’s the plot of average actual points conceded (Y axis) against the average expected points conceded (X axis) per team.
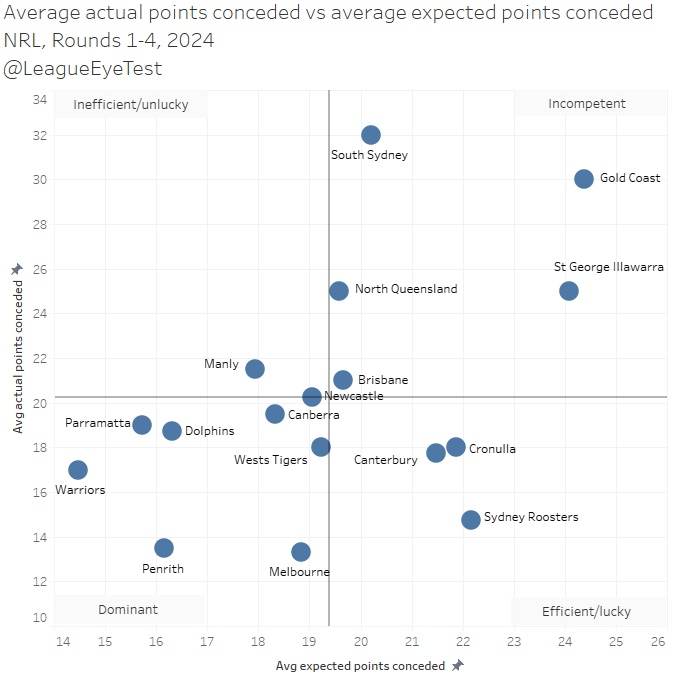
There’s only one inefficient team defensively – Manly – which is why I’m a little more bullish on their end of season chances than the Dragons game would imply. This quadrant is usually empty anyway, as it’s rare for teams to give up a lot of points and low expected value field position.
For the incompetent quadrant, we have the four suspects seen before in Souths, the Gold Coast, St George Illawarra and North Queensland. Even if you’re successful like the Cowboys have been, these sort of results aren’t usually sustainable and their next three results against the Eels, Sharks and Panthers should tell us more about their chances in 2024.
Brisbane actually sit in this incompetent quadrant by small margin, but with the injury problems they’ve had so far this season I’m not putting much stock in any of their trends until their lineup has been more stable. Their depth isn’t the same this year but the top third of their list is almost one of the best in the competition, if they can get them all on the park at the same time.
Again the Tigers have improved here, straddling the line between dominant and efficient/unlucky, which is a very un-Tigers like place to be based on their last decade. It’s early days but hopefully they can continue the types of performances we saw against the Eels.
The efficient/lucky defensive quadrant contains the Sharks and Roosters, as well as Canterbury. These teams are conceding a lot of high value field position but aren’t giving up subsequent points from that opponent possession. Brisbane and the Warriors were firmly inhabiting this quadrant last season, if you want to understand the type of defense being played.
Lastly the dominant quadrant in defense is led by the consistent Panthers, as well as the Warriors and Storm, who have been able to overcome their anemic offense by stonewalling their opponents. Their heat map of opponent play the balls shows just how well they’re controlling field position.
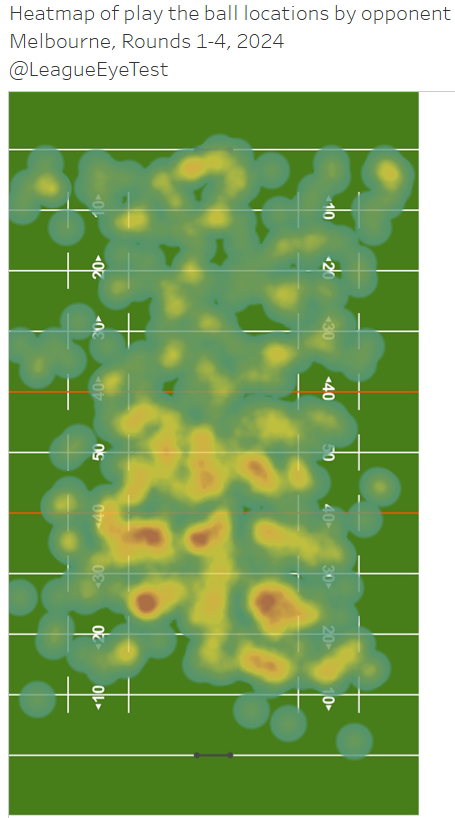
The vast majority of play the balls for teams facing the Storm have been played inside their own half, and mostly between the tram tracks. It’s very similar to the heat map of teams that face Penrith. There’s been very few times Melbourne has had to defend their own try line for long periods, which as mentioned above is the reason they’ve been able to stay in the top four without putting points on the board.