Could the Canberra Raiders be a smokey for a top four spot in 2024?
That would seem utterly insane considering their difficulty in beating the NRL’s only winless team on Sunday evening. However, I’ve got some numbers that say they might be.
Before you close the tab and think I’ve lost the plot, please at least hear me out. It sounds unlikely but all I’m asking is for you to read through the analysis below before disagreeing. It might not be as crazy as it sounds.
There’s some data provided below from their performances this season that suggest they have a high probability of ending up a top four side, which is remarkable when they were considered for the spoon by numerous parts of the media. We’re learning in 2024 that speed and width are lethal in the NRL, and the Raiders have plenty of the former and are using it with the latter.
I’d been impressed with how well Canberra had been playing given expectations, but hadn’t really entertained any thought of them playing finals football. After running the numbers post Round 6, one thing stood out to me which caused me to dig a little deeper and revise that assumption.
We’re about one quarter of the way through the season and we’re starting to see performances that are representative of what teams actually are. At this point in the previous two seasons I’d identified the Cowboys (2022) and Warriors (2023) as two teams that had improved significantly in key statistical areas in the first quarter of the season.
The Cowboys 2022 started out tremendously but that turned out to be a complete aberration which may have been helped by a soft draw. After finishing third, they needed a last minute try to beat the Sharks in week one of the finals and then bundled out by eventual grand finalists Parramatta six days later. Still, it was a testament to Todd Payten that they were able to over achieve that year and end up in the top four.
The Warriors tipped for mediocrity in 2023, yet were excellent defensively early on (as noted on this site), comfortably finished in the top four, and ended up one game away from a grand final. Coach Andrew Webster completely changed the fortunes of the club and that success has carried into 2024.
Every year there’s usually one team that overachieves, often early in the season. It’s thought that their form isn’t sustainable, but it turns out being accurate and they end up in the top eight against all expectations.
This year, the Raiders are looking like that team.
Circling back to Sunday night’s game, I had promised The Sportress’ medical team that I’d keep the expected point chart for this match under lock and key for all eternity. Considering the vibes and positivity in rest of this post, I’ve gotten the green light from the Eye Test legal counsel to publish it.
Keep in mind I only run these expected point charts to 80 minutes because it’s nearly impossible for there to be a draw by expected points, which is why the chart ends at 80. Much of extra time is played between each 30-metre line anyway, so there would be minimal change to this chart as expected point values only ramp up inside 20 metres. With those caveats and warnings, here’s the chart from Sunday evenings car crash.
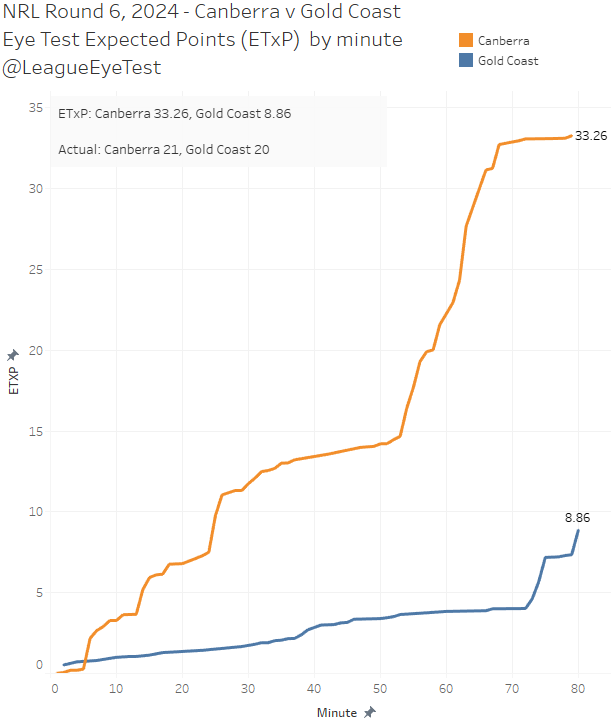
The Raiders had enough field position to win this game 33.26 to 8.86. Having 60% of possession, accumulating 600 run metres more than your opposition and using 54 tackles inside twenty metres to just eight for the Titans produces a chart like this. Which raises a few points.
The first point is that I had to change my axis for this match, which I can’t remember doing often. I usually cap it at 32 expected points (ETXP) which covers 99.9% of games – only three teams have had more than 30 expected points through six rounds this season by my model, and none have them have been higher than 30.5 previously. Well done Canberra for breaking my scale.
The second point is that the Titans had just 4.02 expected points worth of field position, up to the 72nd minute, and which they more than doubled in the last eight. Even the worst team in the league can generate points in a hurry if you give them field position.
But it did show that for 72 minutes, the Raiders were able to prevent the Gold Coast generating any high expected point value field position. Yes, the final eight minutes was a disaster, but young teams make mistakes. Hopefully this is a learning experience for them because it shows the foundations of a solid defense are there.
The third point is that Canberra only scored 20 points through the first 80 minutes of the game despite having enough field position against the Titans to score 33 points.
Despite this horror chart, according to a number of other metrics I look at, they still have the statistical profile of a quality side. There are numbers that suggest the eye test (not this one, the actual one) from Sunday’s golden point win might be misleading for the Raiders.
The main data point that stood out for me was from my defensive efficiency chart, which shows the average number of points a team allows plotted against the average expected points conceded. It’s a good way of viewing whether opponents are scoring more or less than the value of the field position they’ve had.
Good teams will sit in the bottom half of the chart, bad teams in the top half. The better teams will allow fewer points than their expected points conceded and end up in the ‘dominant’ quadrant, which is the bottom left. I’ve updated that chart after Round 6 below.
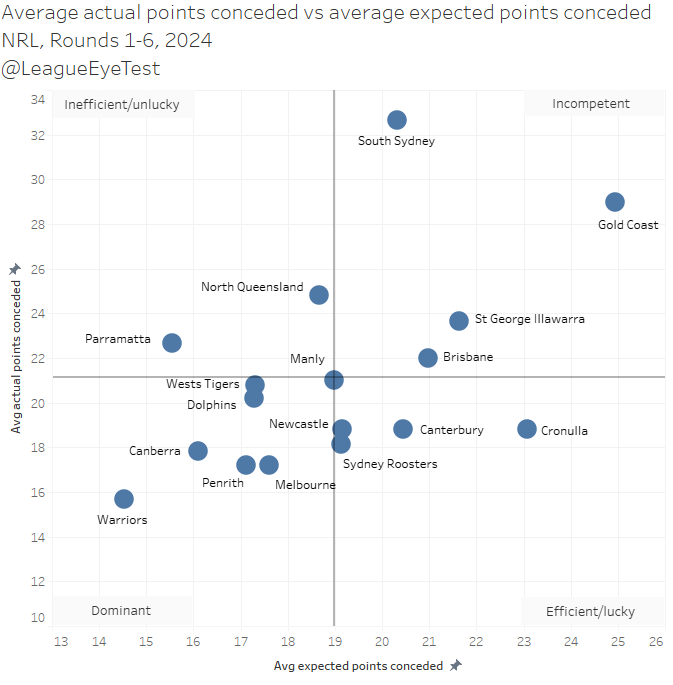
There’s four clear ‘dominant’ teams defensively after a quarter of the season. I’ve ignored the Dolphins and Tigers current position in this quadrant, as based on their current trajectory they’ll be out of it possibly by this weekend, and if not the weekend after. The clearly ‘dominant’ teams include the Warriors, Penrith and Melbourne, who make up three of those four.
The fourth one is Canberra, who allow the third fewest average expected points per game in the NRL, and the fourth fewest average actual points per game.
Why does this matter? We know that good defensive teams are more likely to be successful, especially in finals football. Additionally, a team that sits here defensively after a quarter of the season will end up with a high ladder position. As a somewhat early predictor of performance it’s appears to be quite accurate.
For those who like to mix some vibes with their data, the only other time since 2016 the Raiders were in the dominant quadrant was 2019.
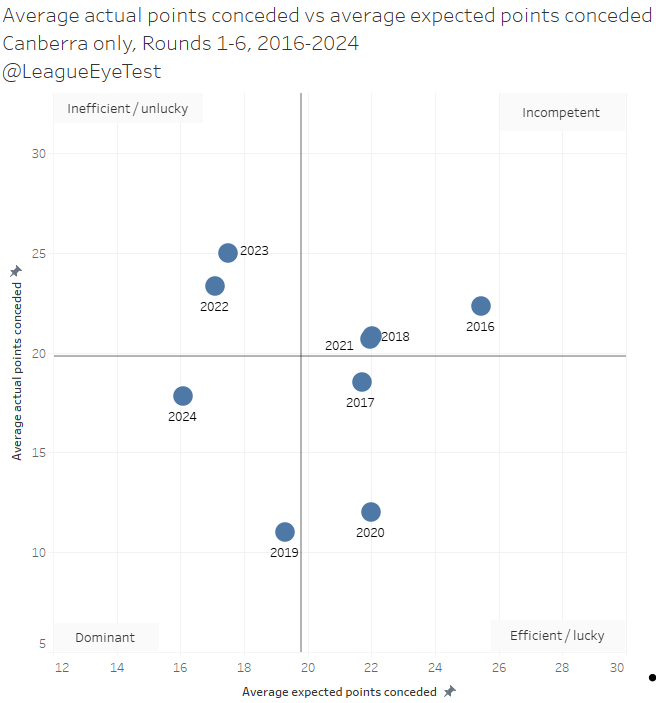
And even then they were close to efficient/lucky defensively. But they still made the grand final.
Which had me thinking, how likely is this early season performance predictive of end of season success?
Using the eight years of expected points data I have, I went back and looked at how often a team in this ‘dominant’ defensive quadrant make the top 6, top 4 or grand final.
Starting off with the big one, of 16 grand final teams in my data set, all but three of them resided in this quadrant. Nothing too surprising there, defense wins premierships more often than not. The exceptions were the 2022 Parramatta Eels, and the 2018 and 2019 Sydney Roosters. Trent Robinson coached sides are notorious for pushing discipline limits on their own goal line. Given this, it’s not a surprise that those Rooster sides were an outlier and allowed more high expected point value field position but still were successful.
Expanding that out further, teams that far entrenched in the ‘dominant’ quadrant at this point in the season usually do not miss the top eight. Of 30 teams observed clearly in the ‘dominant’ quadrant after six rounds since 2016, there were three exceptions I found going back to 2016 that failed to make the finals.
These included the capitulation of South Sydney last season, where they dropped from first after eleven rounds to ninth by Round 27, and Manly in 2022 who were trending towards a top eight spot but finished the losing their last five with Tom Trbojevic not taking the field after Round 11. The third was the 2018 Wests Tigers, which probably needs no explanation. Other than that, a team with this statistical profile usually makes the eight.
Looking at their final ladder position, a ‘dominant’ quadrant team after six rounds has approximately a 90% chance of making the top eight, 71% of making the top six and 60% of making the top four. I think Raiders fans will like those prospects. It’s a smallish sample size and I tend to think it’s on the high side for the Raiders this season given their youthful backline. But after looking at these numbers in no way would it surprise me to see them end up from 4th to 6th if they can continue this form.
North Queensland were in the ‘dominant’ quadrant in 2022 after six rounds, and ended up in third spot. As noted above, teams in this quadrant after six rounds usually end up at least in the top six. They did make the most of the soft draw that was handed to them that season.
Have Canberra had a similarly soft draw? Maybe, but you can only play who is in front of you. They triumphed over Newcastle in Round 1, and despite their 2-4 start, their numbers suggest the Knights are better side than 14th. They’ve set themselves up for an easier path to the finals, although as Raiders fans will attest, the club never does things the easy way. It’s always the Raiders way, which is the easy way but with the most difficult path imaginable.
Generally speaking, 13 wins should secure you a top eight spot, possibly 12 in a more even competition than last season, where the bottom two sides combined for just nine victories . With Canberra already having four victories, they’d need to go 9-9 from their remaining 18 matches to win 13, and 8-10 to win 12. That’s far from an unreasonable task for Ricky Stuart’s side.
They still have another game against the Tigers, two against Canterbury, two against the defensively challenged Cowboys, as well as matches against Souths and the Dragons. That could be easily 4-5 wins alone. They don’t face Penrith until Round 25, when the Panthers may have sewn up a top two spot or be short players after Origin, the perfect time to be facing them.
Canberra has already nailed the hard part by having a defense they can rely on. As noted above, they already have the fifth lowest points conceded total after five rounds with just 106 points allowed. However, every team other than the Warriors above them has already received a bye, and by average they’re the fourth best (17.8 per game).
Regular readers will know how much I prioritise sustainable defensive performances and after six games Canberra fits that bill. Ethan Strange specifically stood out to me late in the match with some quality defensive efforts that usually don’t come from 19 year old halves with less than a ten games in the top grade.
If you need some more convincing, I’ve got plenty more reasons why I’m bullish on the Raiders for 2024.
To start with, the Raiders have the fourth best starting position of any side in the league on tackle one, which occurs for them 40.6 metres out from their own line.
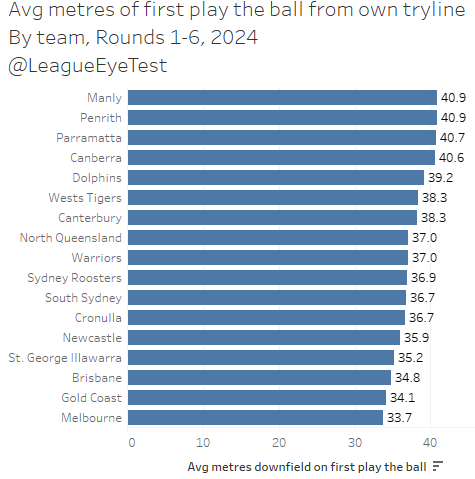
There is less than 30 centimetres separating positions one through four, and these are the only four sides who start more than 40 metres from their own goal line.
If we flip that chart around as well, we can see the Raiders are pinning opponents further back than almost any team in the NRL.
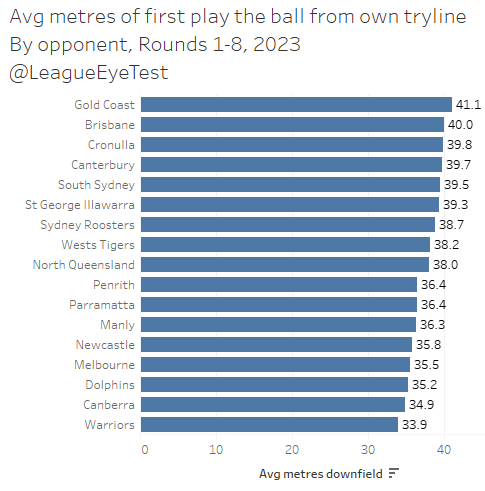
Teams facing Canberra this year are starting out 34.9 metres from their own line, second in the NRL and only behind the Warriors at 33.9 metres. The Raiders are restricting early metres and good set starts for their foes, but also initiating their sets in good field position. Both again are usually hallmarks of teams that play finals football, they’re setting themselves up for success and limiting the ramifications of bad execution.
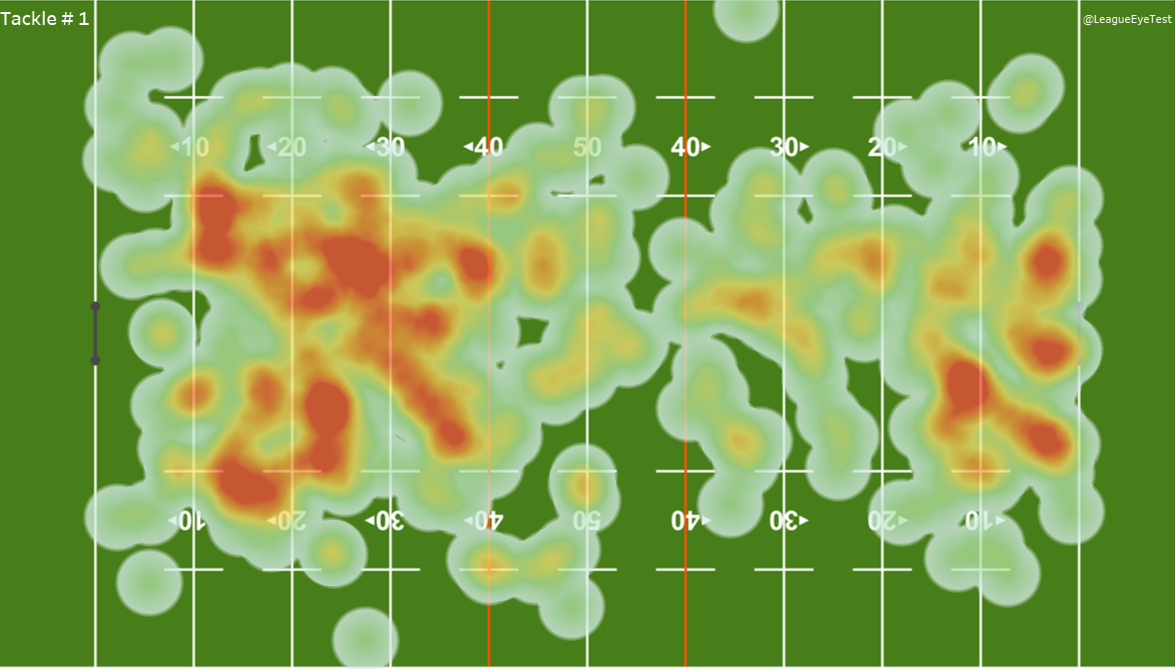
Their heat map of opponent play the balls corroborates these numbers, as you can see the high intensity spots occurring mainly in their own half, and more specifically inside 40 metres.
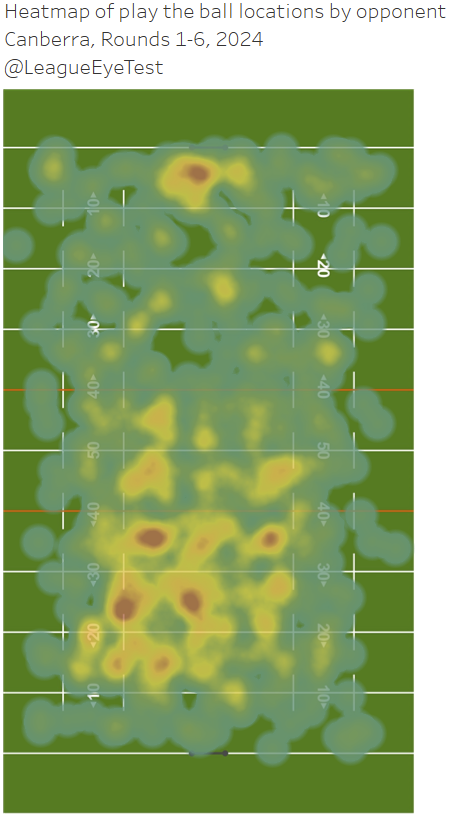
There’s very few play the balls occurring between 20-50 metres out from Canberra’s goal line, indicating they’re not letting teams get into attacking position easily. The high intensity red area in front of the Raiders goal posts is a bit concerning, but they’ve not been conceding points thus far.
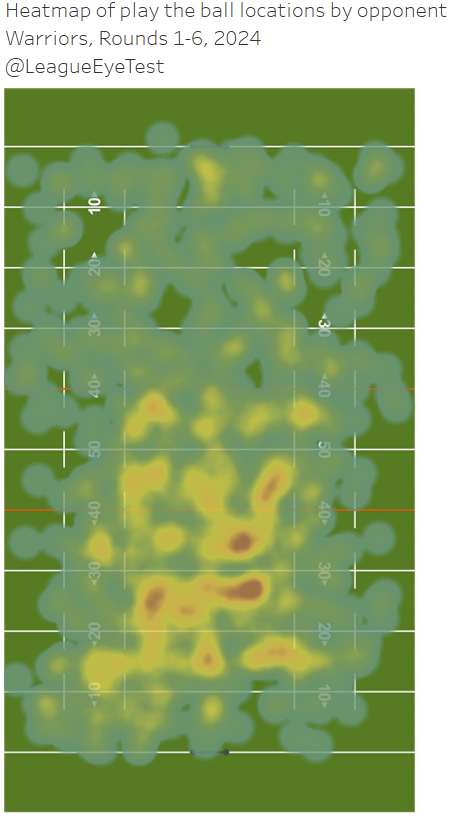
It’s not that different from the Warriors heat map of opponent play the balls, who are the best defensive side in the competition at the moment.
This control of field position has helped their margins as well, as they’ve been less likely to throw away a lead (Sunday excluded obviously).
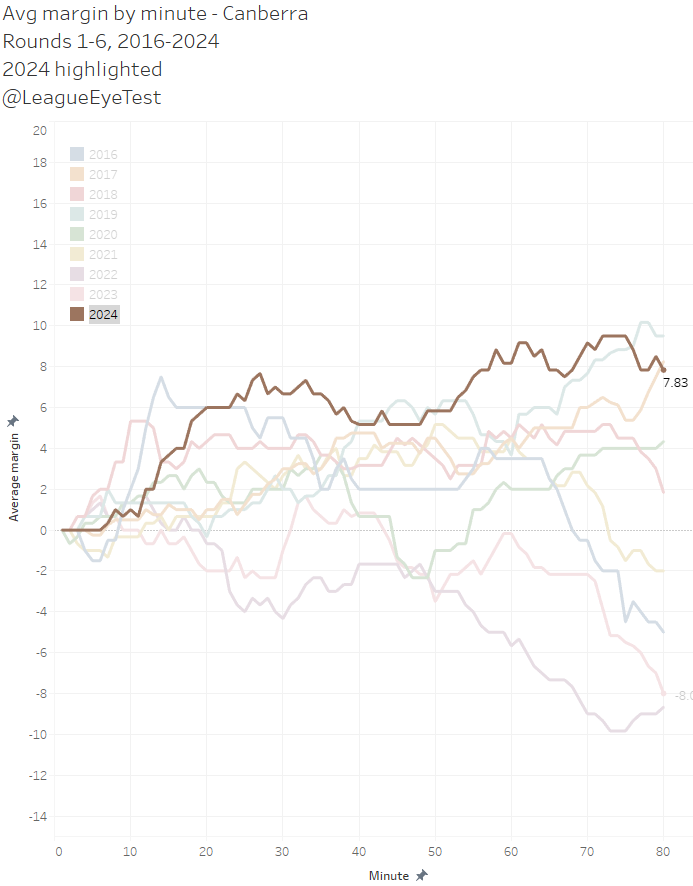
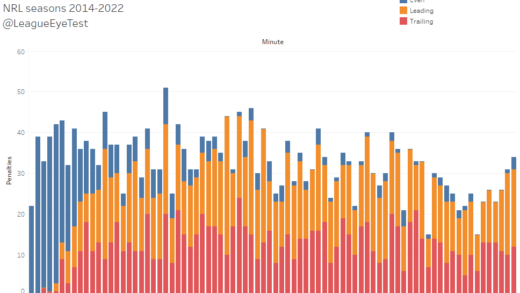
After 80 minutes Canberra is ahead on average by 7.83 points, largely by building an early lead between the 10-20 minute mark and holding that margin until the 50th minute where they make another push. This puts them on par with 2017 and slightly behind 2019 (there’s that year again…). That’s also well ahead of 2023, when they were down by an average of -8.0 at full time.
The Raiders have played 64% of minutes with a lead this season, the highest percentage in the NRL.
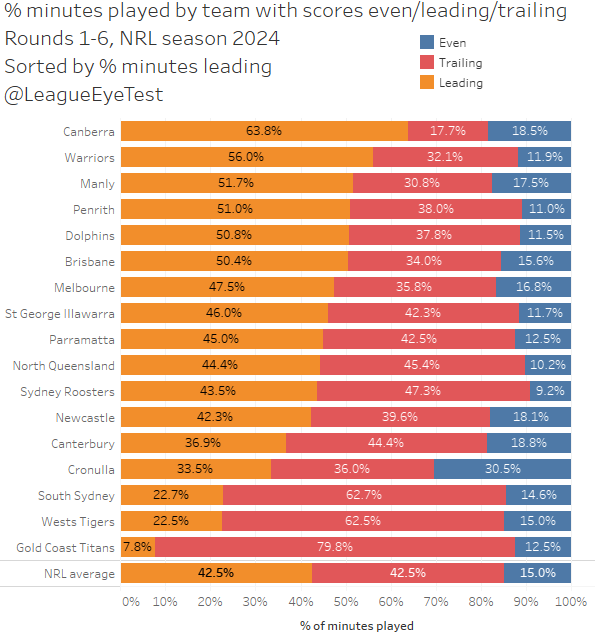
No other team is higher than 56% (Warriors), and only five other teams have played more than half their minutes ahead on the scoreboard. Interestingly, one of those teams is NOT the Cronulla Sharks, who have led in just 33.5% of minutes this season mainly due to their 32-6 loss to the Tigers in Round 3.
Earlier in the post I talked about how the Raiders were using speed and width and the next chart proves that. Below is the percentage of play the balls outside of the middle third of the field per team after six rounds.
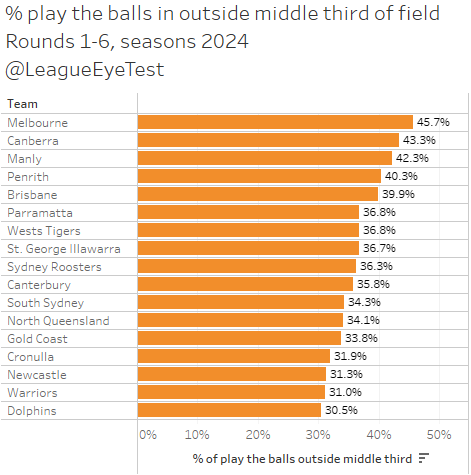
Canberra has over 43% of their play the balls occurring outside of the middle third of the field, second only to Melbourne at 43.3%, indicating they’re pushing wider more often. That’s also ahead of Manly, Penrith and Brisbane, who would be considered some of the more advanced attacking teams in the competition.
They’re also protecting the ball much better than previous seasons. Below is the error rate for every team this season, sorted by possessions or touches per error.
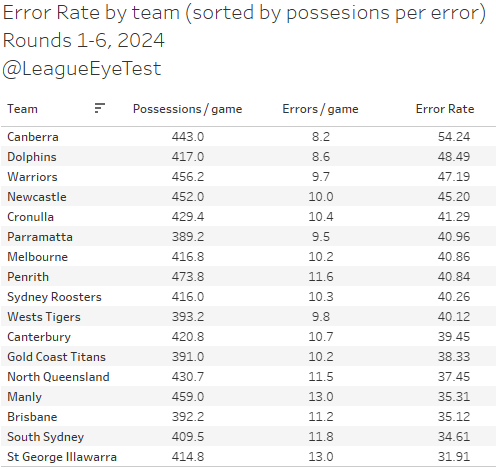
Canberra lead the league at 54 touches or receipts per error, six possessions ahead of the second placed Dolphins at 48.5. The remarkable part of this number is that the Raiders have not averaged more than 35 touches per error for the first six rounds of the past five seasons. They’re clearly handling the ball better and it’s producing results.
Halfback Jamal Fogarty has been tremendous in steering the ship around as well. He’s taken on much more of the kicking game, attempting 189% more kicks through six rounds than he did last season with the departure of Jack Wighton to South Sydney. If you compare his kicking spray charts for this year (right) and last year (left), you can see where he’s been more involved.
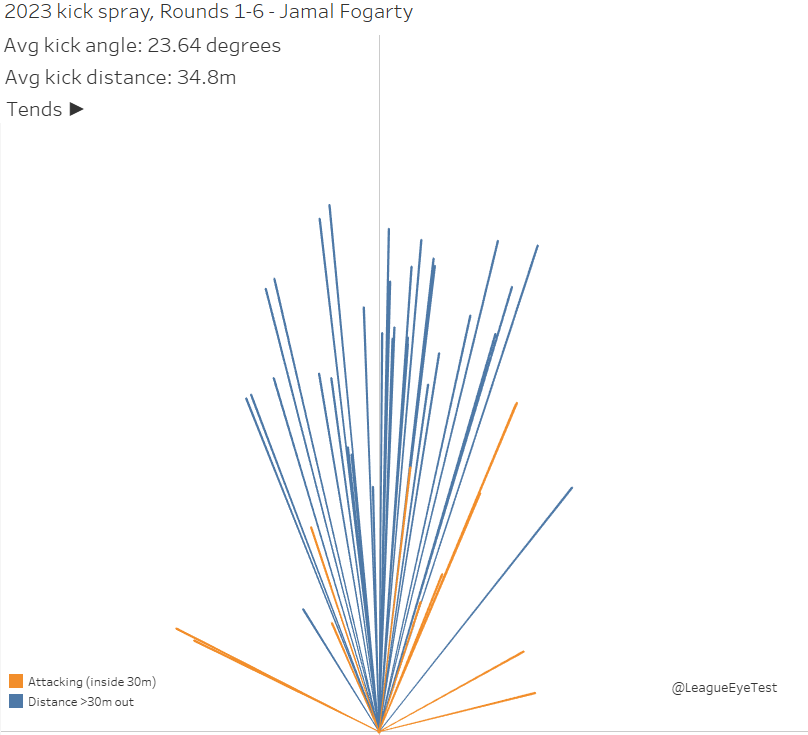
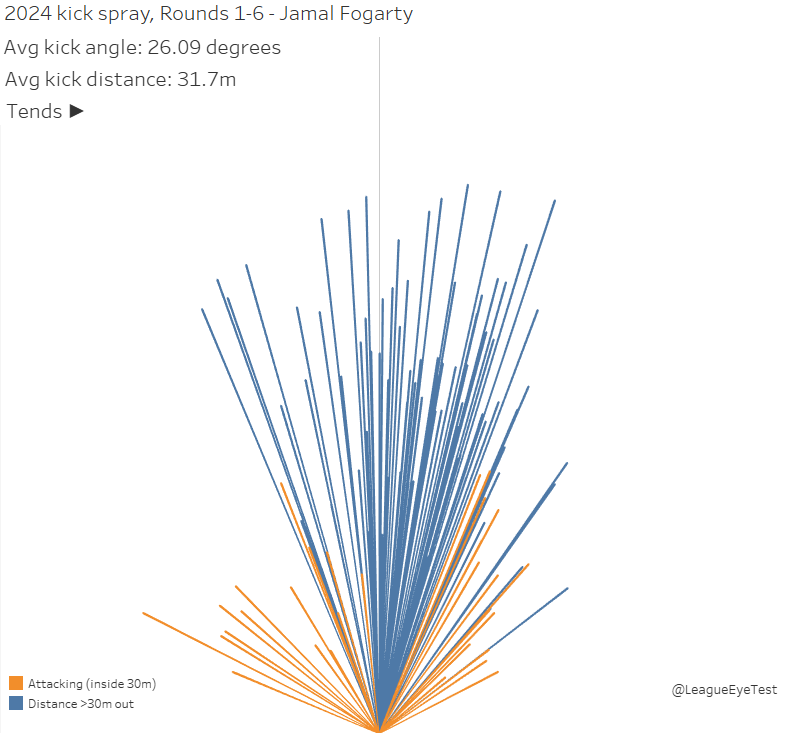
It’s not just long kicks, but shorter and wider angled attacking kicks have been a bigger part of his game this season. He’s still heavily a right-side kicker, but unlike his distance kicks, the shorter attacking kicks are headed towards either side of the field.
The other player worth mentioning is centre Matt Timoko. Regular Eye Test readers will know how well Timoko is traveling by my expected run metres model. Here’s an update for Run Metres Over Expected per run (RMOE/run) for the first six rounds.
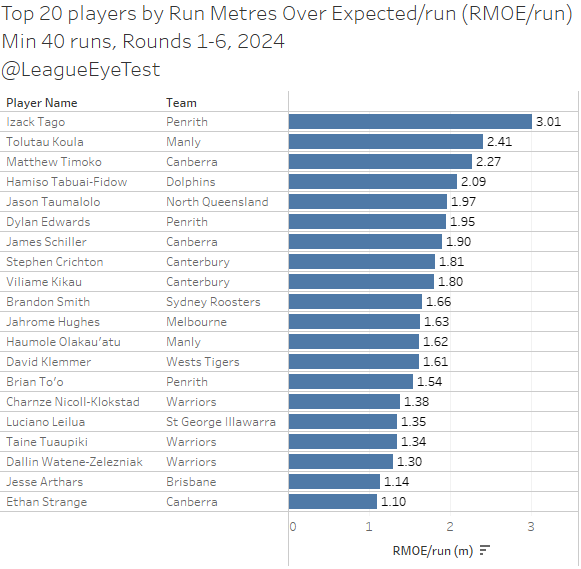
Penrith Centre Izack Tago is leading the way here, beating his expected run metres by an average of 3.01 metres per run. Manly winger Tolutau Koula is second at +2.41 RMOE/run, with Timoko third at +2.27 RMOE/run. Along with Hamiso Tabua-Fidow, these four are the only players with an RMOE/run higher than +2.0 (from a minimum of 40 runs) in 2024.
Another Raider in James Schiller places seventh at +1.90 RMOE/run, barely scraping in with 41 carries. Strange also appears here in 20th position, with an RMOE/run of +1.10, which is unusually high for a half. Jahrome Hughes is the only other half in the top 20, and along with Lachlan Galvin (+1.00 RMOE/run) are the only halves in the top 50.