If you watched both Sunday games from NRL Round 7, there’s some very obvious conclusions about the sides that played. Other than the Knights losing their 2023 identity and the Sharks running up a score against a bottom nine side at home, that is.
The first is that the long path for Cameron Ciraldo’s defensive system to pay dividends appears to finally be here. The Bulldogs commitment to defense in 2024 has been tremendous and as terrible as the Newcastle were, Canterbury didn’t let them in the match at any point.
The second is that North Queensland are easily the most unserious team in the competition this season. The Cowboys look like they’d rather be doing anything but making a tackle or defending as a cohesive unit, and are far more interested with outscoring opponents and making business decisions when they don’t have the ball.
Defense is primarily about the right attitude and effort, and the Cowboys couldn’t have shown any less of either against Cronulla. Two seasons ago I identified how well the Cowboys were playing early in the season, noting their defense was improved. They were able to defend small leads long enough to pile on the points late.
Less than two years later and the opposite is now true. Once North Queensland get behind on the scoreboard, they’re unable to apply themselves defensively to stop the bloodletting.
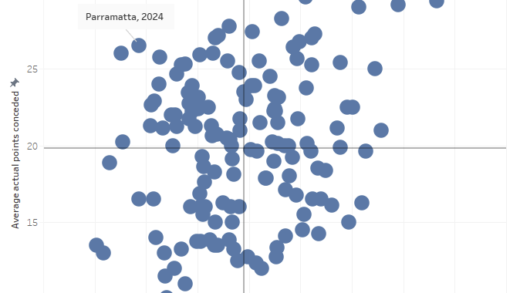
Watching the crippled Dolphins put away Parramatta (and probably their 2024 hopes) in Darwin raises a number of questions as to how the Cowboys lost 27-20 to basically the same side a week earlier. If you’re unable to beat that Parramatta side, just how serious are you?
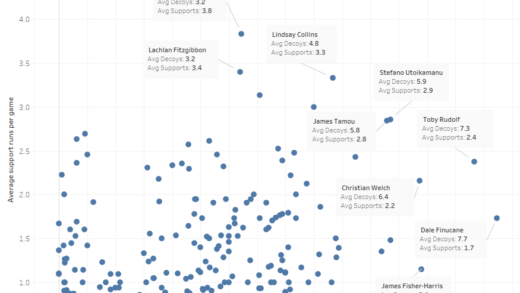
The Bulldogs and Cowboys couldn’t be more different defensively this season. Looking at points allowed per game, Canterbury are only allowing 17.9 points per game, which is a similar average to the Roosters and Warriors, and their mark is fifth best in the NRL. The Cowboys are allowing 27.3 per game, third worst in the NRL, however they restrict opponents to better field position than the Dogs, which sounds better but is actually far worse. We’ll delve deeper into these numbers shortly.
So, which of these two teams am I focusing on this week?
The answer is yes. Usually, I’d pick a single team for one of these deep dives, but rather than my usual approach of analysing each team separately, I’m going to deconstruct both sides to compare and contrast them. The first ever Eye Test team deep dive double header.
When looking through the numbers, there’s some things the Cowboys do very well that the Dogs don’t and vice versa. In fact there’s one thing Canterbury do better than any team in the league, which is why I decided to include them in this weeks post.
If you could combine both sides into some sort of Frankenstein’s monster of an NRL team, they’d probably do very well and certainly better than the sum of their parts. The Cowboys list contains multiple international and Origin players, but the Dogs seventeen are showing significantly more commitment and effort when defending. Canterbury is getting the most of out of what little it has, and it’s no surprise some players weren’t able to meet the high standard Ciraldo has set.
Let’s start off with the weekends matches that prompted this investigation. First up the expected points chart from Newcastle v Canterbury.
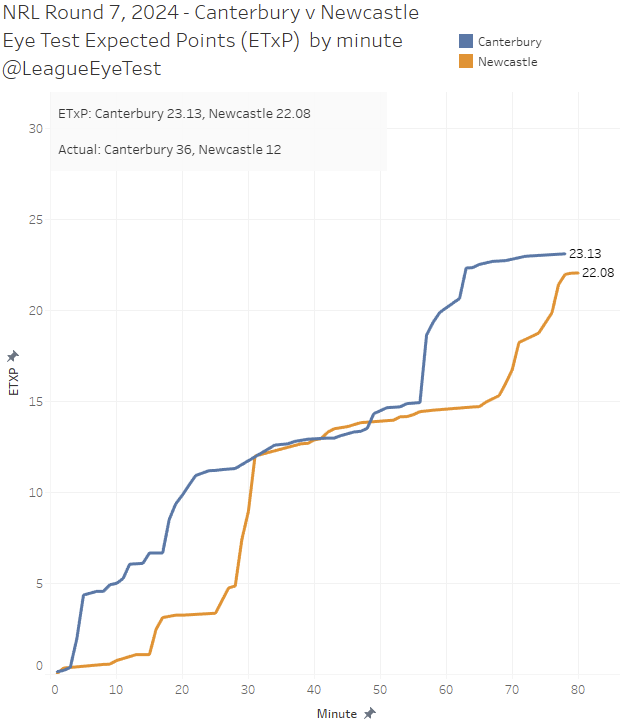
The Bulldogs had plenty of possession early and allowed the Knights some high expected point value field position before half time, but the visitors only came away with a single try to Dylan Lucas. Canterbury controlled field position middle of second half and built a sizable margin before Newcastle scored some garbage time points. It was a good sign for the Dogs defense as they allowed the Knights 22.08 points of field position but only gave up 12.
In the second game, North Queensland gave the Sharks a head start with quality field position and never recovered.
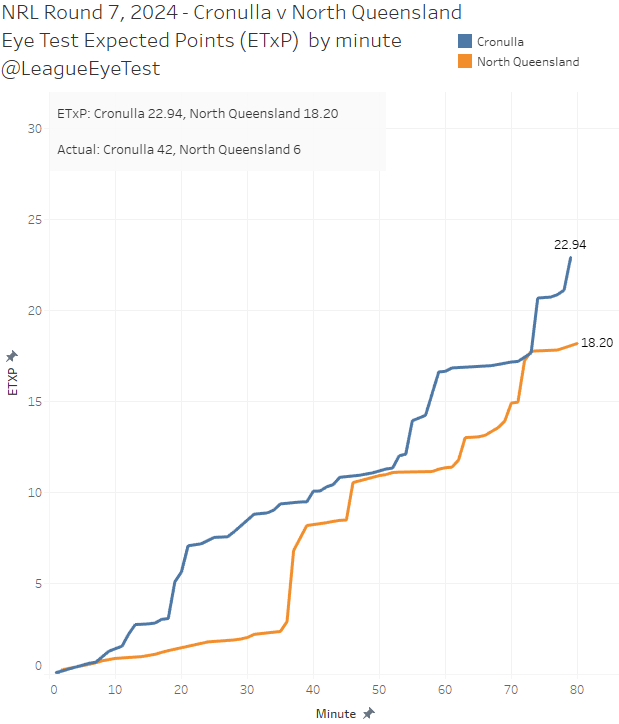
Cronulla had just 22.94 points worth of field position but posted 42 points. They allowed the Cowboys 18 points worth of field position, but they only crossed the line once, and on field position alone the game looks closer than it had any right to be.
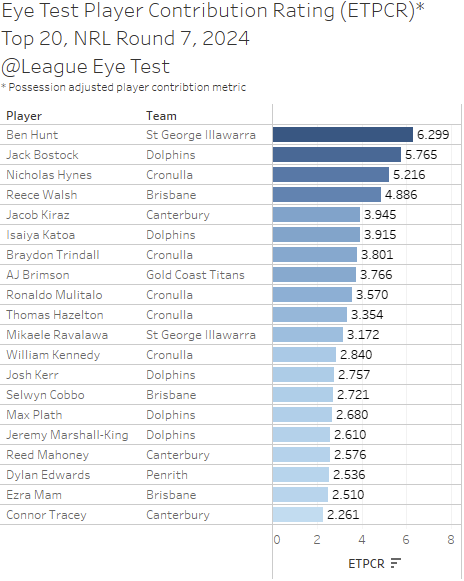
Canterbury had three players inside the top 20 by the Eye Test Player Contribution Rating (ETPCR) for this round, and Cronulla had five. A fourth Bulldog, Sam Hughes was 22nd at +2.190.
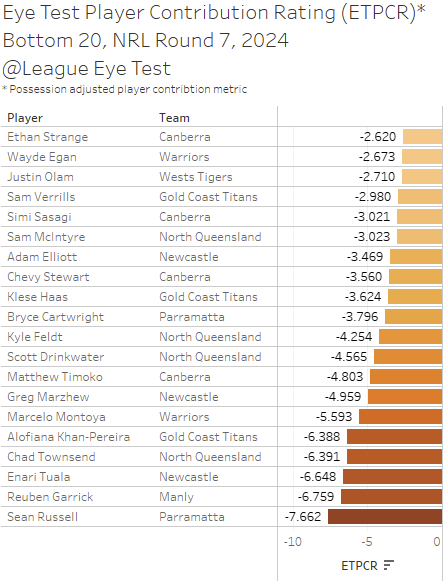
On the lower end of the ETPCR scale, North Queensland had four players in the bottom 20, including Chad Townsend at -6.391, with both Kyle Feldt and Scott Drinkwater also posting ETPCR numbers below -4.0. As bad as Newcastle were, the blame was shouldered much more evenly, with only Enari Tuala (who was a repeated victim of Viliame Kikau), Greg Marzhew and Adam Elliott breaking into the bottom 20.
That gives us some insight into how their Round 7 games differed, what if we look at some season long metrics? First up, we’ll check how their average margin per minute is trending, starting with Canterbury.
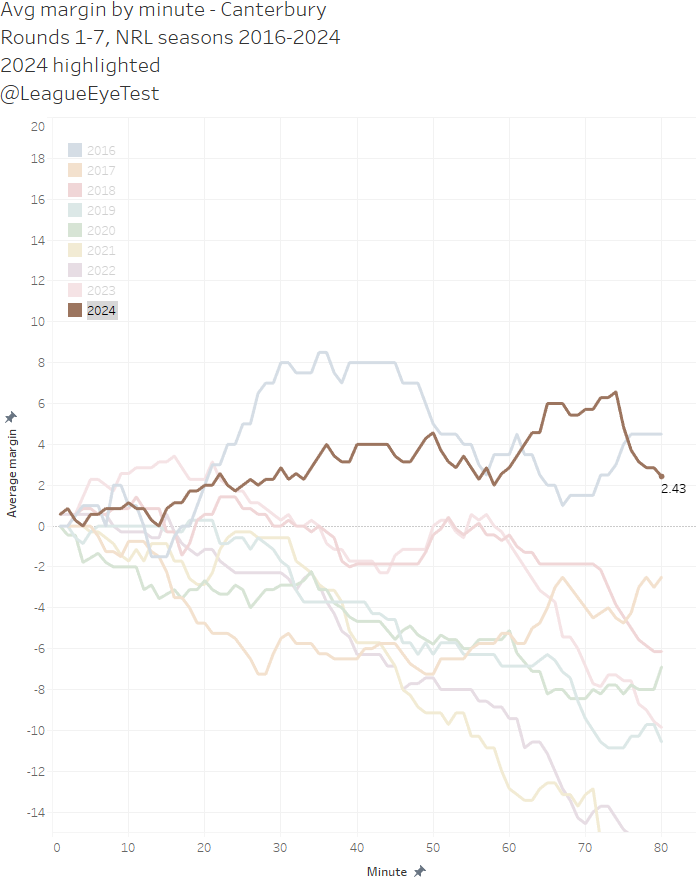
The Bulldogs have their first positive average margin after 80 minutes since 2016 at +2.43. At no point does the line dip below zero, some of which is bumped up by their big win on Sunday. However, the overall trend of this chart was similar prior to Round 7, the win just bumped them up from a -1.17 to the +2.43 we can see today.
In short, the Canterbury have been competitive in games much further into matches this season. They might have switched off for a half on occasions, such as the second half against Cronulla or the Roosters, but they’ve not had a match where they looked like they were making up the numbers.
Unlike North Queensland, whose margin by minute chart is below.
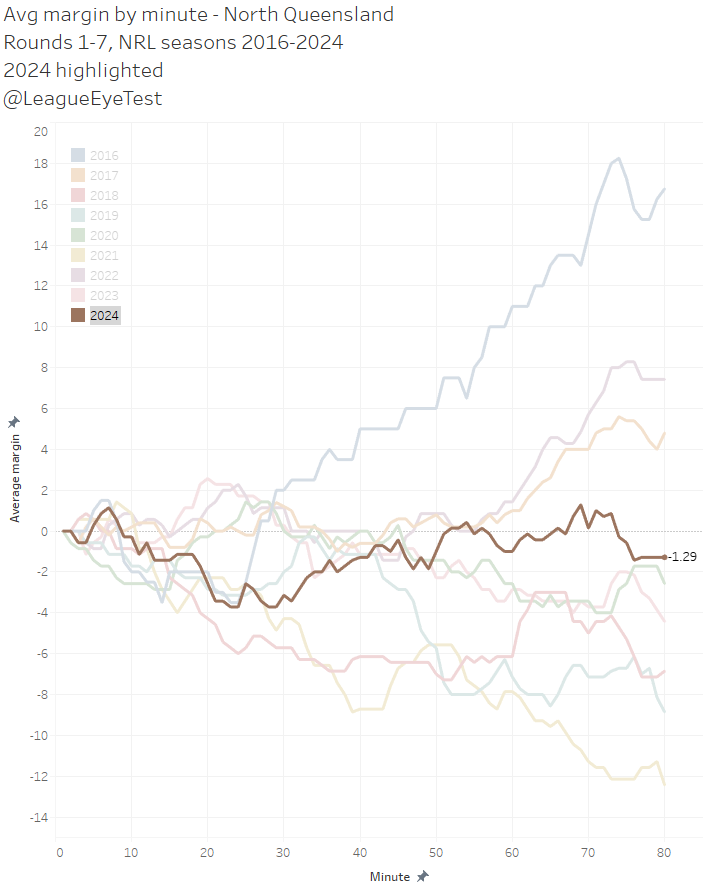
The Cowboys average margin is -1.29 after 80 minutes this season. In their losses they’re dropping behind early and struggling to compete and were gifted a win by Newcastle in Round 3. This chart looks much better due to their big wins over the Dolphins and Dragons, and in losses this year their average losing margin is 17.5 points.
To put this in a wider view, when you look at minutes played where a team is leading or trailing, the Bulldogs are only trailing in 38% of minutes this season, while North Queensland have been behind for 53% of time. Very unserious areas.
Focusing on attacking performance, when looking at the percentage of points scored above expected for the season, the Cowboys are scoring 43% more points than expected, only trailing Brisbane and THE Dolphins.
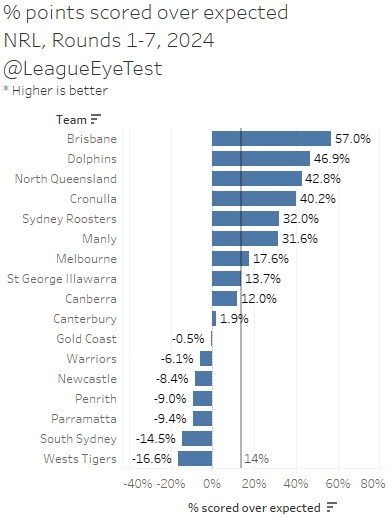
That ranks them third in the NRL. Canterbury are mid pack here, only +1.9% for points scored above expected. No surprises here, the Bulldogs haven’t shown a lot with the ball whilst the Cowboys have been lethal from almost anywhere on the field.
Again, this shows the importance of context in talking about points allowed with expected points. Without the result, you’re looking at just a total value of field position. You need the context of actual results to show any meaning.
The issue for North Queensland is that they’re also allowing 42% more points than expected, third worst in the competition. Here’s the same chart as above but showing percentage of points allowed over expected by team.
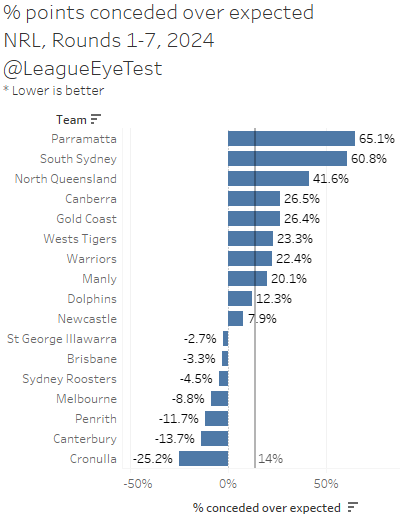
When you’re only ahead of the dreadful Rabbitohs and the slumping Eels, something is clearly wrong. Trying to outscore your opponents without any consideration for stopping them scoring isn’t a sustainable strategy. Eventually you’re going to come up against teams that won’t allow you the field position you want, or to execute your sets the way you want. When that happens, what do you fall back on? For the Cowboys the answer is “nothing”.
Yet for Canterbury it’s a completely different story. As seen above, they’re second best in the NRL at allowing points compared to field position expected point value at nearly -14%, only trailing Cronulla at —25%. Better than Penrith, Melbourne or the Warriors, three of the defensive juggernauts of the competition this season. I mentioned at the start of this post that it’s taken some time for Ciraldo to implement his defensive scheme, but it’s working incredibly well (keep this in mind for later).
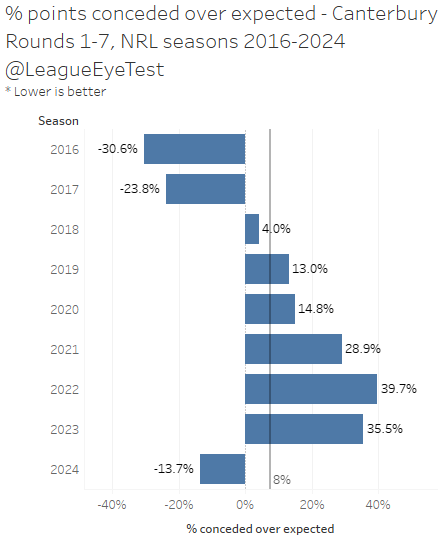
Last week I also mentioned how much of an aberration 2022 was for the Cows, and this next chart highlights it, showing year by year points over expected conceded. Remember for this chart, lower is better. One of these things is not like the others.
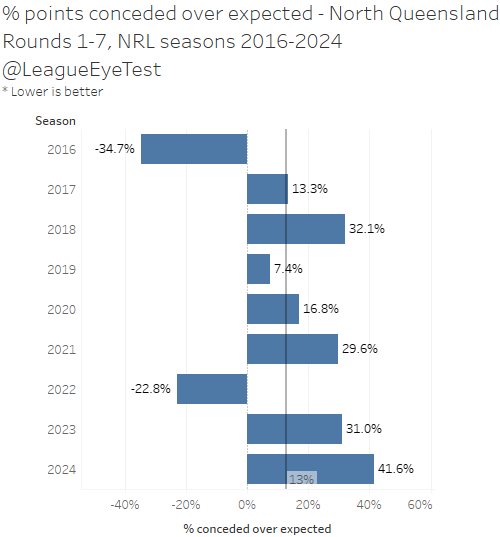
Aside from 2016, the only other year the Cowboys have been in the negative was 2022. It’s a plethora of terrible defensive seasons, consistently allowing more points than the field position given. You could almost draw a straight trend line from 2019 to 2024, with 2022 being a huge outlier. Whatever magic Todd Payten produced that season defensively, it hasn’t been sustained and regular programming has resumed.
Conversely, the same chart for Canterbury shows their improvement since Ciraldo’s appointment.
2024 is the first season after seven rounds with a negative points over expected since 2017, dropping from 30%+ during the last two seasons.
One thing that helps the Cowboys with the ball is that they start their sets higher up the field, 40.2m on tackle one, third in the NRL.
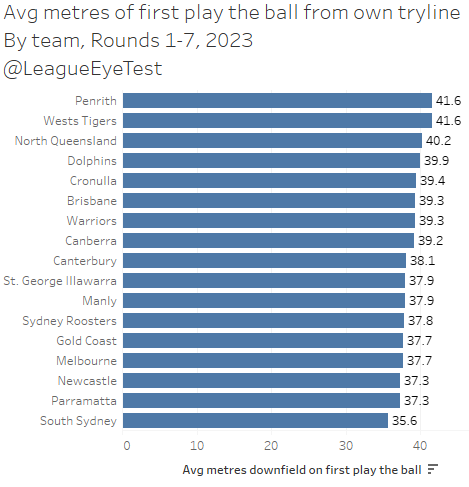
This puts them in good position to score points on the back of their forward pack. In contrast, the Bulldogs only start 38 metres out, putting them firmly in the middle of the pack.
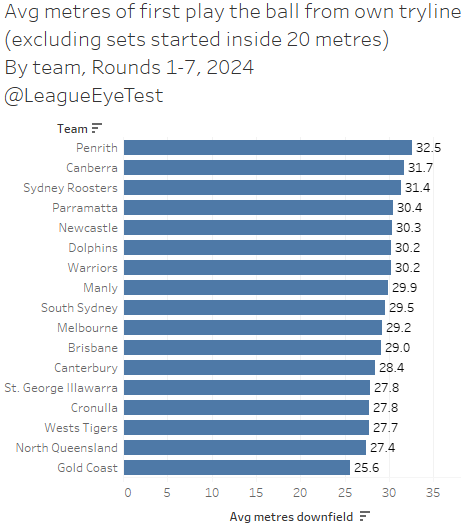
A lot of the Cowboys starting position is from repeat sets inside 20 though. When you remove sets started inside 20 metres, they move from third to 16th at just 27.4 metres, only ahead of the Gold Coast (25.6m).
Looking at heat maps of play the ball locations in control don’t show much difference between the two sides.
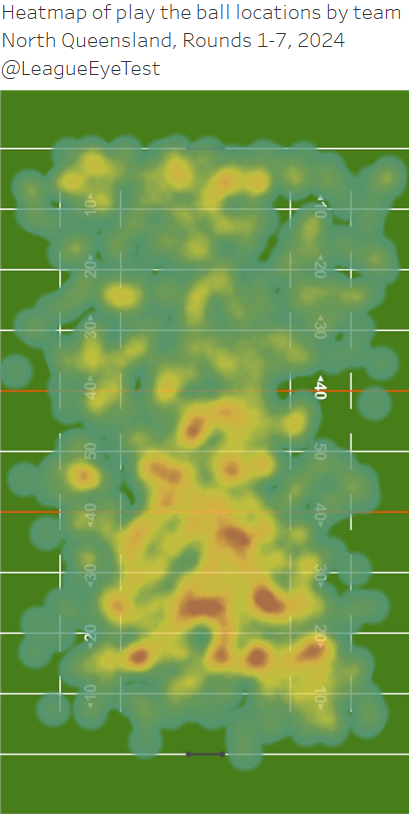
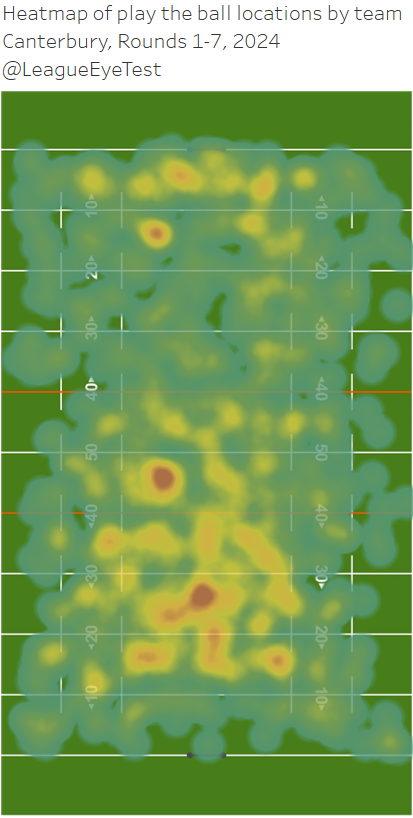
The Cowboys work the ball through the middle of the field more, whilst the Dogs play slightly wider especially on the left, where they have two higher intensity spots just before halfway and 15m out.
We demonstrated earlier that Canterbury’s defense has shown a marked improvement this season, but what is the cause of it? And what are the Cowboys doing wrong?
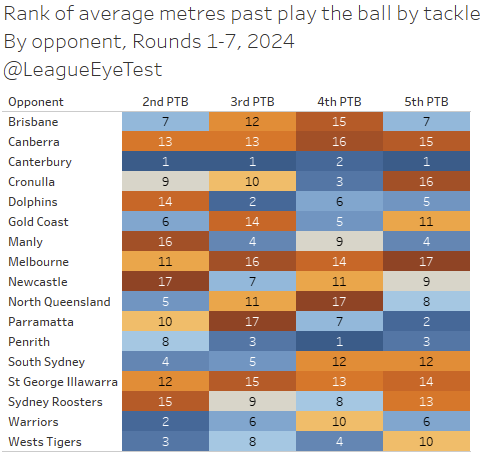
It’s not opponent starting position. Here’s the same chart from earlier showing average metres downfield on tackle one but by opponent instead of team.
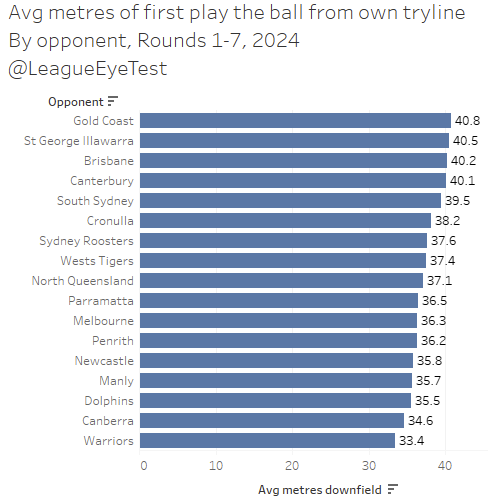
The Bulldogs allow opponents to start 40.1 metres downfield, third highest in the NRL. They’re not restricting opponent starting position in the way the Warriors do (just 33.4 metres).
The defensive heat map of play the ball shows the Dogs do well, keeping most play the balls for opponents inside 40m, but nothing out of the ordinary, while the Cowboys intensity here is a little bit further down field, between the 30-50 metre range.
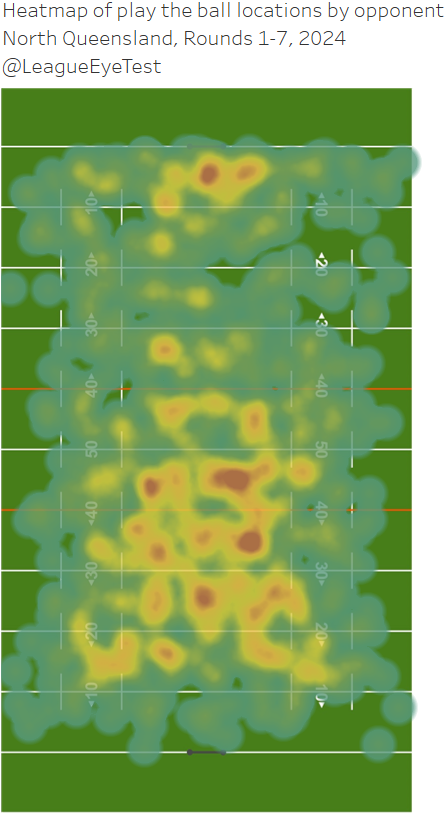
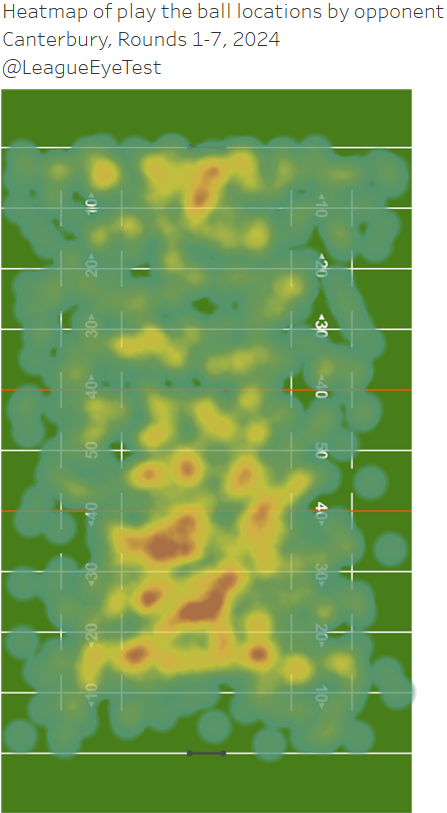
How does this happen since we saw earlier that the Dogs allow teams to start 3rd highest in the competition?
Because once teams get the ball, the Dogs are ruthless at stopping extra yardage past the play the ball. On average metres gained past the play the play the ball by tackle – not average run metres – the Bulldogs rank 1st, 1st, 2nd and 1st from the second to fifth play the ball.
Which means they are giving up good starting positions for sets, but their opponents are having to fight tooth and nail to get any extra metres. Ciraldo has focused on doing one thing better than the rest of the competition and it shows.
And the Cowboys? You can see above that for the same metric they rank 5th, 11th, 17th and 8th, indicating they pay attention early in sets, but switch off in the middle tackles allowing their foes to get further downfield.
As an example, using actual numbers instead of ranks, Canterbury allows just 7.41m past the play the ball on second tackle, whilst the Cowboys allow 9.23m. The Dogs are the only NRL team to allow fewer than 8 metres past the gain line on second tackles, the next nearest are THE Dolphins at 8.28m.
The problem for the Dogs though is that other than the Knights game, they’re not scoring enough points regularly. However, getting the defense right is better long term than nailing your attack, as the Cowboys have shown. It’s far easier to generate enough points to win a game 18-14 than it is to win 34-30.
The Cowboys have been able to manage a few wins with big scores. Their average metres gained past the play the ball ranks 3rd, 1st, 3rd and 3rd. Here’s the same chart as above showing metres made past the play the ball
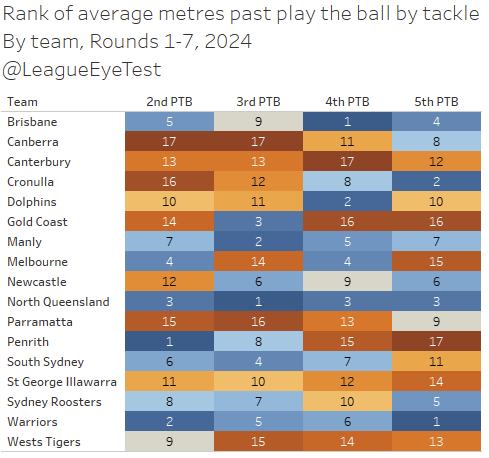
Their third play the ball average of 9.47m gained past the play the ball is joined by Manly’s 9.16m as the only two teams above 9 metres past the gain line on tackle three. On last tackle their 10.92m only trails the Sharks and Warriors
Even by more conventional rugby league metrics, Canterbury has still put on the clamps. Below is a chart of average metres per run conceded by opponent.
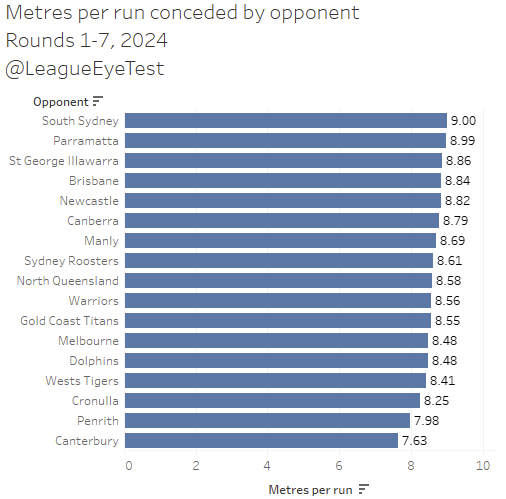
Yet again the Bulldogs defense shines here, allowing just 7.63 metres per run, 35 centimetres per run ahead of Penrith, the only other team to allow fewer than eight metres per run.
Unsurprisingly given the above, the Dogs are yielding the fewest post contact metres per run of any team in the competition.
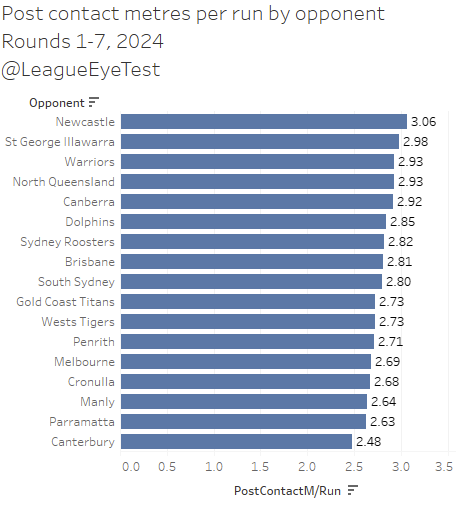
It’s not just line speed from Canterbury, it’s also preventing extra yardage once contact is made.
And North Queensland? They’re giving up the fourth most post contact metres per run, nearly half a metre more per carry than Canterbury. The Cowboys do move the ball well as noted previously, fourth in the NRL at 8.86 metres per run, only trailing Brisbane, the Warriors and Manly.
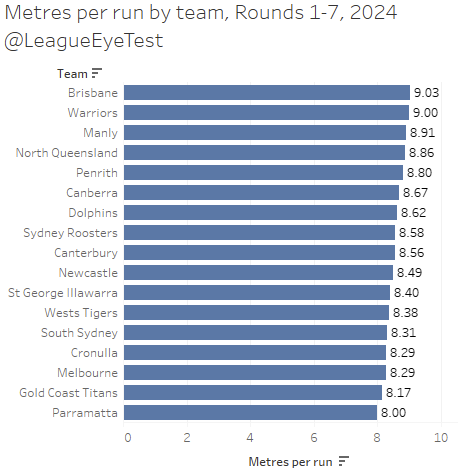
As an aside, that 8.0 metres per run for Parramatta this season probably explains why they’re struggling, regardless of Mitchell Moses’ availability. The Eels game plan relies on plenty of metres through the middle and building up possession, as discussed on the site previously. If they’re not even generating strong yardage runs, the writing is on the wall for them.
When you look at league wide net metres per run, subtracting metres per run conceded from metres per run gained, Canterbury is leads the competition at nearly +1 net metre per run, despite their average metres per run generated.
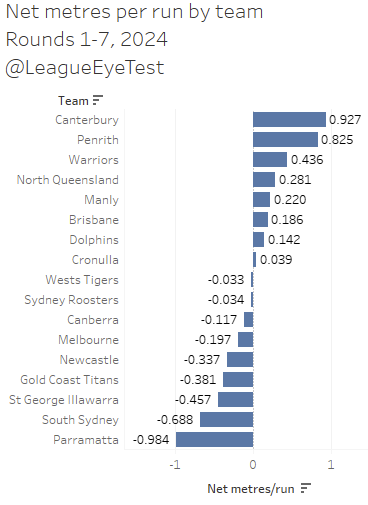
With that type of advantage, it’s no surprise that Canterbury are usually able to survive teams starting their sets close to the halfway line. Keep in mind they’re doing this with a relatively inexperienced forward pack with a front row rotation by committee. Max King is an Eye Test favourite but he could use some help. Again, I can’t help but point out the Bulldogs historic rivals Parramatta at the other end of this scale, giving up nearly -1.0 net metres per run. Even Moses can’t fix that.
Should Canterbury every work out their attacking issues, or add some quality to their halves, the rest of the league will be on notice. The current Bulldogs final back line form is still a ways off, with the lack of a true quality half preventing the eventual shifts of Stephen Crichton to fullback and Matt Burton to the centres. There’s no point taking the Gold Coast Titans route of weakening multiple positions to strengthen one other, and for now playing Burton at #6 and Crichton in the centres makes sense. Add in another quality middle and you can see why the future is incredibly promising at Belmore and Ciraldo’s defensive work deserves a lot of praise.
The end game for North Queensland is far less certain. Their defensive attitude is currently abysmal, Jason Taumalolo’s knees may turn into dust at any given moment, and their spine players look just as likely to give a game away as win one for them. Payten has shown he can get the most of this squad, but as father time marches on for a number of them, there needs to be a complete adjustment in how they prepare defensively for there to be any hope of a finals berth this season.