This article was originally posted on Medium in November 2019
The basics of rugby league haven’t changed in over a century, it still revolves around either running the ball or tackling the player with it. If you’re on the field and not doing either of those things, then you’re often described as a passenger or labelled with the venerable “playing in a dinner suit”.
Coaches and media will often talk about how “involved” someone is or was during a game, but it’s very nebulous and never quantified or backed up with anything other than a player having “X” amount of runs and/or “Y” amount of tackles. What if we were able to quantify the amount of this “involvement” a player had?
Here’s an article from the Courier Mail after the Brisbane Broncos lost 12–8 to early 2014. Apologies to Peter Badel, but it’s the first link that comes up in Google that mentions involvement rate (he’ll be redeemed later):
“Broncos players were left stunned by their 12–8 loss to the Titans, but of equal surprise was Thaiday’s uncharacteristic low involvement rate with the ball in the Queensland derby.
Data provided by Fox Sports Stats shows the former skipper made four runs for 22 metres.
It was Thaiday’s lowest individual hit-up count of the season — and only marginally better than his one run for two metres against the Bulldogs in 2009.”
Unfortunately, there’s not a lot of information here about involvement rate. All the reader knows is that Thaiday attempted the fewest runs in over five seasons. The article later mentions Thaiday making 38 tackles, which was his highest tally for the season indicating he was very active defensively. However there’s no information to glean if his rate of involvement was down because no rate is mentioned, just some counting statistics where the inference is that more equals better.
Using a metric named (for now) Involvement Rate, can use the total number of plays during a game and estimate the percentage of those plays that a player was involved in during their time on the field, either taking a run or completing a tackle. The inclusion of the number of plays is important, as it normalises the rate of involvement since the number of plays will dictate how many opportunities there are to make a run or tackle.
Why Involvement Rate?
In previous articles, I’ve looked at Run % and Tackle % as a way of quantifying workload on either side of the ball. Whilst both statistics are useful to look at in isolation, when you combine them you can not only see the total rate at which a player is involved in a game, but also how minutes played the or number of plays in a game can affect either side of their game.
The addition of Run % to Tackle % to construct Involvement Rate metric solves a few issues. Firstly, it reduces how involved Hookers are for Tackle %, since their roles are primarily about defensive and distribution with very little freedom to operate out of dummy half. It also increases involvement for edge players and fullbacks, especially those who take a lot of early hit ups bringing the ball out of their own area after a kick.
As usual, there’s a few caveats with this data. Firstly, it the number of plays that someone was on field for is an estimate since there’s no public data that will give the exact number of plays. Run % and Tackle % only look at how often a run or tackle is made, it does not consider the quality or impact of a run, Involvement Rate will only look at the rate of which someone made a run or a tackle, with no accounting for quality of run or tackle.
The other is that comparisons across positions isn’t necessarily the goal of this metric. Middle forwards (front row, lock, hooker and most interchange players) generally make the most runs and tackles during a game and converting their volume statistics to a rate of occurrence still ranks them at the top. Comparing full backs with front rowers doesn’t show anything useful when looking just at Involvement Rate. Using an NBA example, you wouldn’t use offensive rebound rate to compare Trae Young and Giannis Antetokounmpo, but you might use it to compare Andre Drummond and Joel Embiid.
How to use Involvement Rate
With Involvement Rate quantifying player work rate in rugby league, it allows us to answer some questions that previously were left to the eye test alone. Who are the most involved players in the NRL? How do the starting front rowers in the NRL rank for Involvement Rate? Is a player more involved when they play on an edge as a second rower or when they start in the middle as a lock? Currently we can look how their volume of work changes, whether their runs or tackles improve or decline. It shows the result of their work, but not how they got there, and there’s no weighting for the number of opportunities to run or tackle the ball.
To set the scene, as with my other articles in this series, the below chart has been updated with Involvement Rate (shaded blue) in addition to Run %, Tackle % by position for the last six NRL seasons:
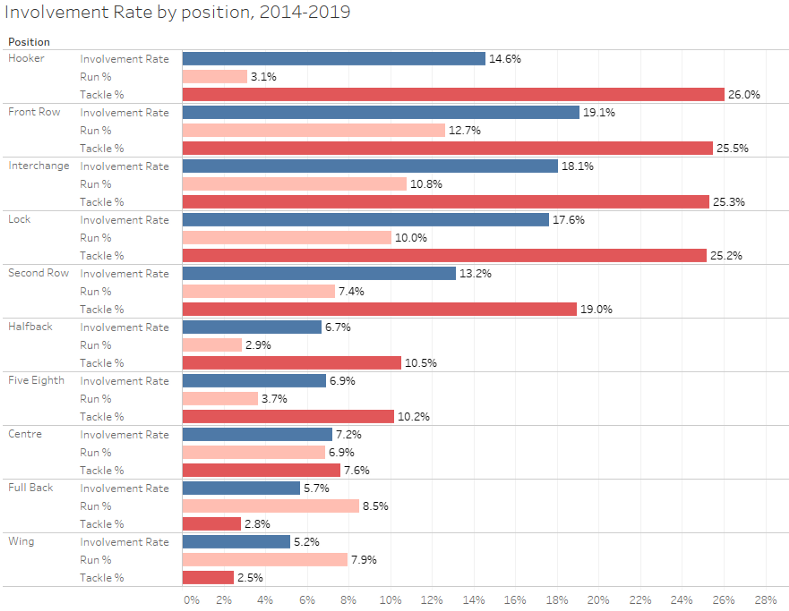
The above chart tell us that middle forwards are involved in one out of five plays when they are on the field. Hookers and second rowers are involved one to two times every five plays and backs are less than once every ten plays. This isn’t to write off the involvement of backs, but just emphasises that they’re not the workhorses of rugby league and we shouldn’t be comparing Involvement Rate across positions.
As stated above, middle forwards and halves are really the only valid position comparisons for Involvement Rate. Hookers end up on their own due to an extremely low Run % but would still be in the mix when you’re talking about middle players and Tackle %.
And even within positions, there are some problems. Utility interchange players are compared against middle forwards, as this latter group comprise most of the numbers 14–17 on an NRL bench. As stated in the previous articles, without reclassifying interchange players into middle/edge/utility there will always be a bias towards the middle players and rate the utility players unfairly.
Revisiting the Thaiday example
Returning Thaiday example at the start of this article, by looking at this game a bit closer and some things become apparent. That game against the Titans was the second highest number of opponent plays the Broncos faced all year (188), the third highest number of plays by the Broncos all year (181) and the most total plays for the Broncos that season (369).
Given the high number of plays, this would indicate the ball being in play far more often than usual and Thaiday may have been conserving his energy for defense by running the ball less. The article also mentions that Broncos focused their attack down the opposite side of the field. Both could both be a reason for Thaiday’s low hit up total.
Now we can answer the question, was this Involvement Rate for Thaiday uncharacteristic? Thaiday attempted 3 runs and completed 38 tackles, combining for 41 “involvements” in 51 minutes in a game with 369 total plays. Using these numbers, Thaiday’s involvement rate for the Titans game was 17.4%, or approximately one run or tackle in every five plays. For the 2014 season his Involvement Rate when playing in the second row was 17.8%. We can conclude that it was low, but not significantly and still above average for his position (13.2% from the above table).
What does a “good” Involvement Rate look like?
Now that we’ve demonstrated how Involvement Rate works, let’s look at the top 30 players over the past six seasons.https://medium.com/media/cd96e4d2d04a7af5469957a7ed0f6c35
You could really rename Involvement Rate as the Daniel Alvaro metric. The Eels forward has three of the top four seasons for involvement rate (2017, 2018 and 2016 respectively), with two of them above 25%. In plain terms, Alvaro either making a run or a tackle in 1 out of every 4 plays while he is on the field. To be consistently putting in that much effort on the field for 35+ minutes a game is a testament to his motor.
His only other NRL season (2019) was ranked 12th. Chris Satae’s 2018 season with the Warriors is the only other player in the last six seasons to hit 25%, and only more (Tim Robinson for the Sharks in 2014) has hit 24%, highlighting just how incredible it is for Alvaro to have multiple seasons above that mark. Additionally, if you refer to the chart above the highest involvement rate by position is 19.1%, meaning each of those three seasons by Alvaro was at a minimum 30% higher than the average player.
There’s something impressive in Alvaro’s dominance, which we’ll get to shortly. First, let’s look at the Involvement Rate against % for all middle forwards for every game from 2014–2019, shown in the scatter plot below:
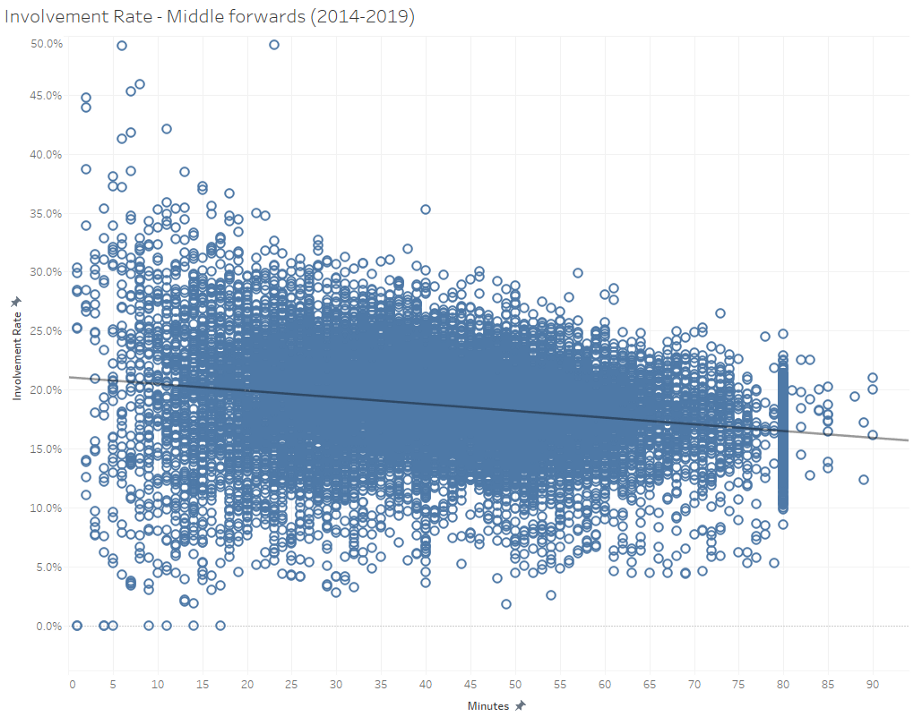
Generally, there is an inverse relationship between minutes played and Involvement Rate for middle forwards, which makes sense as fatigue becomes a bigger factor with high minutes.You can see the trend line highlighting the decline over time.
Now here’s Alvaro’s plot:
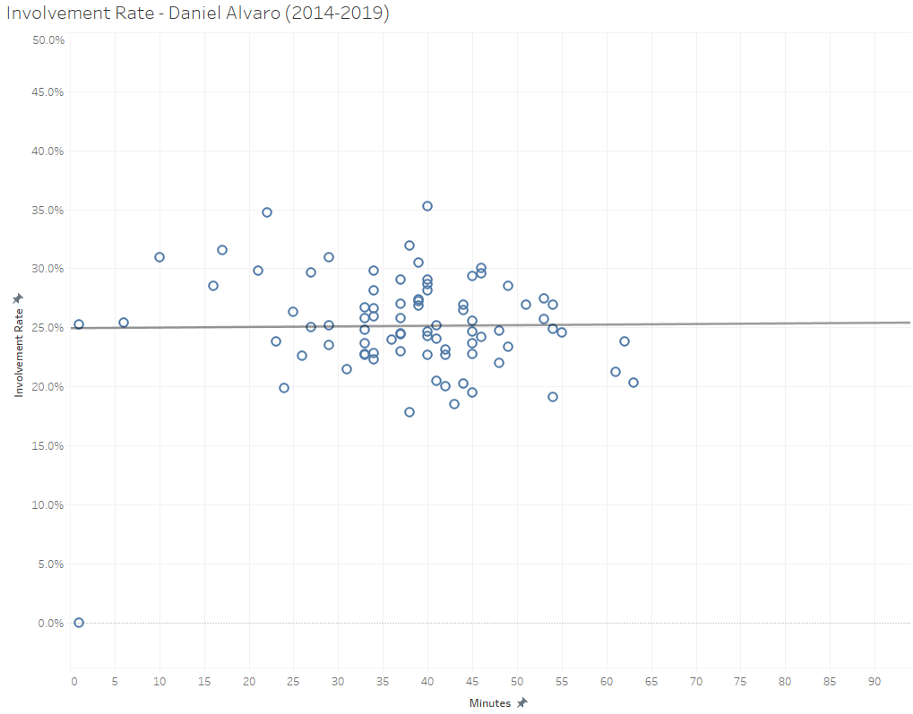
Unlike most middle forwards, Alvaro’s output doesn’t drop if his minutes increase, it increases by the slightest amount. The only other forward over this time period that I could find to have a similar relationship was Sam Burgess when he was playing in the middle for Souths. The scatter plot above also shows Alvaro has had only had a handful of games where his Involvement Rate has been below 20%. He’s just on another level when it comes to getting involved on the field.
2018 was the peak for minutes played by Alvaro at nearly 46 a game, yet it still yielded an Involvement Rate of nearly 26%. Alvaro’s lowest season for minutes played was 2019 which also produced his lowest Involvement Rate, but still considerably above the average forward at 23.6%.
Alex Twal is a good example of how increased minutes usually decreases involvement rate. By traditional statistics, he had his best season of his short career, playing an average of 53 minutes and making 34 tackles and 11 runs per game. Looking at Involvement Rate, it tells a slightly different story. His 2017 and 2018 seasons ranked 10th and 18th for Involvement Rate, both in the 23% range, with his average minutes at 36 and 40 per game for those two seasons. Yet in 2019 due to that huge uptick in minutes, his already impressive Tackle % dropped by 2% to 31%, and his Run % dipping below 10%, over 3.5% lower than his best season.
His 2019 ended up ranked 145th for Involvement Rate over the past six seasons, which sounds like a huge drop but at 20.6% it was still above average for a front rower (19%) or interchange player (18%). This just highlights that an increase in minutes usually results in a decrease in rate of output, but in Twal’s case it still resulted in him performing better than the average player in his position, which is was a net positive for the Tigers.
An example of how to apply Involvement Rate for a outside back is Josh Dugan. Yes, he gets a lot of flak from fans for making mistakes and picking up a knock seemingly every tackle. His actual Involvement Rate
However, he has two of the best seasons by Involvement Rate of a fullback, with his 2015 and 2016 seasons hovering around 25% higher than the average fullback. He’s also one of only two players to post an Involvement Rate for season higher than 10% (minimum five games played), which occurred during the 2014 season.
In fact, over those six seasons Dugan only has two stints where his work rate has been below average for his position — three games on the wing for the Sharks in 2018, and eight games at centre in 2019. You can question his decision making (especially regarding his hair), but there’s no questioning his heart and effort level.https://medium.com/media/fba8fc081cfb29f5e24413e698f7ff5f
Summarising Involvement Rate
Involvement Rate is not a catchall metric that can be used to evaluate everything a player brings to a team. It is only looking at two specific parts of the game (running and tackling) and even then, it is only considering the incidence of these two parts, not the quality or effect of them. This can be seen by two of the biggest game breakers of 2019, Latrell Mitchell and David Fifita, having below average Involvement Rates last season. Some players can have incredible impact on the game and turn matches in an instant with minimum involvement.
Daniel Alvaro may be elite according to Involvement Rate, but you wouldn’t say he’s a more damaging runner than Andrew Fifita. Yet both types of players are important to the composition of a successful team, although the Alvaro’s of the rugby league world don’t get the plaudits and are harder to quantify. The aim of Involvement Rate is to help identify those high work rate players every club need as a compliment to their high impact superstars.
Given the limitations of publicly available data it, this is approaching the limit of analysing player work rate. As the saying goes, don’t let perfect be the enemy of good. Involvement Rate isn’t perfect but can still be useful in its current incarnation. Seth Partnow, current writer at The Athletic and former Director of Basketball Research with the Milwaukee Bucks argues that being “less wrong”, not “right about everything”, is the goal from analytics in sports.
“In this regard, the development of data-driven insights and their adoption within sports is little different. In very few cases, if any, have large competitive advantages been gained from one big idea as opposed to the accumulated value of many smaller edges. Being “better” is not being right about everything; it is being less wrong.”
Involvement Rate fits the above quote, as now we have a tangible number to talk about when a players involvement in a game is brought up. It’s not perfect, but previously it was either vague, imprecise or indefinable. Now it’s still not exact, but better defined and quantifiable. We’re now less wrong about players work rate during a rugby league match. How much “less wrong” is arguable, but we’re moving in the right direction.
The next step would be to combine individual player GPS data to weight runs and tackles by movement and speed. But without that data becoming public (or receiving an invite to the NRL Data Jam) that’s unlikely to happen in the foreseeable future.
If you enjoyed this post please consider supporting The Rugby League Eye Test through one of the links below.
Scan the QR code or copy the address below into your wallet to send some Bitcoin to support the site Scan the QR code or copy the address below into your wallet to send some Ethereum to support the site Scan the QR code or copy the address below into your wallet to send some Litecoin to support the site Scan the QR code or copy the address below into your wallet to send some Bitcoin cash to support the site Select a wallet to accept donation in ETH BNB BUSD etc..Donate To Address
Donate Via Wallets
Bitcoin
Ethereum
Litecoin
Bitcoin cash

Support The Rugby League Eye Test

Support The Rugby League Eye Test

Support The Rugby League Eye Test

Support The Rugby League Eye Test
Donate Via Wallets


