
2024 marks the fifth season of the Eye Test covering the NRL with this site’s advanced statistics. I have no idea how I made it to five seasons, especially after whatever 2021 was. But somehow I’ve made it through to the other side and I’m happy with how the advanced statistics have been working. Mostly. There’s one comment I regularly get about the Eye Test’s Run % metric that always sticks in my head. Which is that it doesn’t judge the quality of that run, just the quantity. The metric just shows (as a percentage) an estimate of how often...
Continue reading...Explainers
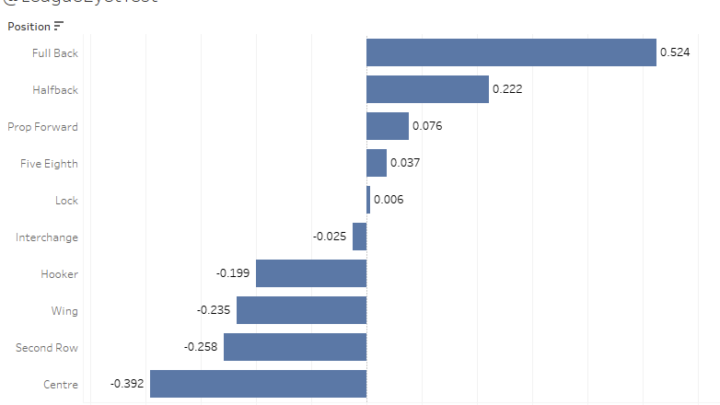
Explainer: Eye Test Player Contribution Rating (ETPCR) for the NRL
It’s been an up and down year here at the Eye Test. We’ve had the biggest week in the site’s history recently thanks to a post about sock heights that I expected to be one of the least read posts of the season. February saw the launching the Eye Test’s expected points model for the NRL, which had a tremendous reception. That lasted about six weeks until Round 2 when the data source I was using disappeared. Should that data ever return, so will ETxP, but for now it’s on ice. So much like the modern-day rugby league middle forward,...
Continue reading...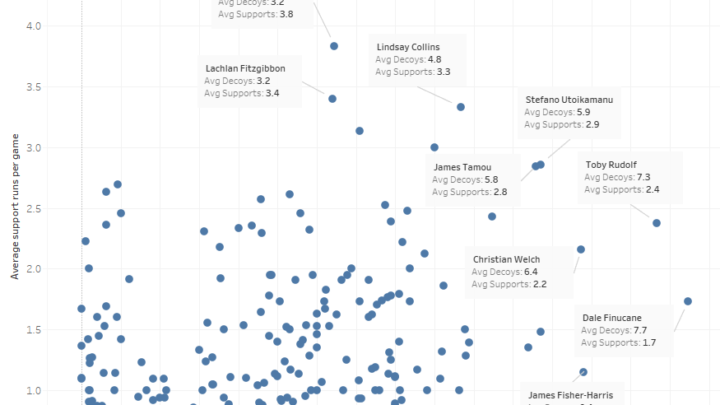
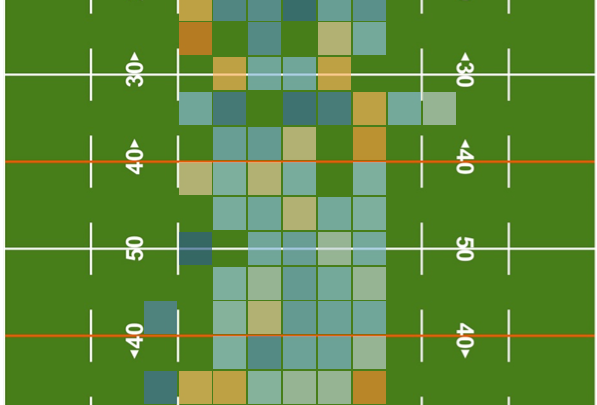
Explainer: Total Run % – improving Run % with decoys and supports
The advanced statistics for the NRL and rugby league in general that Eye Test introduced – Tackle %, Run % and Involvement Rate – have been around for a few seasons now, and I’ve been reasonably happy with the results. They’re not perfect (I don’t and never will claim them to be) and no one single statistic will ever solve any sport, let alone one with as many simultaneous moving parts as rugby league. But as metrics for tracking player workload I feel they offer an accurate representation of what is happening on field. Yet there’s always been something about...
Continue reading...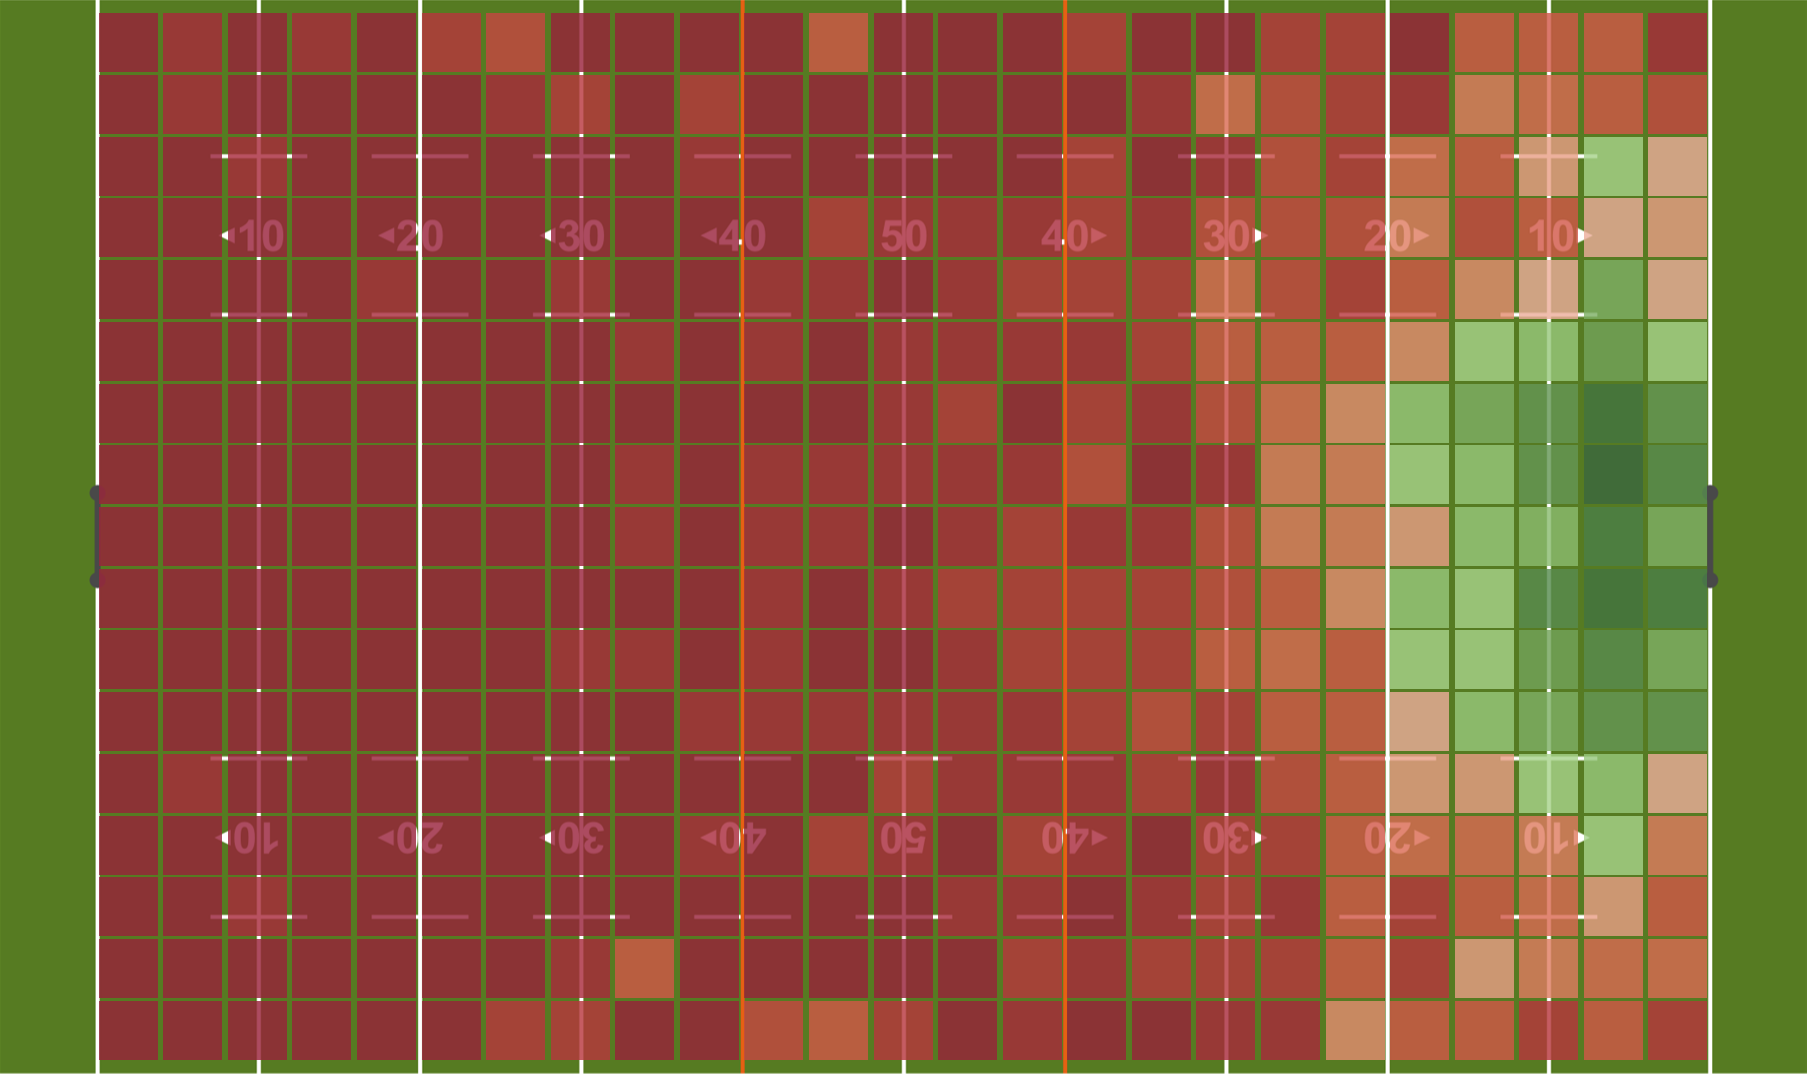
Explainer: Eye Test Expected Points (ETxP) for the NRL
“We stayed in the contest when they certainly had all the field position and a lot of ball. “We just couldn’t get any good field position. We were attacking from the back of the field at some stage and making some good yardage – but it was too far to go.” The above comments came from Wayne Bennett after his South Sydney team lost the 2021 NRL Grand Final to Penrith 14-12. The Rabbitohs were constantly under pressure from the Panthers, with Penrith forcing five drop outs to zero by their opponents. Yet they had a chance to tie the...
Continue reading...Explainer: Run % – The other half of quantifying player involvement in rugby league
This article was originally posted on Medium in November 2019. In my first article on some new advanced statistics for rugby league, I looked at a statistic for rugby league called Tackle %. The aim was to quantify how often a player made a tackle during their time on the field. As correctly pointed out in some feedback to the article, Tackle % will always skew heavily for middle forwards as they make most tackles during a game. Part of that is intended, as there are plenty of statistics to evaluate performance with the ball. Yet there’s very little to...
Continue reading...Explainer: Involvement Rate – a metric for player work rate for Rugby League
This article was originally posted on Medium in November 2019 The basics of rugby league haven’t changed in over a century, it still revolves around either running the ball or tackling the player with it. If you’re on the field and not doing either of those things, then you’re often described as a passenger or labelled with the venerable “playing in a dinner suit”. Coaches and media will often talk about how “involved” someone is or was during a game, but it’s very nebulous and never quantified or backed up with anything other than a player having “X” amount of...
Continue reading...