
This article was originally posted on Medium in October 2019
When defensive effort or involvement is talked about in rugby league circles, especially in mainstream media analysis, it eventually comes down to who made the most runs and who completed the most tackles. On the defensive side of things, more tackles equals more effort and more impact, right?
Usually the players who would be talked about are those topping the tackle counts. Mahoney led the National Rugby League (NRL) in total tackles this season with 1,052 tackles in 1,739 minutes 24 games. McInnes led the NRL in average tackles per game, with 45.8 from 23 games. Does that make them the best defenders in the game?
Counting stats only tell you how much, not how well
The downside of ranking players by tackle volume is that it tends to over-emphases those who play big minutes through the middle of the field, as most hookers do in rugby league. That is clearly evident when you look at the top tacklers for 2019. Five of the top seven tacklers were hookers. The top five players by total tackles all played at least 72 minutes a game. The top five by average played at least 71 minutes a game. Common sense (a rare thing in rugby league) indicates more minutes result in more opportunities to make a tackle.
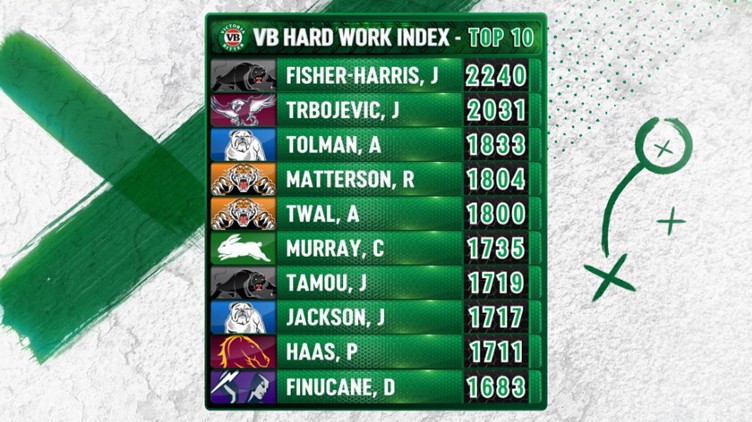
The NRL has tried to shake things up with their VB Hard Earned award, which aims to “recognises the true workhorses of the NRL”. Yet it only looks at volume for counting stats, again placing an emphasis on those who play more minutes and can fill up statistical buckets. There’s no quantification of how involved a player was other than more “stuff” being better.
Middle forwards, especially those off the interchange bench, are expected to expend a lot of energy in short bursts, which will never lend to being recognised as high involvement players as long as the defensive narrative is framed around the number of tackles made. The defensive effort required from a starting lock playing 80 minutes is vastly different from a 30–40 minute middle interchange player, yet the only current way to quantify this is by filling up a bucket labelled “tackles”.
Are these high-volume tacklers like Mahoney and McInnes defending at a better rate than the Parramatta front rower Daniel Alvaro, who made 410 tackles in 17 games, at an average of 24.4 in 35 minutes per game? By volume he only ranks 117th for the season, and 93rd by average. Would he be ranked as the 117th or 93rd in the NRL for defensive involvement? Eels fans would probably tell you otherwise, but what evidence could they use to back that up?
Enter “Tackle %” or “tackle rate” (we’ll use “Tackle %” for the rest of this article for consistency sake). If you’re familiar with Steal % in NBA statistics, you’ll understand the genesis of this metric. The aim is to actually quantify the rate of involvement from a player in defense, by estimating the percentage of opponent plays that ended with a specific player completing a tackle.
The methodology
Tackle % is calculated by the following formula — (Player Tackles x Team Minutes)/(Player Minutes x Opponent Plays). Opponent Plays is the key factor in this equation as it adjusts for possession. After all, you don’t have an opportunity to complete a tackle unless your opponent has the ball. Without Opponent Plays we’d be looking at a more basic yet still relevant tackles per minute metric. Team Minutes would usually be 80 for a single game, unless there’s Golden Point.
(A quick aside before we move any further. I’m using Fox Sports NRL statistics for this analysis for several reasons. The first, is that it was the easiest publicly available information for me to access. The second, is that the most popular NRL fantasy league, Supercoach, is run by News Ltd and uses the same data for scoring. This data also forms the basis for some articles I’ve penned for NRL Supercoach Talk. But enough about me.)
Moving on, just how are opponent plays defined? For this we are looking at Opponent Play The Balls + Opponent Kicks + Opponent Tries. Opponent Play The Balls should make immediate sense for inclusion as a basis for total plays. However the number of Play The Balls does not reflect what happens on the last tackle. A handover occurs when a player is tackled with the ball on the sixth tackle, yet results in no play the ball, just a turnover of possession. That would result in a +1 to a player’s tackle count, but not increase the number of Opponent Plays, resulting in an inflated percentage. A player completing every tackle in a six tackle set without accounting for the last play would have a Tackle % of 120%, which is theoretically impossible.
By including Opponent Kicks and Opponent Tries, two of the more likely and easily identifiable outcomes of a last tackle play, we are including the majority of end of set plays. All players on the field have a chance to tackle a player who is attempting to kick the ball (regardless of whether they should or could), and a try will result in a missed tackle if a player is dragged across the line. A tackle would be awarded if the player was held up.
Which brings us to the other likely outcome of a last tackle play was mentioned before, the handover. There’s no simple way to track handovers in publicly available NRL statistics, unless we include Errors as a proxy. Unfortunately, Errors would also include things like knock ons and forward passes. We’re either faced with under-representing a small number of handovers per game by leaving them out, or over-representing them by including errors. I’ve chosen the former as the lesser of two evils.
To account for player not playing a full game, the number of opponent plays is adjusted for minutes played. In the case of players who are on the field for the full eighty minutes, no adjustment is made. More publicly available data would result in a more accurate version of Tackle %, by being able to identify handovers and number of plays whilst a player is on the field, but that’s an article for another day.
A real world example
In an attempt to make things clearer, let’s use a specific example, let’s look at Parramatta forward Daniel Alvaro in Round 24, 2019. The Eels faced Brisbane at home, losing 17–16 in a close game. The Broncos chalked up 151 team plays for the game, while Alvaro played 33 minutes and completed 22 tackles.
151 opponent plays over 80 minutes equals 1.9 plays/minute. We know Alvaro played 33 minutes, therefore we can estimate that there were 63 plays by the Broncos whilst he was on the field. From there it’s an easy calculation of 22 tackles divided by 63 plays, which is 35.3%. Therefore, we can estimate that Alvaro completed a tackle on 35% of Broncos possessions in that specific game whilst he was on the field. Im simpler terms, for every twenty times a Broncos player was tackled, Alvaro was involved in seven of them.
Putting things in context
We’ve worked out how to calculate it, the next step is interpretation. How does that 35% from Alvaro measure up? Is it good, bad or average? Looking at this number in a vacuum has no value, but if we compare it to position averages the picture becomes a bit clearer. The following chart shows the average Tackle % by position for all NRL players from 2014–2019, sorted by descending order.
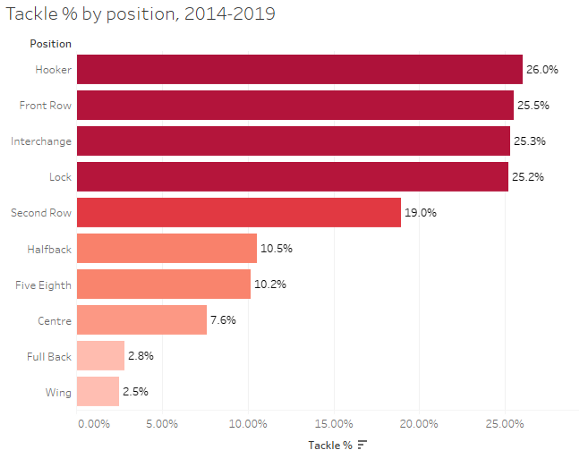
The main thing that stands out from this chart is that comparing tackles made or Tackle % across certain positions is futile. Comparisons across middle forwards are the most valid, as you can see by the darker red bars all hovering around 25% or 1 in 4 plays. Second rowers are unique forwards for Tackle % sitting on their own at 19%, while halves perform relatively similar duties. It’s also likely that Interchange is being dragged down slightly by utility players or backup dummy halves. This chart also helps highlight why raw tackles can be misleading in the original examples of Mahoney and McInnes with hookers making the highest % of tackles.
Now that we know the average Tackle % by position, we can now contextualise Alvaro’s performance against the Broncos in Round 24. He started the game at lock for the Eels, meaning that 35% sits about 10% higher than the average lock’s performance. That 35% would have ranked him second among all locks and 11th overall by Tackle % in the NRL for that round, but only 95th by volume for his 22 tackles.
Individual games can be misleading, as can limited minutes. The highest Tackle % for a single game in the past six years actually belongs to noted turnstile Bryce Cartwright. In Round 4 2018, Cartwright played 1 minute and completed three tackles, resulting in an impossible Tackle % of 164.3%. Small sample sizes and very limited minutes are drawbacks in estimating the number of plays. As mentioned above accurate play by play data would negate this.
The bigger picture
This is one of the reasons why Alvaro has been used as an example to explain how this metric works. Over the past six NRL seasons, Alvaro owns two of the three highest Tackle % for a season of players who played more than 150 minutes during a season. His 2017 and 2018 seasons rank second and third, and his 2019 season ranked 14th. Alvaro’s 2017 season for the Eels was particularly impressive, with over 600 tackles made in 23 games at a 38% rate.
The only other player to have more than two individual seasons inside the top thirty was Christian Welch, 1st (2015, 42.88%), 7th (2017, 35.67%) and 27th (2018, 33.04%). Interestingly, Welch was headed to Parramatta to join Alvaro before suffering another knee injury. Others with multiple seasons were Luke Bateman and Alex Twal, while Jazz Tevaga fell just short with the 29th and 31st ranked seasons. It should be noted that every player inside the top 30 over the past six seasons was a middle forward or interchange player, and had a Tackle % of at least 32.8%, significantly higher than the 25–26% average at their position.
Going back to our original examples of Mahoney and McInnes at the beginning of this article, we can now evaluate their involvement with more information. Both made over 1,000 tackles this season which is a fantastic achievement in itself. But whilst they ranked first in total tackles (Mahoney) and first in average tackles per game (McInnes), their rankings for Tackle % tell a slightly different story.
Mahoney still rates highly, coming in 25th (of 405 eligible players) for 2019 with a Tackle % of 30.36%, which as we saw before is about 4% higher than the average hooker. McInnes is a different story, as he only ranks 75th for Tackle % with 27.06%. He’s still around 1% above the average hooker, but his high average per game is all about having extra opportunities in defense, as he spent four and a half minutes more on the field than Mahoney.
Comparisons within position
The other advantage of using Tackle % to identify defensive involvement is that you can look at the other end of the scale and see who is underperforming for their position. Remembering that the average Tackle % for second rowers is 19%, below is a table of the bottom 10 seasons from players who started a minimum of five games in the back row.https://medium.com/media/5a22e7b70738701aa9773d730909ae71Bottom 10 Tackle % seasons from players who started at least 5 games in the second row, 2014–2019
The fact Tony Williams holds two of the top three spots and Dave Taylor sits third lends some (minor) credibility to this metric as a useful evaluation tool. Having a season where you are 43% worse than the average second rower and barely tackling at a rate above the halves that defend outside you is not something that would be shown up in pure tackle stats alone.
Hopefully the above shows some validity to Tackle % as a statistic that has value for rugby league moving forward. It’s not something that is a be all defensive metric to use in isolation, or replace total tackles, but another lens in which to gauge defensive performance. As analysis of rugby league moves out of the dark ages of analytics by talking about statistics in raw volume terms, there will be room for more nuanced metrics that reflect efficiency or involvement like Tackle %.
If you enjoyed this post please consider supporting The Rugby League Eye Test through one of the links below.
Scan the QR code or copy the address below into your wallet to send some Bitcoin to support the site Scan the QR code or copy the address below into your wallet to send some Ethereum to support the site Scan the QR code or copy the address below into your wallet to send some Litecoin to support the site Scan the QR code or copy the address below into your wallet to send some Bitcoin cash to support the site Select a wallet to accept donation in ETH BNB BUSD etc.. Donate To Address
 Donate Via Wallets Bitcoin
 Ethereum
 Litecoin
 Bitcoin cash
Support The Rugby League Eye Test
Support The Rugby League Eye Test
Support The Rugby League Eye Test
Support The Rugby League Eye Test
Donate Via Wallets


Hi, what is the simplest way of rating a team’s defense and attack with Fox Sports stats? Could you please email me your reply? Many thanks, Douglas.