
Another quiet week for rugby league.
I’m not going to use any time trying to explain the numerous factors what was behind the one sided results during Round 16. Friend of the site Liam of PythagoNRL fame has already penned an amazing post on the subject, and everyone should read it, if you haven’t already. I’ll be here when you’re finished. It’s a far more nuanced situation with multiple factors at play than the myopic argument that either rule changes or bad teams being the root cause alone, and Liam summarises it with his usual brilliance.
There’s also been some great analysis and stats disseminated over the weekend on records being broken for most points and the number of lopsided results, and I’m not going to tread that ground either. But the amount of “firsts” and “outliers” occuring this season continues unabated.
The results are bad, but a possibly bigger issue is the huge margins during those games. The “it’s not the rules” side claims there’s always bad teams, they’re not showing up or they need to try harder. Those things are true. Saying “these rules didn’t change the result today” can also be true.
I don’t think any set of rules would have given Canterbury a chance against Manly. The game was effectively over after 24 minutes. What these rules are changing is the flow of the game, causing the bad teams to be run off the park earlier in games under a gush of momentum that is nearly impossible to stop. It might be the difference between the Dogs losing 36-0 and 66-0.
What I am going to look at this week is the margins within games this season and why it is a huge cause of concern for a sport that is primarily a television product. Before we get started, I wanted to say a huge thanks to Liam for providing the data for this analysis. He truly is a gift to the NRL community. If there are any errors with the data, please blame me.
Not only are these games being decided by larger margins, that these huge margins are occurring more often, happening earlier in games and lasting for longer, which is a triple whammy for the game’s broadcasters. Games like Manly v Canterbury are often over in the first half, leading to viewers paying less attention or even tuning out completely.
Why does the margin matter? Because a team leading by three converted tries (18 points) at half time has 92% chance of winning, per Liam’s WCL metric which estimates win probabilities during the course of a game given the scoreline and minutes played. A team leading by 18 points after 20 minutes should win 95% of the time. If you’re conceding a large lead early, as clubs are doing regularly in this new era of rugby league, the chances for a comeback are incredibly slim. Again, not a pretty picture for a media organisation paying hundreds of millions of dollars for a two hour game that is essentially being decided within the first half hour.
Moving onto the margins, and it’s no surprise that this weekend had one of the highest margin differences in NRL history (1998 onwards), which was on the cards after the slate of Saturday games. Even just over the past seven seasons the difference between 2021 and what preceded it is stark as can be seen below.
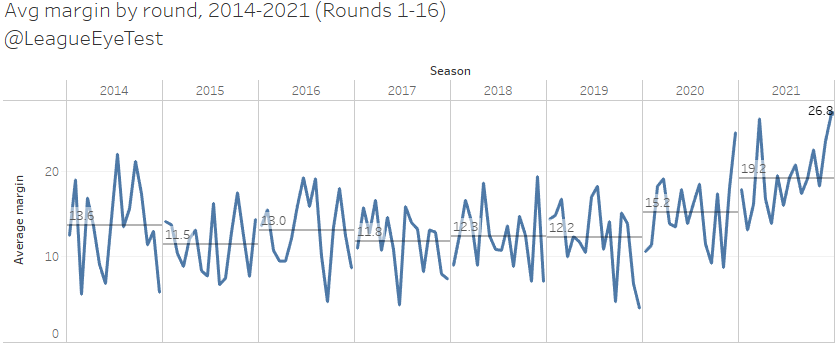
There has been an average winning margin of 19 points per game so far in 2021, up from 15.2 last season, both of which are ominously higher than any of the previous seven seasons which hovered between 11.5 and 13.6 per game from Rounds 1-16. 2021 already had five rounds with an average margin of over 20 points, including 26.1 (Round 4) and 26.9 (Round 16). Prior to this year, there had only been three of them in the last seven seasons, two in 2014 and one in 2020.
On the lower end, the “closest” round this season was Round 2 with an average margin of 13.1. TO put that in perspective, each of the previous seven seasons had at least one round with an average margin of less than 10 points per game, even the often maligned 2020 season, which had two of them up to this point. Thus far in 2021? Zero rounds with an average margin fewer than thirteen.
The weight of the change in margins becomes even more apparent when you look at margins by half.
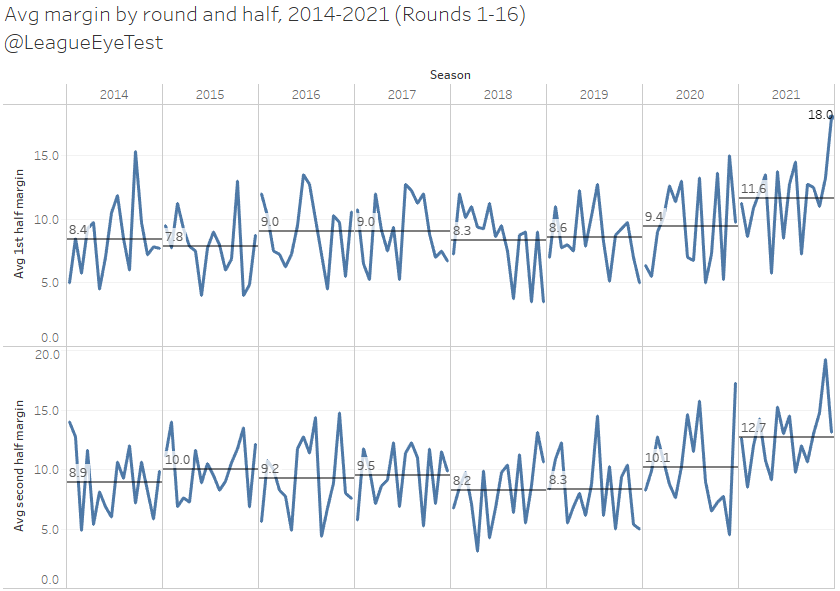
Each of the prior seven seasons had an average first half margin under 10 points per game. Then came 2021, which has seen that pumped up to 11.6 per game, meaning a team lading at the half does so with a lead of almost two converted tries.
And it’s not just the margin itself. There’s been 51 games so far this season with a margin greater than two converted tries (13+) at the break. That is an increase of more than 50% on 2020, when there were 33 such games. Not only are these giant leads getting larger, but they’re also happening more frequently.
Things get even more one sided when you look at margins over the course of a game. Below is a chart of the average margin at every minute of an NRL game for the past six seasons up to Round 16. I’m sure you can see what sticks out here and you can pick which colour is 2021, and those of us nostaligic for better days will notice the closer margins during the 2017-2019 period.
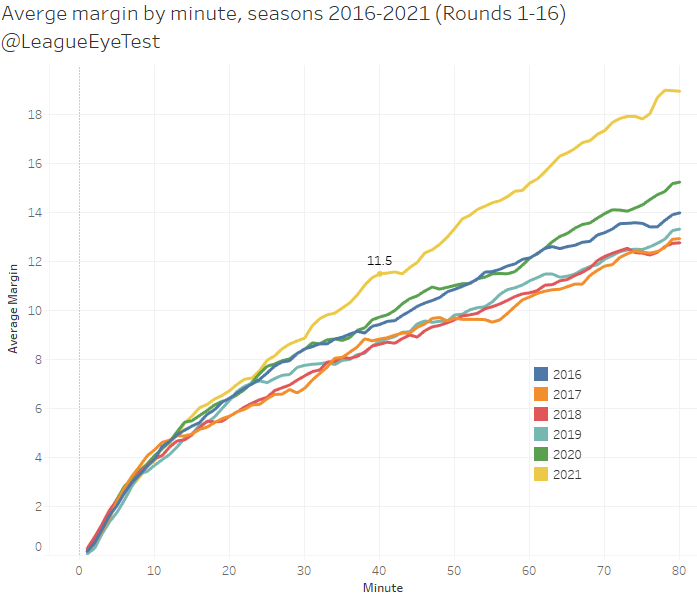
From about the 25th minute onwards, the yellow line for 2021 starts to diverge from the same path that 2020 and 2016 were taking. It actually jumps ahead of them at about 15 minutes, most likely when the starting forwards are becoming gassed. There’s also a jump of nearly one full point in the closing stages of games, from the 76th minute to the 78th where the average margin jumps from just over 18 to nearly 19 points.
Back to the yellow line for 2021, if you look at the average margin of 11.5 at half time this season, that level of margin wasn’t seen until the 55th minute of games during the 2020 or 2016 seasons, and not until after the 65th minute for seasons 2017-2019.
Round 16 was a particular outlier in a season full of them. Games don’t necessarily start out this slanted, but as fatigue kicks in and one team gets the upper hand, around the 20th minute, the margin line shoots up until just before half time with a plethora of points being scored in a short period of time.
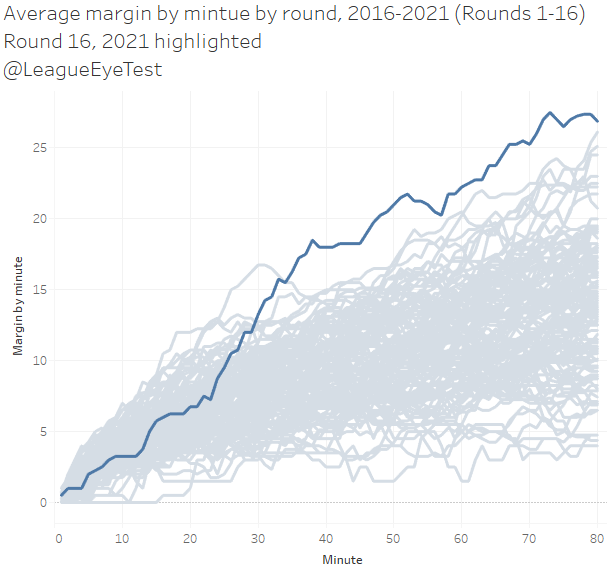
We’ve not seen another round like this. From the 34th minute onwards, no round in the past eight seasons has seen an average margin this high, and from the 30th minute Round 16 was only beaten by Round 4, 2021. Again, huge early leads before half time, which must be making it incredibly hard for broadcasters to retain viewers through their analysis during the break and into the second period. As mentioned earlier, the Manly v Canterbury game on the weekend was basically over in by the 25th minute, meaning some fans aren’t even making it to the main break.
It’s not just the number of matches with huge margins and how early they’re becoming formalities, but also the duration of each game being played in what amounts to garbage time. Below is the number of minutes played in each season where the margin was 19 points or more (more than three converted tries).
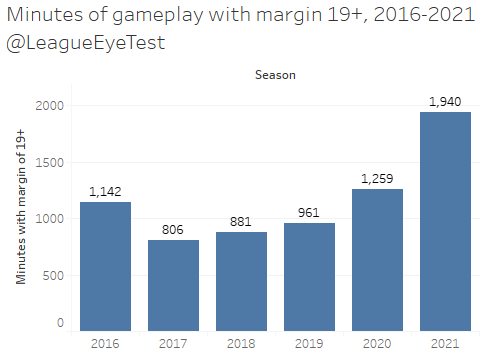
]Here is the huge issue for broadcasters. Over 1,900 minutes have been played this season with a 19 point or more margin, which is a 50% increase on 2020, and a 100%+ increase on 2019. If we’ve always had bad teams, as the “it’s not the rules” movement says, why are they suddenly now as bad as they were two years ago and 50% as bad as they were last season?
Let’s put this number into context. That 1,940 minutes equates to almost 16 minutes of every game thus far this season played with a margin greater than 18 points. 16 minutes is 20% of an NRL game. Yes, 20% of a game this season is being played where there is more than three converted tries between both teams. Is it any wonder people are claiming to be switching off?
This can be broken down even further by looking at the percentage of minutes played by each score difference, which can be seen broken down below by season.

Assuming every score is converted (6 points), 2021 is seeing around one third of the game played at one score difference, and another third at two scores difference. This 67% is a dramatic decline from the mid 2010s where that number was nearly 80%, and the 34% of time within one score is down from the peak of 2018 where it was over 42%.
As mentioned above, nearly 20% of game time is played under an 18+ margin. If you look at how much is played where the score difference is three tries or more that jumps up to almost one third.
The games are becoming more one sided and happening at a far greater frequency, and the periods of dominance are lasting longer which means fewer competitive periods within a match let alone competitive games.
People are so desperate for quality, competitive rugby league games that they talked themselves into both Friday games being classics because they were won by one point. That conveniently ignores the first game having all the strategic underpinnings of an under sevens trial game and the second game being riddled with errors and Mitchell Moses missing a relatively easy penalty goal to win the game.
For a sport that lives and dies by television revenue, having a product that is allowing fans to tune out earlier a every week is a huge cause of concern. A band aid solution like receiving a penalty instead of a set restart inside your own half isn’t going to provide instant relief. There was no problem to solve, yet we were presented with a solution no one asked for.
Hopefully, they have a solution for the problem they’ve created when Nine and Fox Sports ask what is going on, and why are they paying for a product that people are switching off of earlier every week.
Melbourne continue adapting to the new normal
Our supreme leader has been all over the media this week and one set of comments caught my eye.
“I do concede and acknowledge the six-again has caused a shift in momentum because the teams can no longer slow down the ruck or have a stop-start game.
“Clubs were hiring jujitsu coaches to slow down the ruck and do the wrestle, which is not what rugby league is.
“The good teams have certainly adapted to the new rules. They have adapted to them and the coaches have.
“The ones who were relying on slowing down the ruck, they can’t rely on that any more. … like everything, it will take time for the others to adapt.”
It was this last two comments particularly that raised my eyebrows.
https://www.canberratimes.com.au/story/7325625/nrl-battlers-must-adapt-to-rules-vlandys/?cs=14238
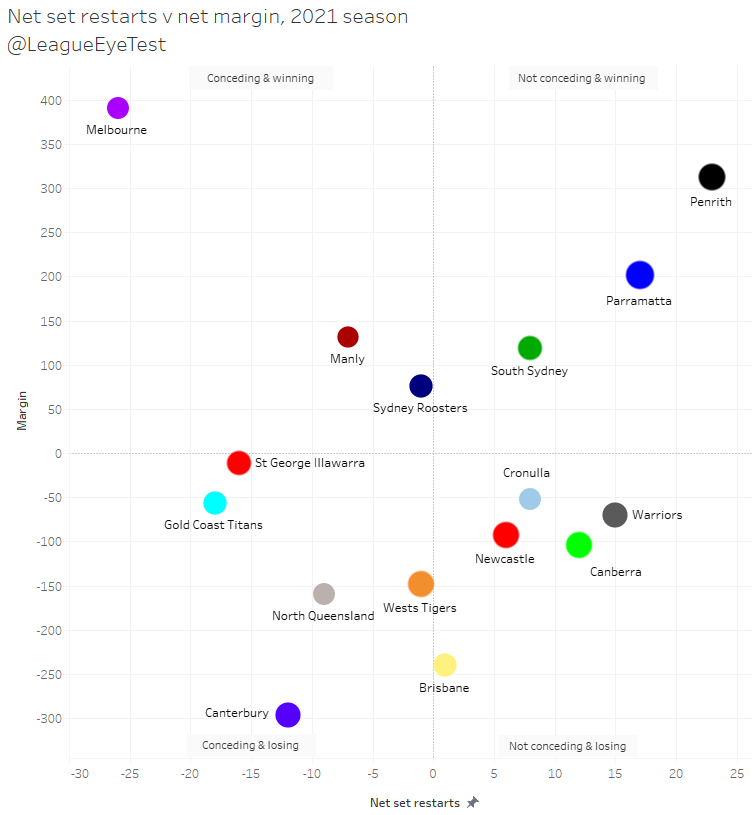
Regular Eye Test readers will know that Melbourne have the worst set restart difference in the NRL and are lapping the competition. They may not be doing it through slowing down the ruck, but as seen above they’re adapting to the new rules by continually shortening the defensive line.
The chart updated for Round 16 is below, and they still have the worst differential in the competition, not that it matters when you’re winning by 40+ every week. It’s getting into ridiculous territory now.
Friend of the site Death Row Rugby League posted some great stats to support the Storm situation over the weekend to show just how much they’ve “adapted” to the rule changes.
We know Melbourne has the worst net set restart difference in the NRL, and that is mainly because they’re conceding most of their set restarts on tackle tackles 0-2 inside an opponents area at a rate of 2.25 per game compared to 1.55 for the rest of the league. Where teams are in an attacking position, Melbourne concede right on the league average at 1.38 per game.
As Death Row Rugby League stated, it’s clearly a tactic and something the Storm are doing much better than the rest of the NRL.
But as Graham Annesley says, “It’s not like it’s having a massive impact on the game”. Judge for yourself…
Another sneaky Storm recruit?
Continuing on with the Melbourne theme, whether you agree or disagree with their stretching of the rules, one thing everyone can agree on is that their recruiting and development is light years ahead of the rest of the league.
This year they added Reimis Smith from the Bulldogs and George Jennings from the Eels, the latter of whom was so highly valued that he was loaned out the Warriors. And now they’ve signed another Canterbury back, Nick Meaney for 2022.
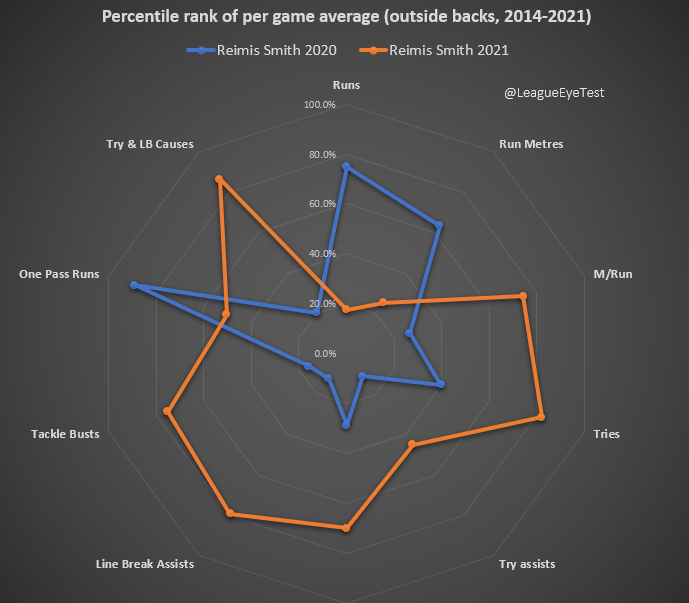
Smith’s turnaround has been incredible, even more so when you look at how this season compares to last season. The Bulldogs were using him mainly to gain metres early in a set after a kick, with Smith in the 89th percentile of all backs since 2014 in one pass runs. His runs per game average was nearing the 80th percentile as well.
Fast forward to 2021 and he’s hovering near the game’s elite – 84th percentile in tries per game, 81st percentile in line break assists per game.
The change for Smith also shows how a lot of rugby league defense is intertwined and impacted by those around you. Last season he was in the 20th percentile for try and line breaks caused per game, surrounded by a very ordinary dogs side. In 2021 that has flipped to see Smith in the 88th percentile for try and line breaks caused, an elite number.
Jennings form has been similarly impressive, having scored just 13 tries in 30 games in three seasons with the Eels and Warriors. This season he has already crossed the stripe nine times in 14 outings. That difference can be seen in his radar chart comparison of 2020 and 2021, where his other statistics were very similar.

The main difference between this year and last year was Craig Bellamy’s ability to have his side in a position for Jennings to attack the line or put someone else over it.
Meaney arguably has shown more than either of the two players had before joining the Storm in his short time in the NRL, and it will be very interesting to see what improvements he makes under Bellamy next season. It helps when you can identify young talent before they’ve peaked and not pay overs for them, leaving larger parts of your salary cap for genuine star talent in the prime of their careers.
Late edit: In the whirlwind that was the last week in rugby league, I’d also neglected to mention that the Storm have also signed Xavier Coates, who may end up destroying some try scoring records next season. Again, one team knows how to recruit and the rest are playing catchup.
If you enjoyed this post please consider supporting The Rugby League Eye Test through one of the links below.
Scan the QR code or copy the address below into your wallet to send some Bitcoin to support the site Scan the QR code or copy the address below into your wallet to send some Ethereum to support the site Scan the QR code or copy the address below into your wallet to send some Litecoin to support the site Scan the QR code or copy the address below into your wallet to send some Bitcoin cash to support the site Select a wallet to accept donation in ETH BNB BUSD etc.. Donate To Address
 Donate Via Wallets Bitcoin
 Ethereum
 Litecoin
 Bitcoin cash
Support The Rugby League Eye Test
Support The Rugby League Eye Test
Support The Rugby League Eye Test
Support The Rugby League Eye Test
Donate Via Wallets


1 Response
[…] work done by independent stats nerds (I use the term endearingly) have already shown “fatigue” and “ball in play” to be […]