
“We stayed in the contest when they certainly had all the field position and a lot of ball.
“We just couldn’t get any good field position. We were attacking from the back of the field at some stage and making some good yardage – but it was too far to go.”
The above comments came from Wayne Bennett after his South Sydney team lost the 2021 NRL Grand Final to Penrith 14-12. The Rabbitohs were constantly under pressure from the Panthers, with Penrith forcing five drop outs to zero by their opponents. Yet they had a chance to tie the game with a late conversion.
Thanks for reading The Rugby League Eye Test. Subscribe below to receive new posts in your inbox
It was a testament to the Rabbitohs defense, which had looked shaky at times during the season. Given their 53% share of possession, and repeat sets earned, should Penrith have scored more points given their domination on the field? Did Souths have too far to go?
Just having more possession isn’t an indication of dominance. The Tigers had 51% of possession in their 38-0 loss to The Bulldogs in Round 25. Being safe with the ball isn’t an indicator of success either. Canterbury were first in the NRL last season with an 80% completion rate and the Sharks were third at 79%. The Roosters and Manly were 15th and 16th at 75%. Their final ladder position doesn’t correlate with those positions.
If you’re enjoying the posts on this site and want to support independent rugby league content, please consider donating to The Rugby League Eye Test of a value of your choosing via the link below.
Knowing this, if you can’t use completion rates or volume of possession, how do you determine if a team had “better” field position, or made the most of their possession? What if we could assign a number to field position and possession which could indicate how valuable it was and a team was over or under performing?
Enter Eye Test Expected Points.
Methodology
“Remember that all models are wrong; the practical question is how wrong do they have to be to not be useful” – George Box
Before getting into the details, I’d like to state this is pretty much Version 0.1a of this model. In my mind it is quite basic and only taking in several different variables and could be significantly improved upon moving forward with better modelling of these variables instead of assumptions. I’m sure there’s people at clubs who are smarter than myself and doing something similar significantly better. Again this is what I feel is a very simple but useful model for evaluating field position and effectiveness of possession.
This isn’t a single catch all metric that will solve rugby league (it’s not possible), it’s a general model that will support a number of different analysis. Again this is what I feel is a very simple but useful model for evaluating field position and effectiveness of possession.
The idea of Eye Test Expected Points (which I’ll be shortening to ETxP for the rest of this post) is to assign a value to possession at any spot on the field and track how teams over or under perform based on that value. Football fans will recognise it’s similar to XG (Expected Goals). It’s not perfect, there’s plenty of things I could use in this model (see below) but for now I’m not going to let perfect be the enemy of good and move forward with essentially an alpha version.
Using six seasons of National Rugby League (NRL) location data (seasons 2016-2021), I’ve broken down the playing field into 450 distinct geographic zones of 4x4metres. Within each zone, the probability of a type of score (try, penalty goal or field goal) is then calculated based on the current tackle count, creating thousands of distinct game “states”.
The start of “play” during the game – a kick reception or a play the ball, for example – based on the area of field, tackle number and minute of play is set as a game state. An example would be if Melbourne had a play the ball on the 5th tackle, 10 metres out from the opponents tryline, 10 metres in from the right side of the field in the 55th minute.
Each of these game states has its own distinct probability of scoring, which is then used to determine the value of the that field position and situation. The value of a successful field goals and penalty goals should be self-explanatory (either 1 or 2 points). However for tries, instead of using the full six points I’ve used 5.5 as the value of the score, under the assumption that teams will kick 75% of their conversions.
Going back to the previous Melbourne situation, 10 metres out, 10 metres in from the left touchline, fifth tackle and and 55 minutes played, the probability of scoring a try in this game state is 11.7%, meaning the expected points from this particular play under this model is 0.64. The probability of scoring from the same spot on the field during the same minute, but from the first tackle instead of the fifth is 7.3%, which gives an ETxP value of 0.40. The difference is due to the probability of scoring on the first tackle is much lower than scoring on a tackle later in the set.
Previous version of this model were regressions based on X metres from the goal line by tackle and minute. Unsurprisingly, the closer you are to the goal line, the more expected points you’re likely to score, which somewhat fits a linear model as you can see below.
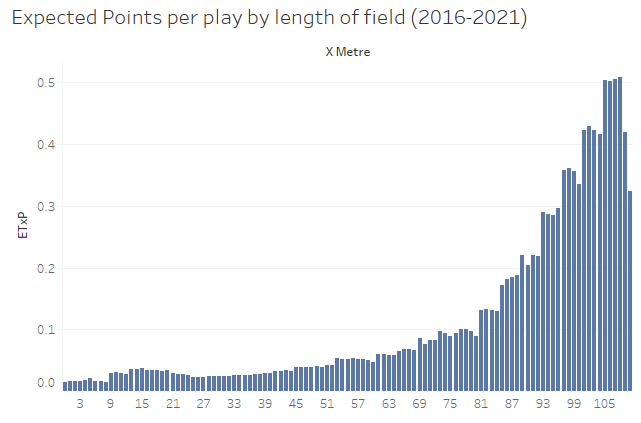
Originally, I’d tried to do 1x1m or 2x2m zones, however the incidence of each tackle within some of those zones were so small that they either had high probabilities on small sample sizes, or so few incidences of a possession starting in that zone that the Expected Points was zero. The latter occurred in some wider positions inside an opponent’s half, which felt counter intuitive, and resulted in some very low probabilities and thus expected scores. Eventually working up to 4x4m zones provided the best balance between granularity and sample size for probability.
Whilst that captured the probability of scoring X metres out on a specific tackle, there’s a limitation. Unlike the NFL, you’re not always playing the ball from the middle of the field and this can affect how a team sets up its defense. To account for width I wanted to look at how many metres infield a team was as well as how far away from the try line they were. An opponent playing the ball 5 metres out on the right touchline is an easier task than defending 5 metres out in the middle of the field, as you can use the touchline as an extra defender and players need to move laterally both ways.
Knowing this, I wanted to create a model that captured that and put more emphasis on the width of a play to see if that factors into scoring. Hence the addition of Y metres to create the above 4×4 geographic zones. Looking at the chart below you can see below the average expected points from any play (regardless of tackle) starting any width below isn’t consistent or linear, which is another reason why I moved to the zone method.
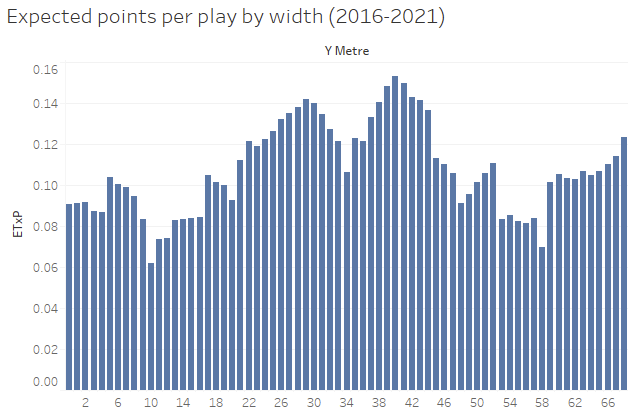
When looking at the above chart, keep in mind this is the position of the play start, not where the try was scored. Finally, there’s also a factor applied based on the minute of the game, since teams are unlikely to score in the first minute of either game and I wanted this model to reflect that.
Bringing this all together, you can see on the chart below the probability of scoring any points based on the zone of the field the previous play originates from, irrespective of tackle. Dark red represents a low probability and dark green represents a high probability (teams are assumed to be running left to right).
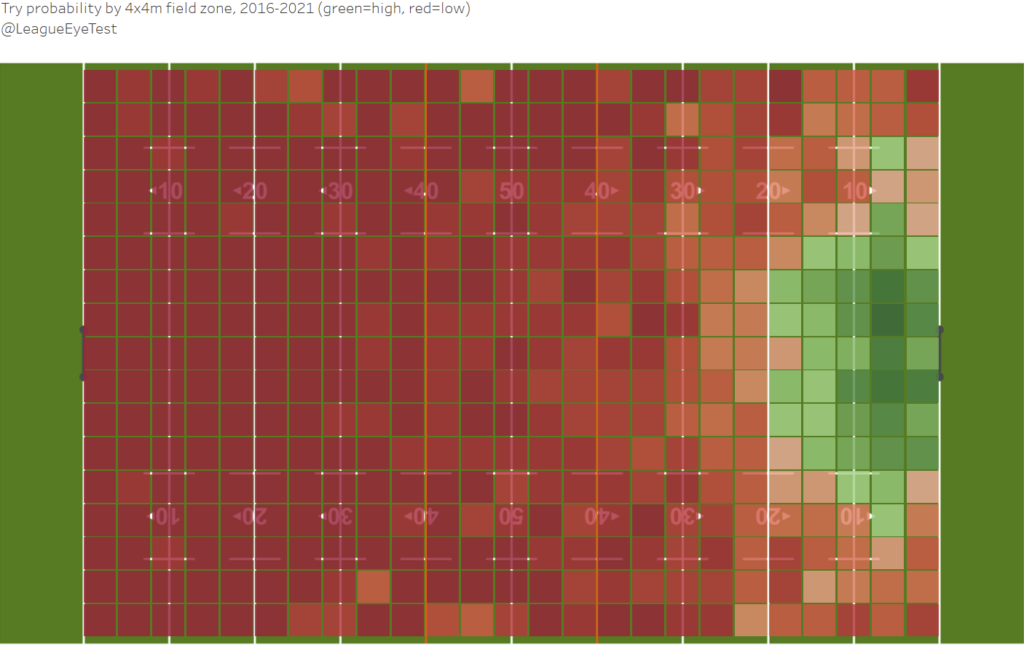
Unsurprisingly the likelihood of scoring is much higher in the middle of the field where defenders must follow the ball both ways. As a side note there’s a slightly higher probability of scoring when starting on the on the right edge of the field than the left, but not a statistically significant amount.
One thing that I’ve strayed from is calculating the Expected Points from a set, looking at the Expected Points from an individual “play” as a game state. The thought behind this is to look at the probability of scoring from a play in that exact situation, not necessarily the start of a set or at that point in a set. This allows for a deeper level of analysis by looking at performance on a specific tackle – we could compare how many points Penrith would be expected to score on 3rd tackles compared to league average or another team. Finally, the increased number of set restarts awarded has blurred the lines between sets and into longer continuous possession, rendering analysis by sets less useful.
Application of Eye Test Expected Points (ETxP)
One of the main reasons to head down this path stemmed from looking at completion rates earlier, which has been debunked as nothing useful by multiple sources including myself. This led to looking at whether more possession is better or not, which is usually is. However not all possession is “good” possession, and the scoreboard doesn’t reflect field position. Which brings us to where we are today using ETxP to analyse team performance.
There’s a number of ways we can apply this model to evaluate team performance, the first is by evaluating a club over the course of a season. Comparing a team’s actual results with what would be expected of an average team with the possession they had is another way to evaluate how well a team is functioning. Some of it will come down to luck or skill, or probably both.
To start with, we’re going to look at a chart of ETxP “scored” plotted against “conceded”, and placed into four quadrants – very good, efficient, inefficient and very bad.
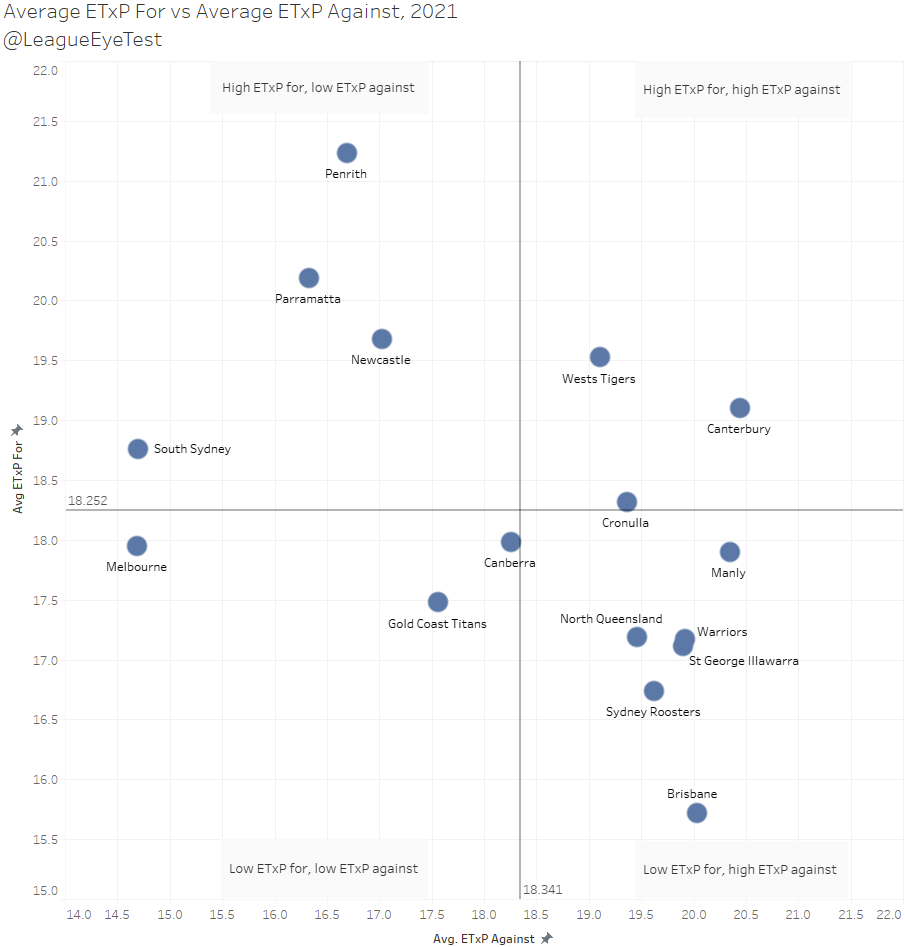
The top left quadrant is a high ETxP scored and low ETxP conceded, contains some of the usual suspects who performed well in 2021 – South Sydney, Penrith and Parramatta. Newcastle also sit in that zone, and given they were one of the poorest attacking teams ever to make the top eight, it indicates that they were weren’t able to convert quality possession last season.
If we move across to the right quadrant, high ETxP scored and high ETxP conceded, there’s three teams sitting in there. The highest are the Tigers, who had the fourth highest per game ETxP in the NRL last year, and like the Knights is a sign that they were able to maintain good field position but not get anything out of it.
The obvious outlier here is the Bulldogs, who managed sixth(!) in the NRL in 2021 based on average ETxP for. Initially this looks wrong and made me question the model completely. After digging into the data their results it became clear that it wasn’t wrong and a reflection of Canterbury’s playing style. Again it is important to remember that ETxP is what an average team should have scored in this situation, and the Dogs of 2021 were very far from average. Their safe, risk free and predictable style of football was conducive to maintaining possession but not scoring any points. Being unable to execute with the ball due to not having first grade halves might be part of that.
Looking at the number of times they were ahead at the end a game by ETxP, their record in those games was 3-9. This means they lost 9 games in which they had higher value field position. Again to clarify this, Canterbury weren’t “expected” to win 12 games, an average team in their game situation had better field position. The fact they won nine fewer games than expected is an indictment of their terrible 2021 season where they couldn’t convert possession into points.
Whilst they were sixth based on “wins”, the Dogs were last in expected points against at 20.44 per game meaning they gave up the worst field position and possession in the NRL. That part of the model was more precise, and over all ETxP against is far more accurate defensively.
Whilst we can use the raw ETxP numbers to monitor performance, a better option is to look at that as a percentage above what the average team would have scored from the same possession. If you’re an NFL fan you could think of this as something similar to DVOA, (although I’ve not adjusted league average to 0%).
Below is the percentage of actual points scored over average ETxP for all sixteen NRL clubs in 2021. An easy way to think of this is that it shows who the most efficient teams are, scoring more points than their field position would usually yield (high end of the scale), and who are the most inefficent, allowing more points than their field position would usually allow (low end of the scale).
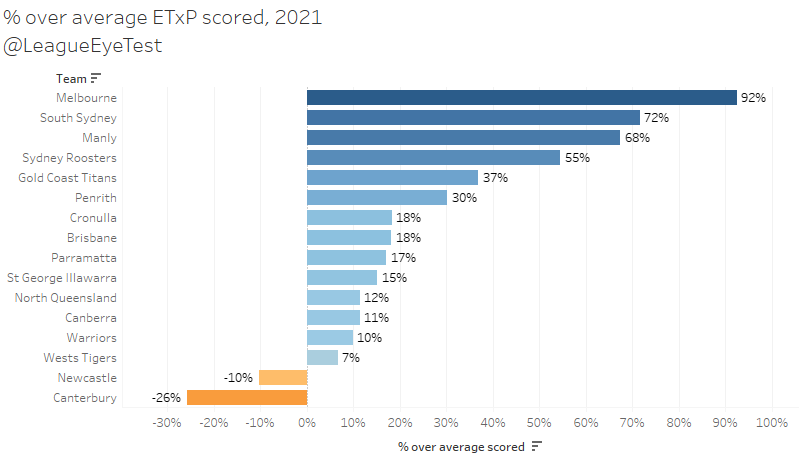
Unsurprisingly, Melbourne sat first for % over average, at a whopping 92% above their ETxP for the season. Given their huge wins and ability to score points from their own half of the field, it’s not a surprise they over performed by so much. They’re not alone, with South Sydney, Manly and the Roosters all at least 50% above average. This is mainly due to the vast number of one sided results in 2021 – there had not been a team more than 50% above average since 2016. In 2021 there were four of them and the previous high was +49% for the Roosters in 2019. Notch another one up for Vlandoball.
At the other end of the scale, we can see that despite the Dogs ranking sixth in raw ETxP, when you look at their actual performance they were the worst in the NRL at -26% against the average. The only other team with a negative value last year was Newcastle at -10%, which we broached earlier.
We can flip this and also look at how teams performed defensively. Here’s the same chart as above, but looking at percentage over average for actual points conceded against ETxP conceded. Similar concept as above – high end of the scale means teams are bad conceding more points than would be expected, low end are teams who are conceding fewer points than expected.
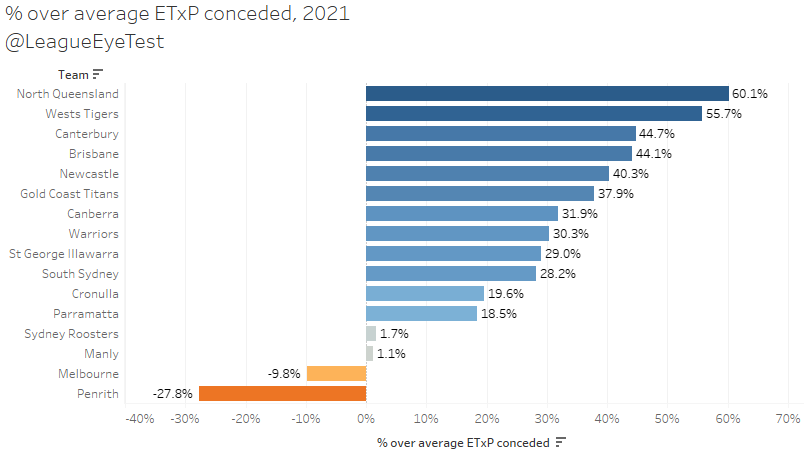
Since we’re looking at defense a higher number is worse, lower is better. Just two teams defended better than average last year – Penrith (-28%) and Melbourne (-10%). Manly and the Roosters were close to negative, at less than 2% each, as they were the only teams who gave up more set restarts close to their line and thus more high value field position. Another symptom of the high scores from last season.
The worst team for conceding over average last season was North Queensland at +60%, with Wests slightly behind at 55%. Newcastle again fared poorly, showing not only were they unable to convert strong field position, they also conceded far more points than they should have.
I mentioned that the 2021 numbers were skewed by the high scoring games last season, so to put them in perspective, here are the top and bottom 10 teams since 2016 for points scored as a % over average.
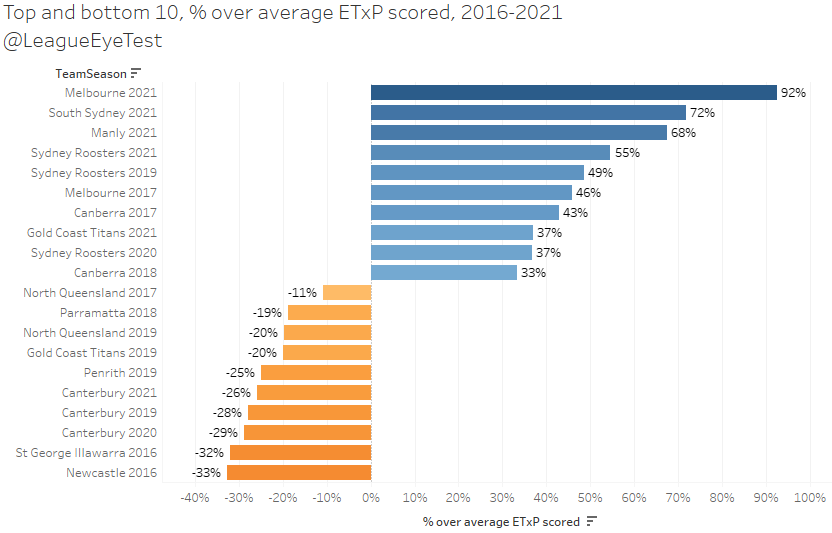
Teams from 2021 took the top 4 spots and the Titans also placed in the top 10. That’s half of the top ten spots from last year, as if I needed yet another data point on how one sided the 2021 season was. The previous best teams over average were the 2019 Roosters, 2017 Storm and 2017 Raiders. At the bottom end of the scale, the 2016 Knights and Dragons were the worst performing sides over that period. The Dogs were not much better, with their last three seasons raking as fifth, third and fourth worst over the last six years. Safe football doesn’t mean winning football.
Looking at the same data defensively, the worst defensive team in the past six seasons were unsurprisingly the 2016 Knights, at a terrible +70% points scored over ETxP average.
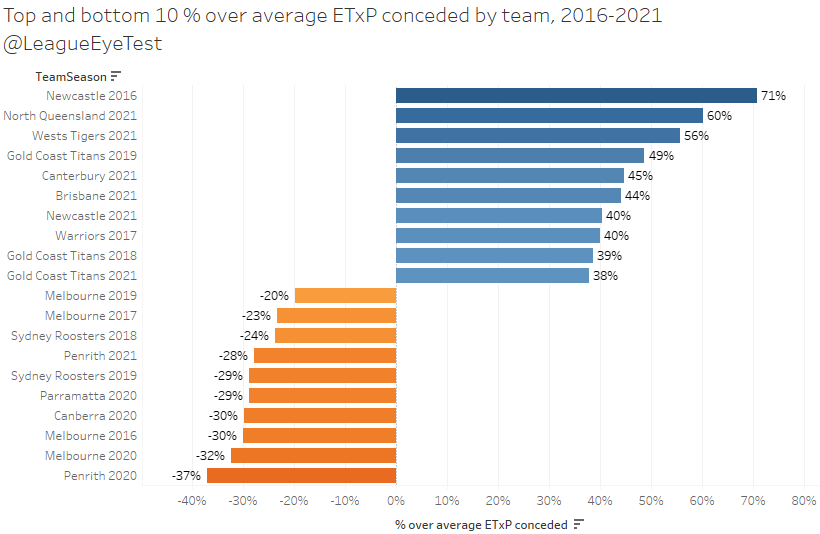
The 2021 Tigers and Cowboys fairing so poorly speaks to them allowing opponents to score points from low value possession. They’re approaching 2016 Knights level bad, which is not a good spot to be.
Another way of using this model is to look at single game performance. Going back to the quotes from Bennett after the Grand Final, looking at the chart below you can clearly see that Penrith had much “better” possession and field position than Souths, but didn’t convert and only scored 14 points compared to 20.37 ETxP.
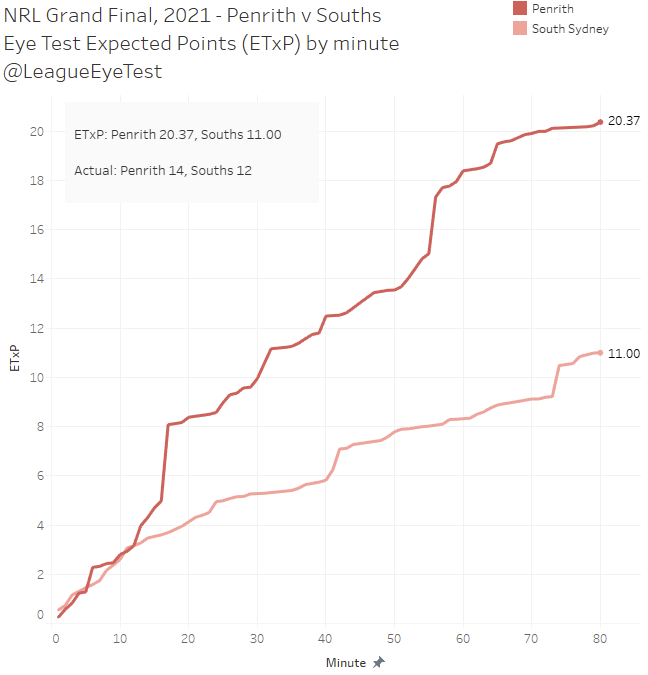
Souths field position was worth 11 points under the ETxP model, given their possession and field location, and they ended up with 12. This would indicate that despite Penrith having a significantly more and better possession, Souths’ defense was strong in this game and was one of the reason they were able to stay less in the game for so long despite facing a mountain of attack.
Generally a team with a higher ETxP than their opponent won around 63% of matches in 2021 and over 62% over the past six seasons. This indicates that strong field position does play a part in success, but doesn’t guarantee a win alone.
What ETxP doesn’t tell us
There are some obvious drawbacks with this model and how we’re applying it. It’s not a perfect model by any means, but is still useful enough to fuel some analysis and insights. As always I’ll mention “The Art of Being Less Wrong” which is a mantra this site lives by. Don’t let perfect be the enemy of good.
What are these issues with this model and how we’re applying it?
The first is that it’s descriptive and not predictive. We can’t predict results from it. It will tell us why something happened, but not whether it will happen again.
Secondly, because we’re basing ETxP off each individual play, teams that score early in tackle counts aren’t rewarded as they’re missing the cumulative value of more tackles. This is one area that looking at ETxP by set value rather than discrete plays would solve. However, as we saw before when you compare actual points scored with ETxP, you gain an understanding of which teams are outperforming their field position.
Teams that score from long range or long kicks are also under indexed. As mentioned above the probability of scoring from a play 40m out is much lower than 10m out. Teams such as Penrith are extremely adept at taking an attacking kick from 30-40m and placing it right on the goal line. Those sorts of plays are not factored into this model as we’re looking at the origin of each play.
Due to these factors, high scoring games aren’t reflected well in this model unless it comes on the back of high volume and sustained quality field position.
Melbourne annihilated the Tigers in Round 15 last season 66-16, however by ETxP the score was 27.0-18.1. Due to so many tries being scored early in tackle counts or from long range, it’s impossible to model those types of scoring events under this structure.
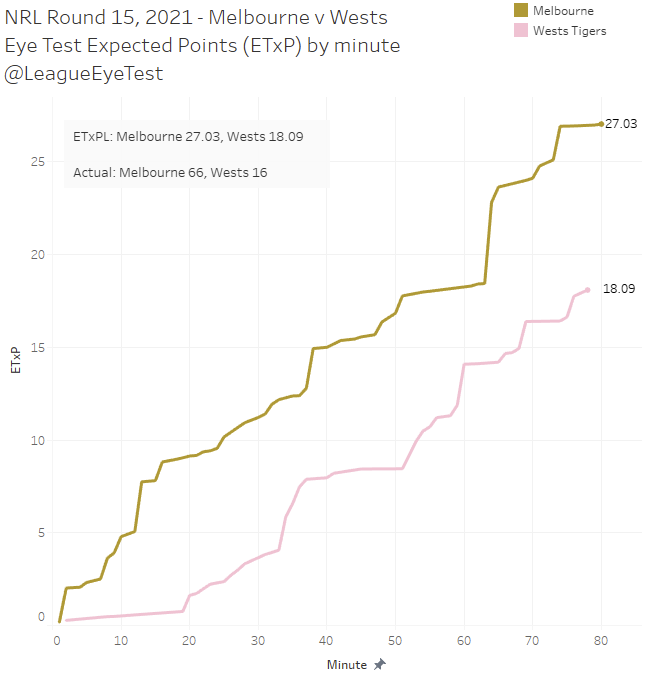
Although if you do look at the ETxP by minute below it does show just how dominant Melbourne were early on even if it isn’t reflected in their total Expected Points. The Tigers barely had any possession in the first 20 minutes which you can see from the very gradual increase in their line below.
Another downside with how we’re applying this model is that teams that can consistently defend their own line well will suffer by yielding high value possession. Manly and the Sydney Roosters are two that fall under this category, and no surprises that they were also using set restarts in 2021 as a way of consolidating their try line defense. Any team that is happy to concede more possession in their own half is going to suffer under an expected points model like this. However when we compare performance against actual points conceded you can see that the Roosters and Sea Eagles defended that high value field position well.
There are also some results that look extremely closely but weren’t. Penrith v Parramatta in Round 25 2021 falls under this scenario. The Eels rested nearly their whole first grade squad in preparation for the finals and lost 40-6 to the Panthers. However, if you look at the ETxP for this game, Paramatta actually came out ahead 20.8 to 18.5.
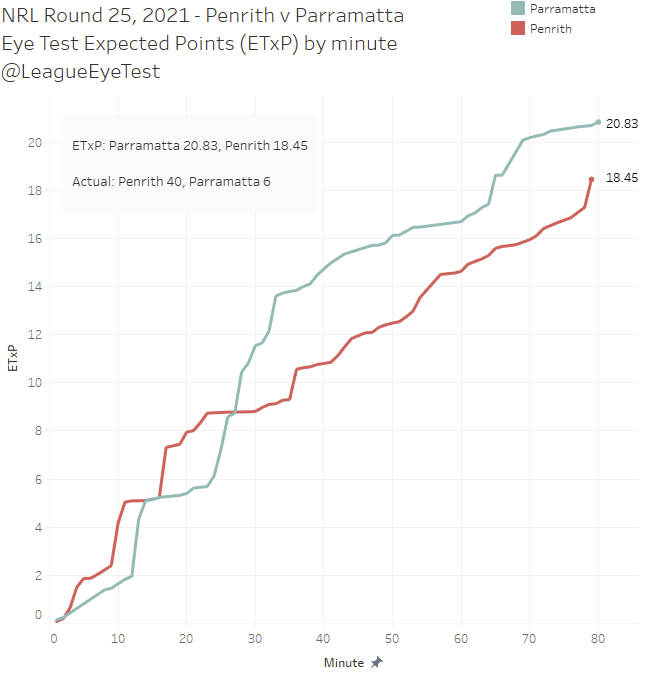
Not to harp on this point, but that doesn’t mean that the Eels should have won the game. The reason for them being ahead is mostly due to the Eels having 49% of possession and 44% of territory, something unusual in a one-sided beat down. The Eels actually won the first half for possession (52%) and territory (52%), which points to Penrith’s defense holding up and their attack firing, mostly from long range during this game. They had better possession, but couldn’t make anything of it whilst Penrith were able to score from the very limited “high value” field position they held.
Further improvements
This was stated earlier but the ETxP is very much a 0.1 release, almost a proof of concept or an alpha release. The results look encouraging, and we’ll be using this metric on the site in a number of ways in 2022 to evaluate which teams are tracking above or below expectations.
There is still plenty of room for improvement. The top things on the to do list are to incorporate the impact errors and kicking have on ETxP, as well as points scored during the game and margin. The latter is important as teams ahead on the scoreboard are likely to play a more conservative style when leading, although 2021 didn’t necessarily adhere to that.
Some weighting for long distance try probability in future revisions could be used to account for teams that score consistently from their own half like Melbourne. Other possible variables include location (home/away), weather, ladder position and team composition. All of these could be improved with better data and more time, of which I have neither right now. It’s on the list of things to do, when or whether or not I get to them is another matter.
But for now, ETxP will be new for 2022.

Love this.
I do think that there needs to be a means of measuring or including interaction time during game and score difference.
This is a brilliant analysis, well done.
Your metric is looking at efficiency and the naked eye can see that Penrith are an efficient team moving down the field well using kicks to claim territory and great defence to create high value field position. The naked eye can also see that the Panthers do not have the explosive speed and creativity to score tries from anywhere like Manly or Melbourne. Can you use your data to analyse which teams have the “X factor” that means they score more tries from the low probability 4×4 areas inside the 60m zone (or halfway, what seems to make sense)?
This also applies to defence. What teams scramble well and stop teams like Manly scoring length of the field tries. The “desire factor”. “You shall not pass”.
I would expect to see Manly, the Roosters and the Storm loaded up with X factor tries and the Panthers to have very little X Factor. I would also expect teams like the Storm and the Panthers to have plenty of “desire factor”. They don’t concede too many long range tries because they scramble so well.
Add your efficiency score to the X factor and the desire factor and it might explain where teams finish on the table.
Anyway, just a thought. Oh and congratulations on a brilliant website! I love your work
Well done on the analysis. Impressive. A few questions…
1. Where did you source your location data from?
2. Are you doing any modelling on the ETxP metric to predict margin of victory (MoV) for future games? It would be interesting to see if a seasonal average ETxP is a better or worse predictor of MoV than an exponentially smoothed ETxP.
3.Have you any thoughts on how you would integrate team changes into expected future ETxP values? I imagine if you developed a reliable on-field player production metric and expressed this as a % contribition to total team pts then you could forecast a change in future ETxP values based on team changes for upcoming matches.