
In last weeks trends and notes post, I showed there was a negative correlation between set restarts and margin, which had been positive from Round 3 to Round 7. With another week of matches completed, I thought I’d dig a bit deeper into this to see if I could find out what was leading to this.
The reason I find this so interesting is that it doesn’t conform with traditional rugby league thinking. Possession is treasured, and statistics like run metres correlate with winning games (keep in mind correlation doesn’t equal causation). Yet by giving away more set restarts, you’re giving possession and therefore more metres to the opposition. Surely that would result in giving up more points?
Thanks for reading The Rugby League Eye Test. Subscribe below to receive new posts in your inbox
Looking at net margin plotted against net set restarts after Round 9 shows a similar chart to last round. I’ve named the quadrants as well to make it easier to identify what the chart is showing and the bigger the dot the more set restarts conceded.

As with last week it appears that “winning” the set restart count is inconsequential, with only two teams having any significant net margin despite coming out ahead with set restarts. The top left quadrant – “Conceding and winning” – is the one I want to focus on though, given the makeup of teams within that area.
Last week there was only one top four side in that top left quadrant, which was the Panthers. This week they’re joined by the other top four sides – Melbourne, Parramatta, and the Roosters – indicating that giving away set restarts is a genuine part of their strategy. And that is only counting the set restarts given, not intentional slowing down of the ruck that isn’t called.
The Panthers are a curious case. Penrith not only have the largest difference between set restarts conceded and awarded at -23, they have also conceded the most in the NRL at 43 and been awarded the fewest at 20.
I noted last week that the only time they’ve come out ahead in set restart differential (Round 6 against the Eels), they lost by 6. This continued in Round Nine, with Penrith conceding three more set restarts than Cronulla, yet still beating them by 32 points.
In addition to the Panthers, among the other top four sides, the Roosters have the second fewest restarts awarded (23), the Storm are third fewest (24), while the Eels sit seventh (27).
With the limitations on publicly available data it’s hard to see exactly why they’re benefiting from these restarts, but we can use what is available to craft some ideas. One theory is that the early set restarts that are in vogue help the defensive team get set, limit chances for the team with the ball to gain momentum and exploit any breaks in their line.
A way of quantifying this is could be by examining the amount of runs under and over 8 metres conceded against the raw number of set restarts. As a team concedes more set restarts, there is a small positive correlation with runs shorter than 8 metres conceded (top of chart below), and a small negative correlation with runs longer than 8 metres (bottom of chart below).

Given this correlation, you could assume that the more set restarts you concede, the more likely you are to give up shorter, ineffective runs than longer more damaging runs.
This makes sense – giving up a set restart on the first or second tackle on your opponent’s 20m line and contain them within their own half is preferable to allowing them to string together a number of longer runs and push into your territory for an attacking kick or set piece. It also enables teams to maintain a defensive structure and limit any gains from broken play.
Examining when set restarts are given and the outcome of the consequent set compared to the average set would show if this is successful or not, but again we’re limited by publicly available data.
On the other end of the scale, the Bulldogs position on this chart is just another sad indictment on their run under former coach Dean Pay. They play a very conservative brand of football, limiting defensive mistakes and (attempting to) maintain possession and complete sets. As much as he has been able to get his players to show up every week under trying circumstances, this style of play hasn’t yielded any results and the constant switching of combinations appears to be actively hurting their performances. And let’s not even talk about the Queensland sides.
I’m not arguing that conceding another set of six to their opponent is the reason that the top four sides are sitting where they are. But there is something in the new ruleset for rugby league that is widening the gap between the haves and have nots.
At a surface level there’s a minor increase in win percentage if you lose a set restart count. Removing drawn games and even set restart counts, teams who had a negative set restart differential have won 56% of their games this season. In Round 9, six of the eight games were won by teams with a negative set restart differential. The only teams that won with a positive set restart differential on the weekend were Souths and St George Illawarra.
Conceding more set restarts to your opponent isn’t going to win or lose games for you, but strategically conceding them appears to be part of the game plan for the successful clubs in 2020.
Adam Gee the six again king
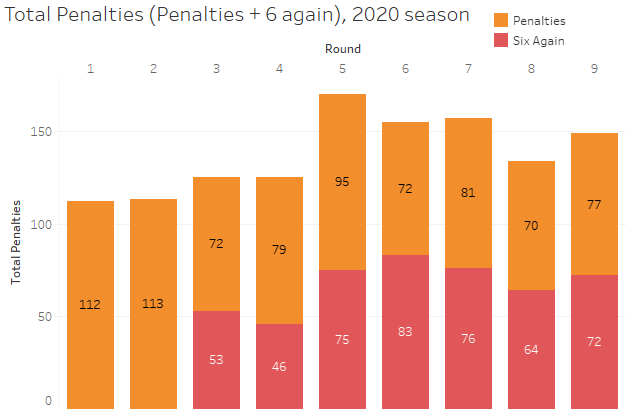
Each week as part of the notes and trends I’ll be posting the number of penalties and set restarts conceded by round and referee to see how teams are adapting to the rule changes. The biggest change was in Round 5 when it appears certain teams worked out how to game the system, which shouldn’t be any shock if you read the first part of this post.
This week we saw an increase in penalties and set restarts again, with an infringement being called every 15.9 play the balls in Round 9, down from 18.8 in Round 8.
It certainly seems like we’ve settled into a 9-10 penalties and set restarts per game. The breakdown of penalties and set restarts called by round is below.
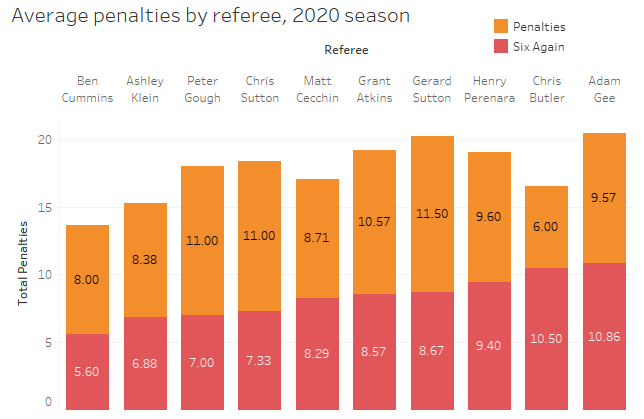
Moving on to set restarts and there’s one referee who seems to be leading the way in calling these infringements, as pointed out by @ReadingThePlay during Thursday night’s annihilation of the Cowboys by the Roosters
Last week I noted that Gee was one of the more prolific whistle blowers in the competition. He’s called nearly 11 set restarts per game since round 3, leading all referees. On the other end of the scale, Ben Cummings has only called for 5.6 per game. The below chart has the per referee average from Rounds 3-9.
The above tweet by ReadingThePlay prompted me to look into Gee’s games a little more to see what was happening, and the results met the eye test. Gee has blown at least eight set restarts in the first half of five games of his seven games this season, with the only two games below eight coming in Rounds 3 and 4. Keep in mind there have only been seven games with at least eight set restarts in the first half this year, meaning Gee owns 5 of those 7.
The wildest thing about Gee’s propensity for giving away six again is that his discrepancy between first and second halves is significant. Gee calls 7.6 set restarts in the first half, yet only 3.3 in second halves. This isn’t unusual as most referees award fewer penalties and set restarts in the second half, but none at a 2:1 margin. The closest would be Gerard Sutton who calls 5.5 set restarts in the first half but only 3.2 in the second.
If you can see Gee listed as the official, be prepared for a barrage of them early before he puts the whistle away in the second half.
Points Responsible For (version 2.0)
If you have been following my personal twitter account (@carlosthedwarf_), you may have seen me post some data on Points Responsible For (PRF). I’d seen this used for NBA players, adding together their own scoring with points from assists to combine a total number of points that they were involved with, showing how much impact playmaking in addition to putting the ball in the basket.
It felt like something that could be translated to rugby league but with challenges, as point scoring is rare and it is not always the player who set up a scoring opportunity that is awarded the try assist.
Initially my calculation for PRF was Tries + (Try Assists *4) + Field Goals, but recently I’ve rethought that based on a few things including the following tweets from the fantastic Clear The Obstruction.
The above video and rationale have led me to include Try Contributions as well as Try Assists in PRF moving forward. The main reason is that as stated in the tweet, Scott Drinkwater would not have received any attacking statistic for the above pass which helped set up the try. The use of Try Contributions rewards the involvement of a player like Drinkwater.
This means the updated formula for Points Responsible For now sits as Tries + (Try Assists *4) + Field Goals + (Try Contributions * 4), which I feel better represents the offensive impact of a playmaker than before. It may not be perfect, but I feel more confident with it.
The other thing I want to point out is that I’ve deliberately not included any goal attempts as they are largely a factor of tries scored. If they were included the list would be topped by Kyle Flannigan and it would be unlikely that a non-kicker would ever show up due to lack of opportunity. Field goals are included theoretically anyone could kick them. Well maybe not Ash Taylor.
With the theory out of the way, here’s the top 20 by PRF per game so far this season sorted by per game average, with a miminum of four games played.
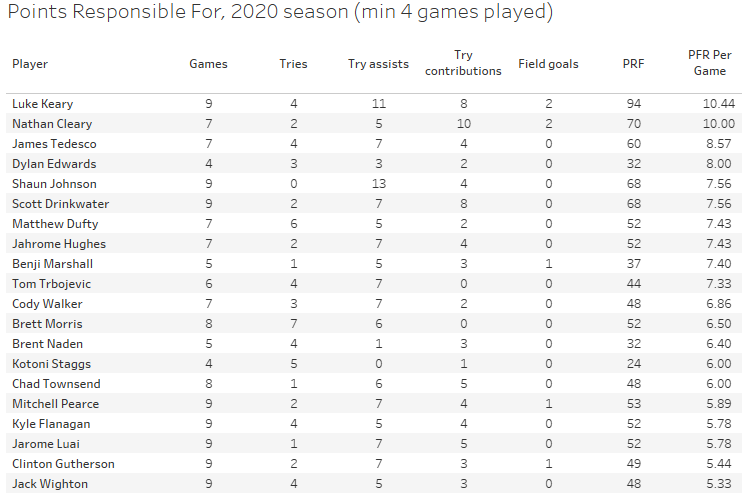
Using the Drinkwater example, without try contributions he’d average 4.0 PRF per game, and sit outside the top 20. Including it, he jumps up to 7.56 PRF per game and sits sixth, a better representation of how important he has been for the Cowboys with the ball. Luke Kleary and Nathan Cleary also benefit from including try contributions as their sides have been running up huge scores in 2020.
The two other things that stand out from this list. The first is just how important Shaun Johnson is for the Sharks, sitting fifth despite not scoring a try all season. Yet there were still calls as recently as a fortnight ago calling for Matt Moylan and Chad Townsend to be the Cronulla Halves. The other is how much of a spark Matt Dufty has been for the Dragons, sitting seventh in PRF per game with six tries, five try assists and two try contributions. There’s no argument that the Dragons have looked much more dangerous with him on the field and his passing has played a huge part in their recent turnaround in form.
If you enjoyed this post please consider supporting The Rugby League Eye Test through one of the links below.
Scan the QR code or copy the address below into your wallet to send some Bitcoin to support the site Scan the QR code or copy the address below into your wallet to send some Ethereum to support the site Scan the QR code or copy the address below into your wallet to send some Litecoin to support the site Scan the QR code or copy the address below into your wallet to send some Bitcoin cash to support the site Select a wallet to accept donation in ETH BNB BUSD etc.. Donate To Address
 Donate Via Wallets Bitcoin
 Ethereum
 Litecoin
 Bitcoin cash
Support The Rugby League Eye Test
Support The Rugby League Eye Test
Support The Rugby League Eye Test
Support The Rugby League Eye Test
Donate Via Wallets


3 Responses
[…] The top four teams in the NRL — Parramatta, Melbourne, Penrith and the Roosters — have each conceded more set restarts than they have earned, a fact spotted this week by keen rugby league watchers. […]
[…] The top four teams in the NRL — Parramatta, Melbourne, Penrith and the Roosters — have each conceded more set restarts than they have earned, a fact spotted this week by keen rugby league watchers. […]
[…] The highest 4 groups within the NRL — Parramatta, Melbourne, Penrith and the Roosters — have every conceded extra set restarts than they’ve earned, a reality noticed this week by eager rugby league watchers. […]