The statistical improvements that back Todd Payten’s Cowboys appointment
The North Queensland Cowboys announced interim Warriors coach Todd Payten as their coach for 2021 on Friday, and using the Eye Testtm it’s easy to see why. The Warriors have improved on the field under his watch and are showing a lot more enthusiasm and commitment, even after a coach they supported was removed. Their fightback against the Eels showed a desire that Warriors sides haven’t shown late in a game for quite some time.
This led me to have a look at what changed under Payten and how the Warriors improved under his tenure by looking at the teams per game statistical averages under Kearney compared with Payten’s performances.
First up I’m going to qualify everything below with a small sample size disclaimer – we’ve got six games for Kearney and eleven for Payten to analyse. These aren’t representative, more they are indicative of their performances, but within those games there are hundreds if instances of runs and tackles which gives me some comfort. It’s not like I’m writing an article purely on the win/loss percentages of teams where one win or loss would throw out my premise completely. But I digress.
Below is a chart of the percentage change for a number of statistical categories for the Warriors in 2020, with te blue dots represent the percentage difference between Kearney and Payten, and the orange dots represent the difference between Payten and Kearney. The further the circle is to the right or left, the larger the difference. Whichever colour sits on the right-hand side shows which coach had an advantage in that area, and at first glance you can see by the number of organe points on the right hand side that Payten has outperformed Kearney in the majority of these statistics.
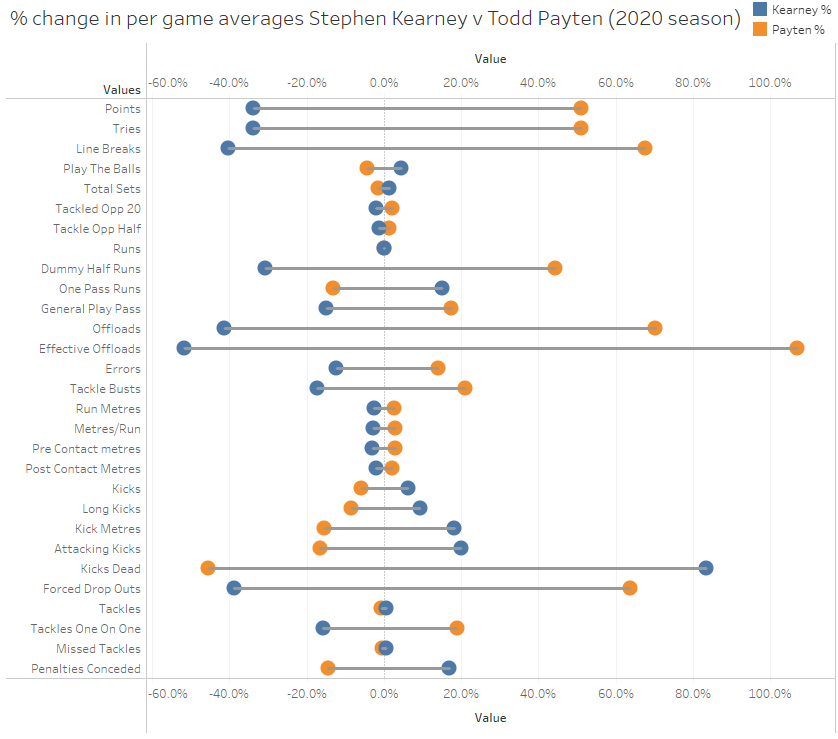
I wanted to note that I’ve chosen percentage change because on a per game basis it’s hard to get a scale that fits average total run metres in the thousands (1400m+) with average metres per run in single digits (8.5-9.0). Otherwise it would be impossible to see some of the changes. Another reason, which if you’re becoming familiar with my posts you’ll know, is that the exact number isn’t as important to me as the size or direction of the trend. I’m looking for how much things have changed under Payten.
WIth that out of the way, let’s delve in a bit deeper to the differences and start with the first line for points scored per game – the orange dot on the right shows Payten had an increase of nearly 50% in points scored per game, with the Warriors going from 12.2 under Kearney to 18.4 per game under Payten’s stewardship. Looking at from the other perspective, the Warriors scored 34% fewer points when coached by Kearney in 2020.
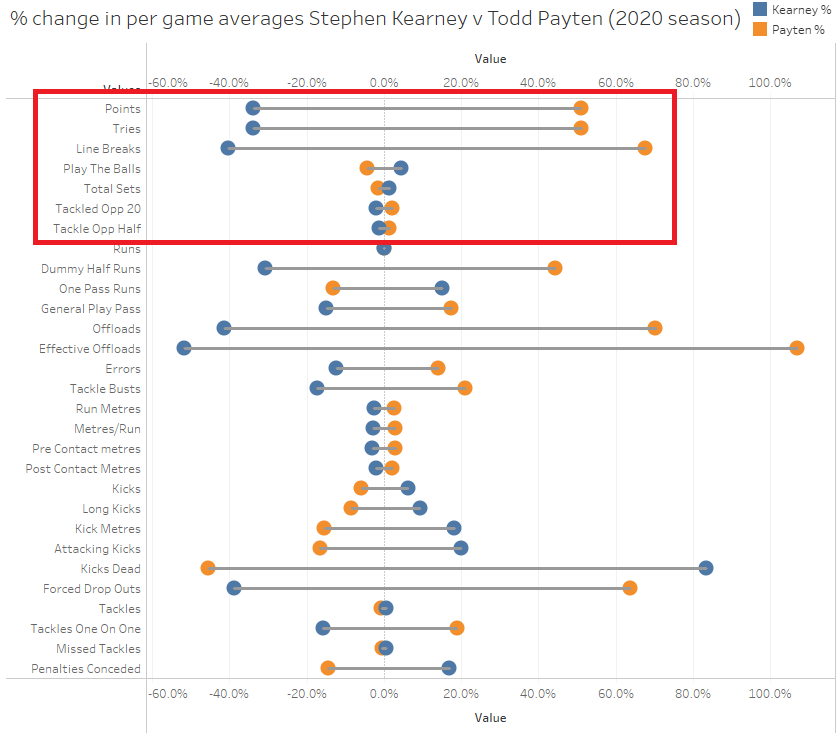
Tries and line breaks were also up significantly under Payten, whilst a possession statistics like play the balls and total sets were down between 1-4%. From this group of stats, you can see that not only were Payten’s Warriors scoring more, they were doing so with less possession. That is countered by the fact they had slightly better field position, as play the balls inside the opponents half and opponents 20 metre area were up 2% and 1% respectively.
The next set of stats I wanted to focus on were runs, run metres and passing. Both teams averaged the sane number of runs (168 per game), which makes a fantastic baseline to use.
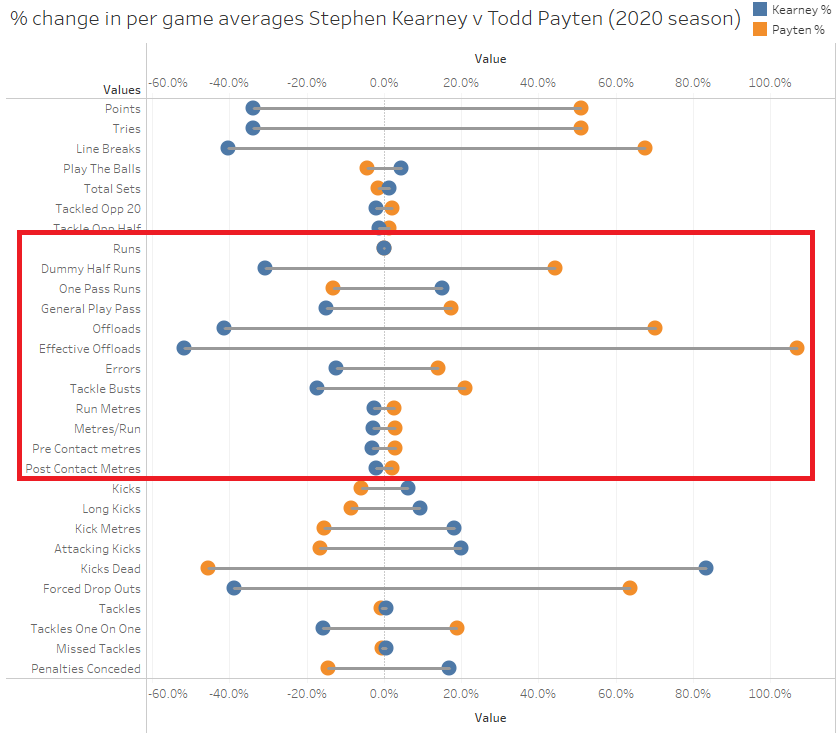
There was no change there from a quantity point of view but it’s very clear they’ve changed how they were running the ball, and its effectiveness. The first is that dummy half runs were up 44%, from 7.5 to 10.8 per game. One pass runs, your standard hit up, were down 13% under Payten, whilst general play passes were up 17%. The increase in passing wasn’t just mindlessly throwing the ball around either, as offloads increased dramatically after the coaching change, with nearly 70% more total offloads (6.7 to 11.6) and a triple figure percentage increase in effective offloads.
This would suggest that he has given his dummy halves more freedom, allowing them to skip out of the ruck and engage the line before spreading the ball wide, and the increase in passing stats shows they were playing a more expansive game compared to the safe conservative style under Kearney. He’s also unlocked their ability to promote the ball with offloads as well. Given these changes it is not surprising that they may have scored the try of the year against the Eels on the weekend.
Although as you’d expect, moving the ball around more often did create more errors, which increased by 17%, similar to the increase in passing but that’s just the cost of doing business to improve a teams attack.
On the run metres front, it’s a blanket increase of 2-3% under Payten, and the increases to Post Contact Metres could indicate players increasing their effort as they hit the line and trying to push through initial contact.
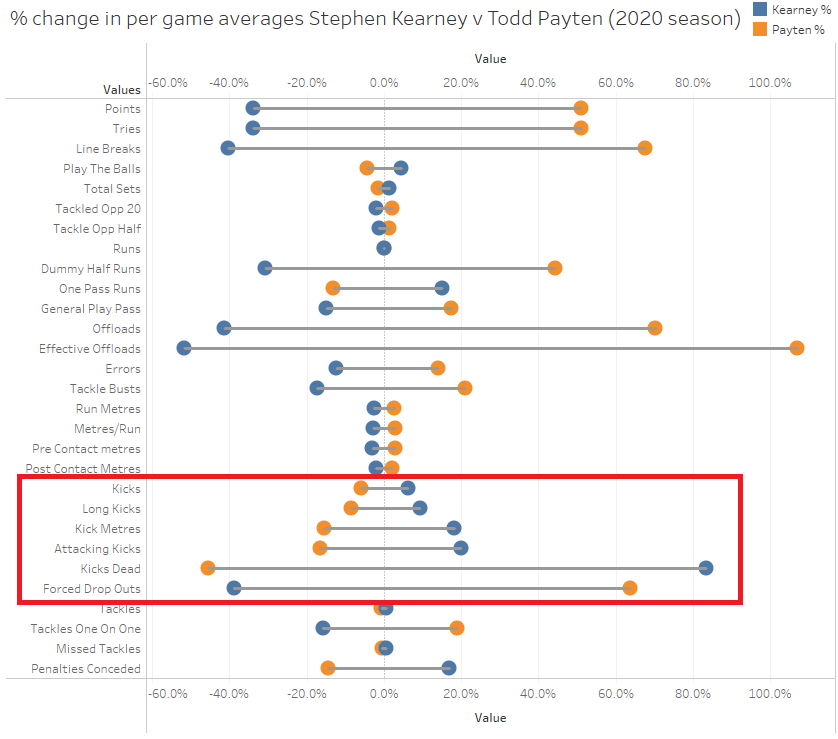
Finally, I wanted to look at how their kicking changed, which has seen a drop under Payten in total kicks and kick metres. This lines up with the above changes, showing the team passing the ball more and in better field position, reducing the need for long kicks (or kicking the ball at all) to end a set. Total kicks are down nearly 6% And when they were kicking, they are doing so more accurately and effectively – fewer kicks dead (down 45%) and more forced dropouts (up 63%).
Things have also improved defensively for the Warriors under Payten as well in a few key areas. Total run metres conceded are down 6.7%, post contact metres by opponents are down 9% and offloads have dropped 8.4%. Clearly Payten’s Warriors are putting more effort in defense, reducing opponents gains after contact, and wrapping up the ball carrier more effectively.
And Payten has achieved all of this with a similar line up to Kearney. If anything, you could argue he was dealing with a weaker hand – Ken Maumalo, David Fusitu’a, Agnatius Paasi and King Vuniyayawa all returned home mid-season. They were replaced with loan players like Jack Hetherington, George Jennings, and Daniel Alvaro, who have been fantastic additions but came without knowing the structures and combinations the departing players already understood. Despite these issues, their discipline has improved with 15% fewer penalties conceded per game.
The fact that he has been able to squeeze this extra performance out of a squad with significant challenges living away from their families is incredible. Next season he’ll inherit a stronger Cowboys squad that desperately needs a new direction and an injection of belief and creativity. Payten has shown in just 11 games so far this season that he’s just the man to deliver all three, and it’s encouraging to see North Queensland give him a chance instead of giving a problematic and divisive former coach another run around.
The Tigers back three saving their soft forwards
Last week I posted some analysis of the Tigers forward pack and how their inability to generate metres has been hampering them. Below is an update of the chart from that post updated for Round 17, showing the Tigers still have one of the weakest starting forward packs in the NRL for average metres gained.
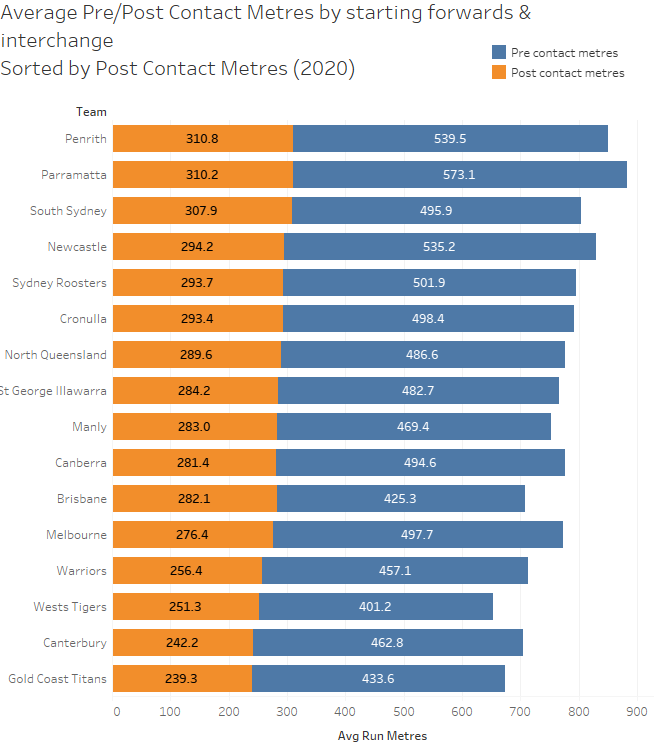
They’re still in the bottom three for post contact metres generated by their starting forwards and interchange players, but far more worrying is that they’re producing the least amount of pre-contact metres in the NRL. The next worst is the Gold Coast, who are averaging thirty pre-contact metres more per game.
One of the reasons the Tigers can get away with having such ineffective forwards is that their back three, and most specifically Adam Doueihi and David Nofoaluma who generate a significant amount of metres for them. This is nothing that you couldn’t have gleaned from using the Eye Testtm watching Tigers games but let’s put it in perspective by ranking metres gained by the back three (fullback and both wingers) compared to other positions on the field.
The below chart shows the percentage of a team’s average run metres this season by position groups – back three, centres, halves, starting forwards and interchanges. The length of the bar represents the number of metres, so you’ll see a few instances where the size of the bar looks smaller since it’s using percentages.

Looking at their run metres this way, you can see that the Tigers have the third highest percentage of metres from their back three at 31.29%, only behind the Roosters and Warriors. The top two makes sense when you consider how many metres both James Tedesco and Roger Tuivasa-Scheck gain over the course of a game. No other team is over 30%, with the Panthers the next highest with 28.42%.
This is the reason the Tigers can stay competitive but are struggling to play finals football (insert your own 9th place joke here). They lack the go forward from their pack to compete with the elite teams in the NRL, but get enough out of their back three to put away lower ranked compeititon. Until they start to push harder through the middle with their starting pack and bench they’ll be looking at the finals from the outside.
At the other end of the scale is Souths, who get just 21.43% of their total metres from their back three. Considering how rarely Latrell gets involved in their own half of the field after a kick that’s not unusual. Souths also have one of the highest percentages of run metres be centres, indicating that Dane Gagai, Campbell Graham, Braidon Burns and James Roberts were doing more work than the back three. Still even if you add together the percentage of run metres from positions 1-5 for Souths, they’d still only be slightly ahead of the Roosters back three alone (36.60% vs 32.82%), showing how much Souths rely on their middle forwards and interchange. I’m not getting drawn into the “Latrell doesn’t run the ball enough” meme because it’s reductionist and discredits the success Wayne Bennett is having.
Which referees have the highest scoring games?
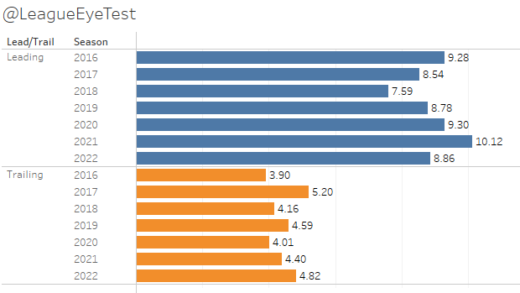
After posting some data on how the difference in ladder position affected points scored during a game in last week’s notes and trends post, this week I’ve had a request to look at the number of points scored under each referee and if ladder difference affects that total.
The graph below shows the average points per game scored under each referee plotted against their average set restarts, and the size of the point indicates the average difference in ladder position for games that referee has officiated.
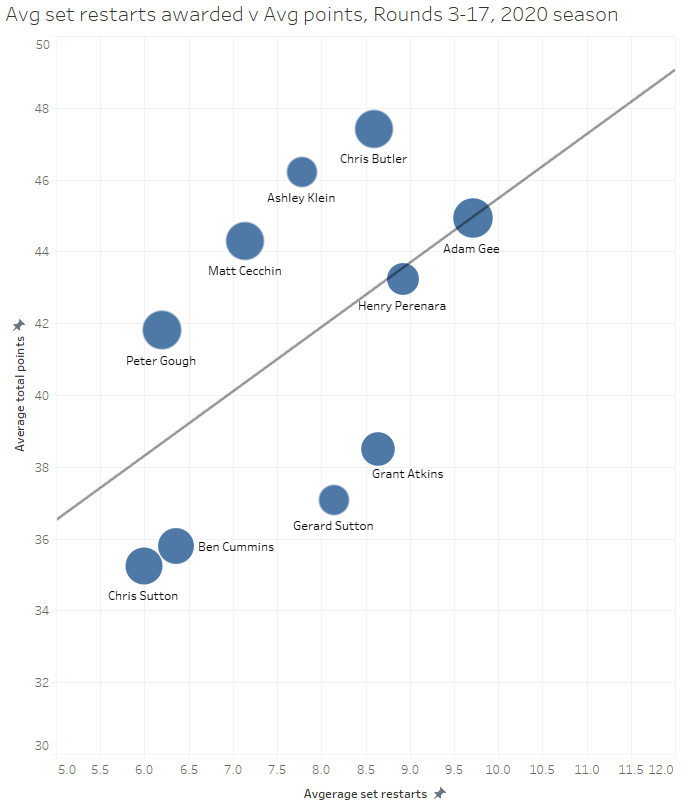
No surprises that there are more points scored as the number of set restarts awarded increases. Chris Butler tends to referee the highest scoring games, with a 47.4 average since Round 3. Chris Sutton and Ben Cummins tend to control lower scoring games, both with an average of 35 per game. Along with Gerard Sutton and Grant Atkins, they are the only referees whose games average under 40 points per game.
There’s not a huge amount of difference in the average ladder difference, ranging from 3.6 for Ashley Klein and 4.0 for Gerard Sutton up to 6.5 for Adam Gee. Butler, Matt Cecchin and Peter Gough are the only other two referees with an average ladder difference of 6 or more, giving you an idea who is being awarded the less appealing games.
What is notable is that despite having very similar numbers of set restarts awarded, and similar average ladder differences, is games officiated by Klein average 9 points per game more than those led by Gerard Sutton (46.2 to 37.1).

The other noteworthy point to come from this analysis is what happens when you look at the same points data but against penalties awarded instead of set restarts.
As you’d expect, there’s fewer points scored per game as the number of penalties increase, whether that is due to less time that the ball is in play or more penalty goals taken.
The same disparity between average points under Klein and Gerard Sutton stays true as well, with a 9 point per game difference despite a similar number of penalties awarded per game.
Which players are giving up the most set restarts?
To finish up this week I wanted to have a quick look at which player was giving up the most set restarts. The last time we looked it was Penrith’s Jarome Luai, so let’s see the top offenders after Round 17.

Manly hooker Danny Levi is currently the worst infringer in the NRL, giving away 14 set restarts in 14 games, one of a handful of players to average at least on per game and one of just eight players to have double figure restarts conceded. Jack Murchie from the Warriors is the only other player to average at least one set restart a game, with 10 in his 10 appearances this season (see next table for his stats).
The worst overall may be the Tigers Moses M’bye, with 11 infringements in his 14 games. However, if you consider how often he makes a tackle playing (mostly) in the centres, it’s actually significantly worse. Levi’s 14 comes at a rate of one every 32.93 tackles, whilst M’bye gives one away every 18.27 tackles. That’s the worst rate of any player who has given away at least six set infringements.
If we look at who is the worst by that metric, then M’bye isn’t the worst but he’s among them. Here’s the top infringers by tackles per set restart conceded.

The Broncos Anthony Milford has the dubious honour of being the most frequent set restart infringer, giving one away every 15.8 tackles. His Broncos teammate Richard Kennar places next with a rate of one transgression every 16 tackles, with Manly’s Brendan Elliot placing third with a rate of 16.25.
M’bye only places seventh by this calculation but given the volume of set restarts he’s conceded he’s in a league of his own. Cody Walker (23.78) and Jarrod Croker (24.33) are the only players other than M’bye with more than five restarts conceded and giving one up fewer than every 25 tackles.
If you enjoyed this post please consider supporting The Rugby League Eye Test through one of the links below.
Scan the QR code or copy the address below into your wallet to send some Bitcoin to support the site Scan the QR code or copy the address below into your wallet to send some Ethereum to support the site Scan the QR code or copy the address below into your wallet to send some Litecoin to support the site Scan the QR code or copy the address below into your wallet to send some Bitcoin cash to support the site Select a wallet to accept donation in ETH BNB BUSD etc.. Donate To Address
 Donate Via Wallets Bitcoin
 Ethereum
 Litecoin
 Bitcoin cash
Support The Rugby League Eye Test
Support The Rugby League Eye Test
Support The Rugby League Eye Test
Support The Rugby League Eye Test
Donate Via Wallets