There’s been a lot of talk about how short dropouts have become more prevalent in the NRL this season. The rule change this season has somewhat promoted that as well, reducing the punishment if you do kick a drop out on the full or less than 10 metres.
Teams are preparing for them now. Anthony Seibold mentioned recently that Rugby Union was more about contestable events, and how do we create more of those contestable events in rugby league? Short drop outs are one way to create them.
Friend of the site Jason Oliver from Rugby League Writers put together a great breakdown of how teams have been defending short dropouts already, and I’m not going to a better job than he’s done.
Teams will improve their defense of them, but currently the recovery rate is somewhere between 30-35%. For the defending team it’s a far better outcome than just kicking it 40 metres downfield, but for the attacking team, do you want to give the defender a 30% chance of retaining the ball with a broken defensive line?
I wanted to see if there were other impacts of this rule change may have created. So, I decided to look a bit further up the chain, and it turns out that looking at dropouts only tells you part of the story.
Anecdotally people have mentioned to me that they feel like teams are deliberately running the ball on the last tackle, handing it over a few metres out and giving their defensive line a chance to get set.
This gave me a great starting question – are teams more likely to avoid kicking the ball into the in-goal area to avoid a short drop out situation?
We have already seen teams shortening their attacking kicks to avoid giving up a seven tackle set. Are they now kicking even shorter, or not kicking at all? Are they eschewing end of set kicks to hand the ball over in the safest way possible? There’s some signs that is the case.
Firstly, let’s check what has happened with dropouts overall. This year there have been 56 line dropouts taken according to Fox Sports Stats, which is down from 71 during the first three rounds last year, and down from a huge 94 during the first three rounds of 2021. The interesting part of this is that the number of play the balls inside 20 metres is mostly flat over that same period – no more than a 1-2% change in that metric, nothing like the 20% swing we’re seeing with dropouts themselves.
Clearly there are less line dropouts being taken this season, especially accounting for similar field position and possession, which solves the first part of our question.
The next part is to check how often teams are ending a set with a kick. The thought process behind this is that if you can work out how often they’re ending a set with a kick, you can use that to work out the remaining number of sets that were finished with a run. And therefore work out if teams are handing over possession from a run more this season than those prior.
To do this, I’ve looked at the number of times set ended with a kick from the first three rounds for the past four seasons, where at set occurred and on which tackle the kick happened. I’ve deliberately skipped 2020 since the first two rounds were run under old rules and round three implemented set restarts, meaning the numbers are even less consistent than they would be under normal circumstances.
Here’s the percentage of times a kick was taken on the fifth tackle for the past four seasons. As noted above, the inverse of this would be how often they’re running the ball on the last.
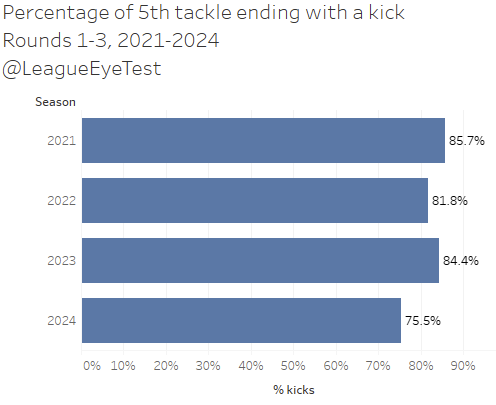
Teams kicking on the last tackle has dropped from 85.7% of the time to just 75.5% in 2024. You can take the remainder of that as how often a team runs the ball on the last. Simply put, it shows a change in running the ball on the last from approximately one in seven sets to one in four, quite a significant change. The overall rate has increased by almost 10%.
But for the above number we’re looking at the whole length of the field, not just in attacking areas. What if we limited it to just inside a team’s 20 metre zone? Below are the results.
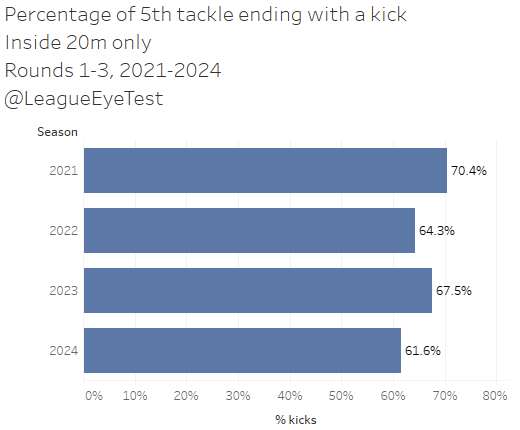
Kicking on the last inside 20 metres happened more than 70% of the time in 2021, but that has dropped to just 61.6% in 2024. We’ve moved from kicking on the last in an attacking position happening seven out of every ten sets to just three out of every five. Another data point supporting more last tackle running of the ball.
This makes it pretty clear that teams are running the ball on the last more than they have been. It gives them a 100% chance of defending an opponent close to their line, as opposed to the 30-35% chance of their opponent regaining the ball from a drop out with a broken defensive line. We all know how risk adverse coaches are, and I can understand why they’re avoiding line dropouts.
I also thought I’d have a quick look even earlier in tackle counts to see if there were any other changes. Overall kicks on the fourth tackle are down from 41% last year to 37% in 2024.
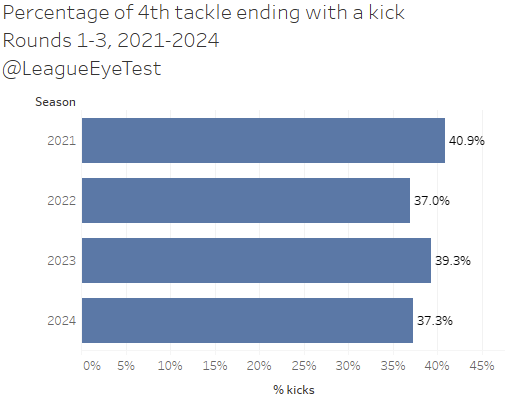
A modest change but indicates that teams are playing through to the fifth tackle more often. And if we again limit it again to inside 20 metres, the numbers are down from the prior two seasons but ahead of 2021.
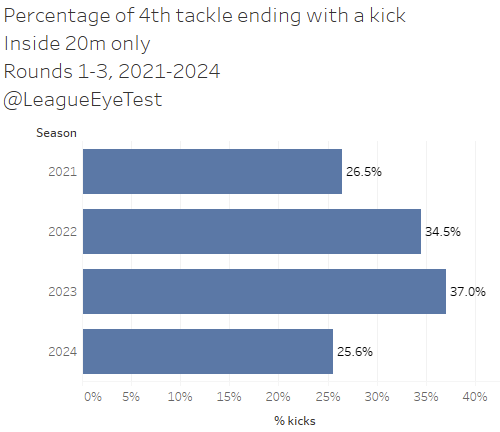
A big drop from 37% twelve months ago to 25.6% in 2024, which would point to more running on this particular tackle. Given the improvement in width usage over middle runs and crash plays close to the line, that makes sense.
The one interesting result is looking at third tackle kicks inside 20 metres.
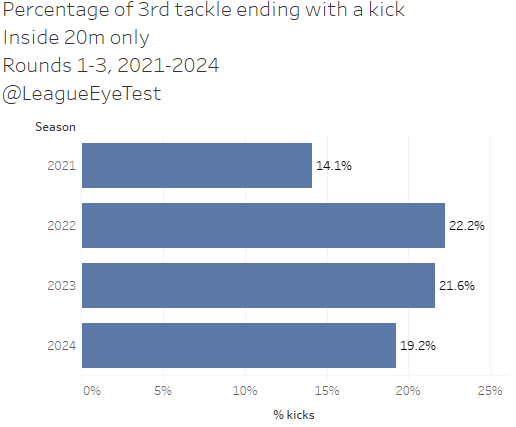
I’d put this down to 2021 being peak six again era and teams were content to play out their sets and wear defenders down with constant hit ups, before trying to force a drop out and retain as much possession as possible. Over the past three seasons it looks like an early attacking kick while pushing a teams try line has become more of a legitimate option, hoping to catch out an unprepared defense. Again, creating those contestable events.
Checking if narrowing it down to specifically inside 20 metres sees a similar change, kicking earlier in sets has dropped as well. Second tackle kicks are down from 11% in 2021 to 5.6% in 2024. Third tackle kicks have dropped from 19.8% in 2022 to 11.8% in 2024. And here fourth tackle kicks have changed, increasing since 2021 from 19.8% to 25.9%, but that’s down from 28.24% twelve months ago.
To round out this analysis I thought I’d also check out the kick spray charts to see if anything had changed there. Below are the kick maps for rounds 1-3 for the past two seasons, 2023 on the left and 2024 on the right.
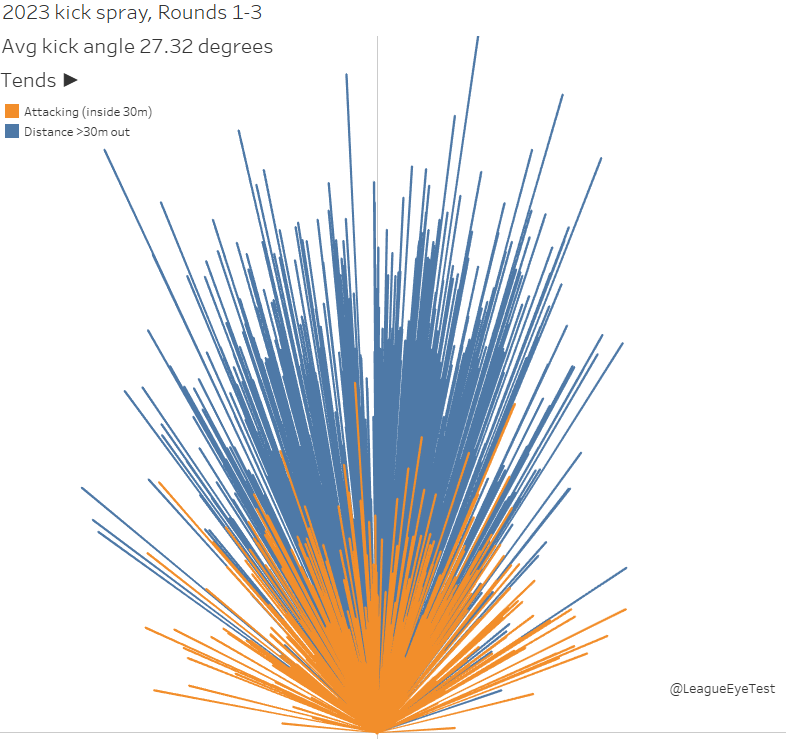
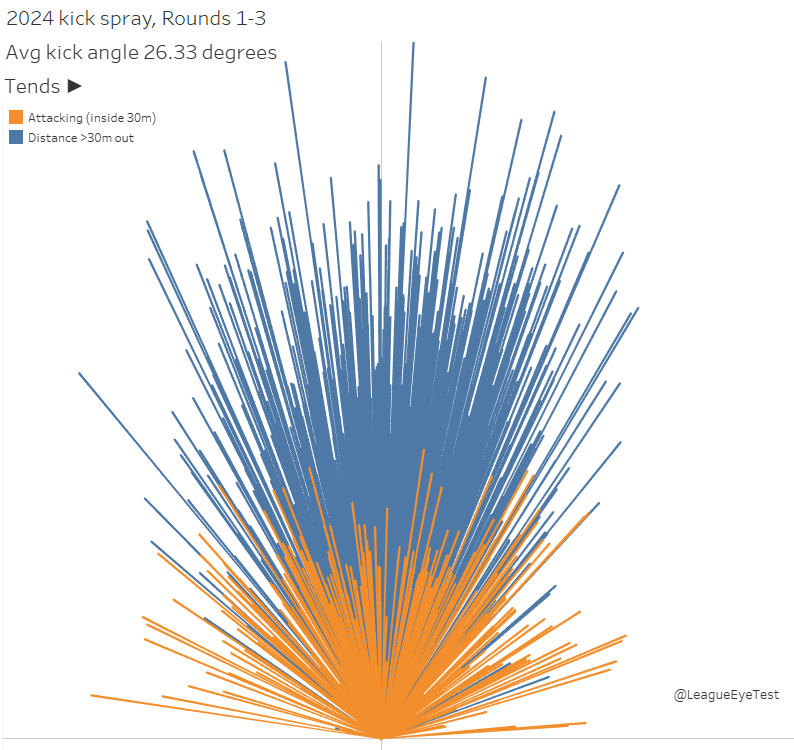
Not a lot of change there, with 2024 kicks being on average one degree wider. What if we just focused on inside 20 metres though? Again, 2023 is on the left and 2024 is on the right.
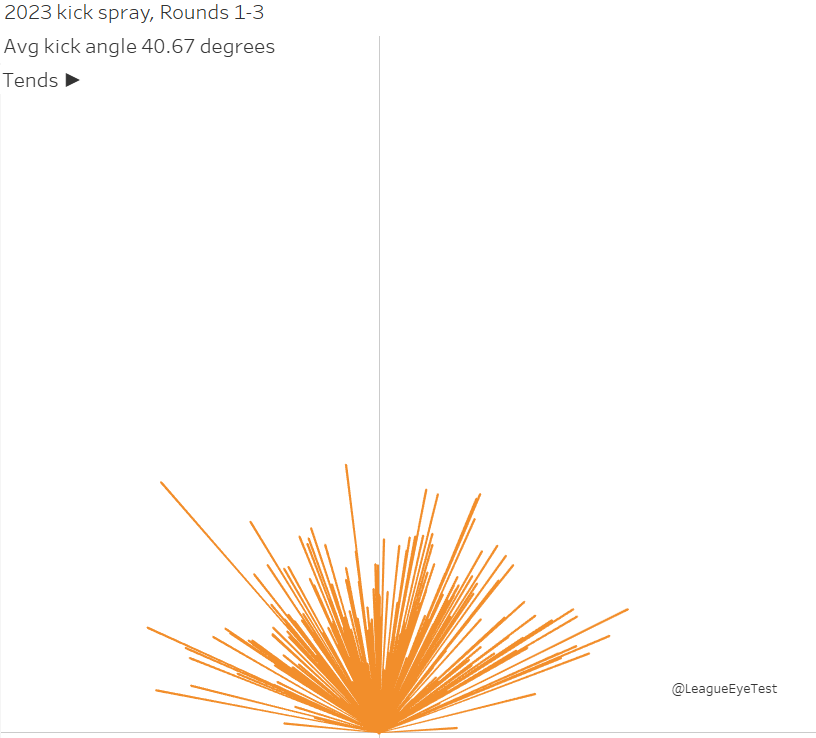
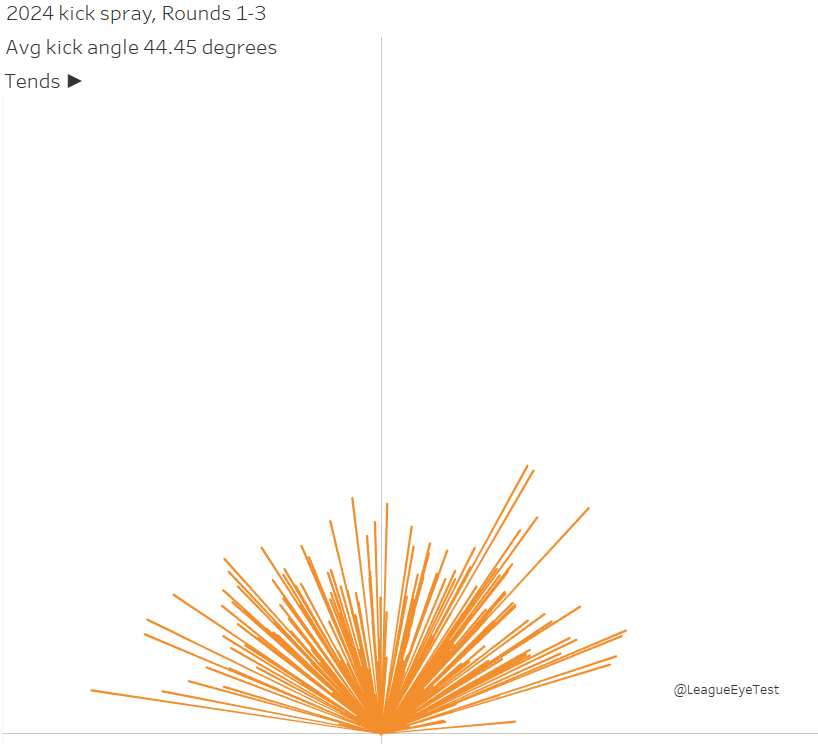
Here’s the subtle change – kicks starting inside 20 metres this year are at an average angle of over 44 degrees. That’s up from just over 40 degrees twelve months ago.
This correlates with the prior data – teams are kicking slightly wider with less depth than previously, trying to avoid conceding a drop out and create a more favourable contest. The average distance on a ball kicked up to 10 metres out is down by almost half a metre, balls kicked from 20-30metres out are shorter on average by over one metre, and balls kicked 30-40 metres out are shorter this year by over 1.5 metres. Again, this all points to kicks being aimed shallower than prior seasons.
I wouldn’t necessarily say these are definitive numbers based on three rounds of results, but it does paint a picture that this is another trend that’s occurring in 2024. I’ll definitely revisit this later in the season to see if any teams in particular are giving the ball via a handover close to the line more than others.
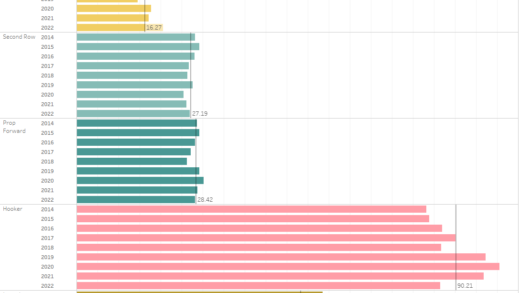
Next up we have a quick check in on the width movement in the NRL after Round 3. Here’s the update of the chart I’ve been using to check how wide teams are playing this season, putting play the ball location into 10 buckets of 6.8metres in width.
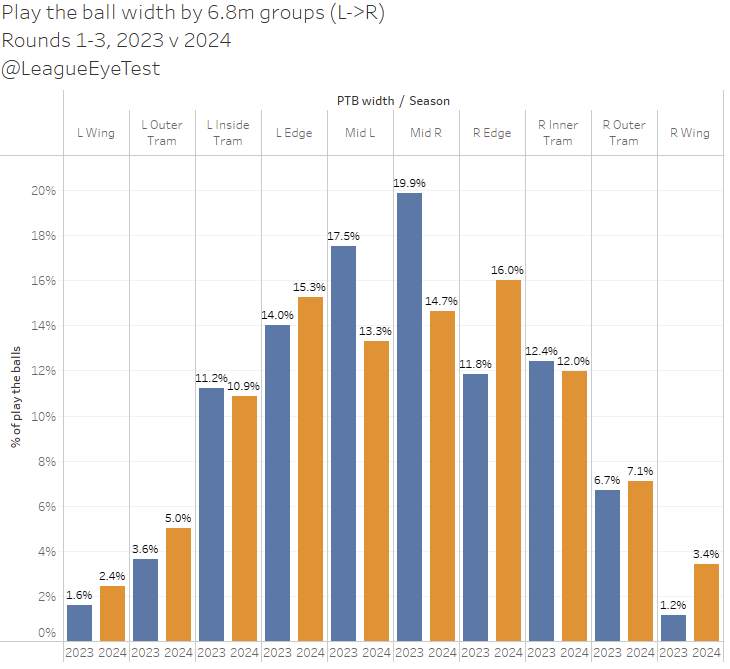
And it’s still continuing, and Round 3 was quite a significant increase on last year as well. Specifically in round three, the Right Edge channel was up to 21.7% of play the balls in Round 3, from just 12.1% last year. The Right Inner Tram was also up, to 17.8% from 14.4%. Most of this has come from play the balls in the middle centre of the field.
There was a drop in Left Inner Tram percentage, but it matches up nearly perfectly with a jump in Left Edge, indicating that teams were still going left but slightly narrower this year.
Friend of the site Jason Oliver of many places but most notably NRL.com and the wonderful Rugby League Writers made note of Manly’s use of width in yardage situations on social media after the game.
And the numbers speak to that, with Manly having over 40% of their play the balls on the right third of the field. Breaking that down, 24% of Sea Eagles play the balls on tackle 2 were on the Right Edge, and 32% in that same 6.8m corridor on tackle 4.
It’s not hard to see why this is happening as I’ve said previously. Who could have known that putting the ball in the hands of your best attacking players earlier and more often would be the best course of action?
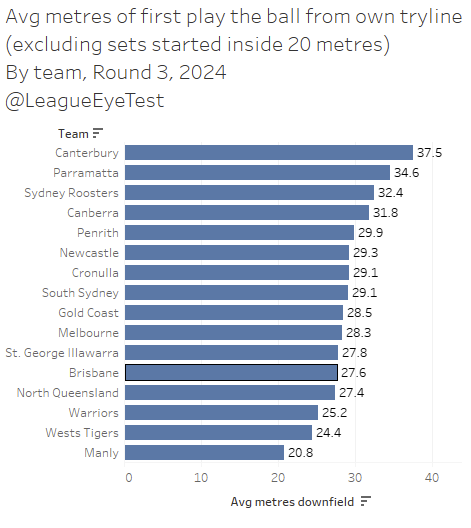
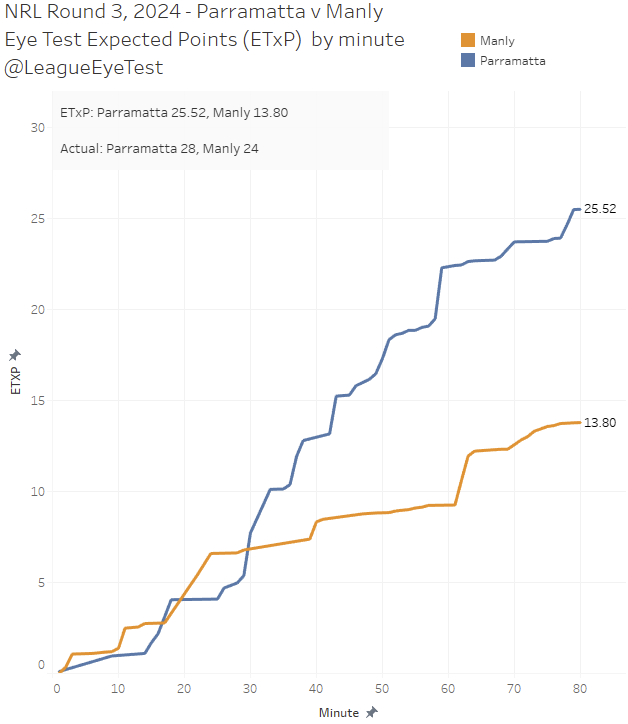
They weren’t able to spread the ball wide as much as they had been against the Eels, who limited their width and gave them an unfavorable starting position. Taking out sets started inside 20 metres, Manly’s first play the ball was on average just 21 metres out from the line. Parramattat’s was nearly 35.
The Eels may have given Manly an early start but they adjusted well and limited the Sea Eagles to very low value field position, as seen in that game’s expected point chart.
And before we finish up this week a quick look at Run Metres Over Expected per run. First by team for Round 3.
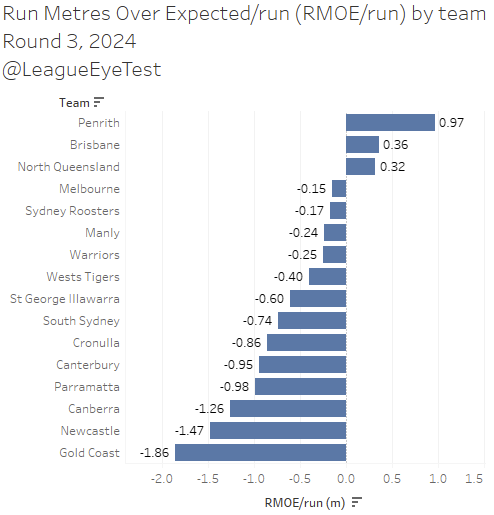
Penrith were one of just three teams ahead of their RMOE/run for the round at +0.97, adding nearly a metre per run more than an average team would. Brisbane and North Queensland were the only other two to break into the positives.
On the negative scale, things don’t get much worse than the Gold Coast Titans at -1.86 RMOE/run. You have to try really hard to be this bad, and failing to match the expected metres of an average team by nearly two whole metres per carry is a new level of terrible.
Just how terrible was it? Since 2021 it’s the eighth lowest RMOE/run by any team and the worst since Round 11 2022, nearly two years ago during the height of six agains.
It’s no surprise the Bulldogs walked all over them for their first win of the season, with the expected point chart from this game showing just how little high point value field position the Titans had.
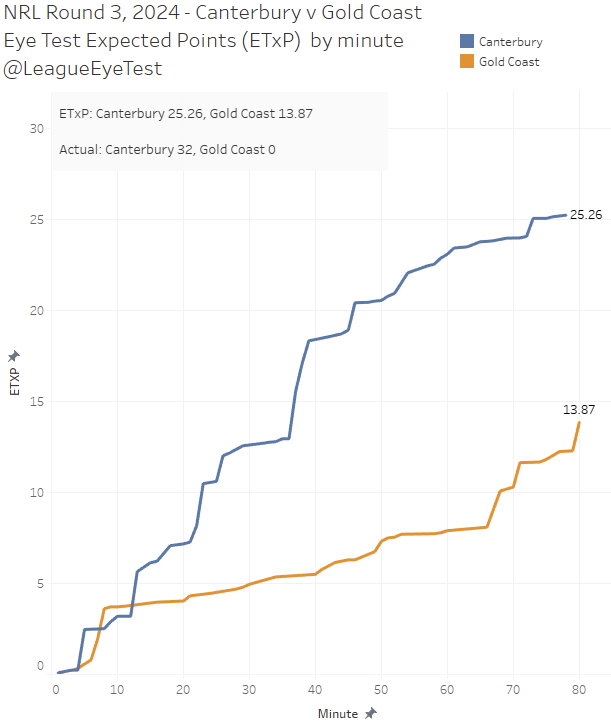
From the eighth minute, the Titans had about 3.5 expected points worth of possesion for the next 60 minutes, during which time the Dogs had around 20 expected points worth of field position. After being very bullish on Des Hasler’s ability to extract something out of this Titans lineup, I’m wondering if the game has passed him by.
Back to RMOE/run, Newcastle wasn’t much better at -1.47 RMOE/run and were lucky to hold on to a slender 14-12 victory over Melbourne. The expected point chart from that matchup shows how they gave the Storm every chance to snatch victory with some late high value field position.
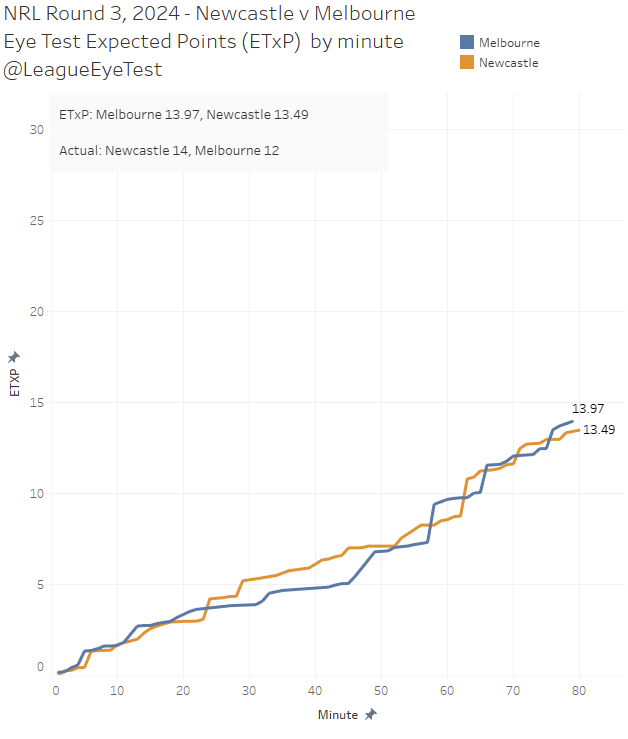
This probably isn’t sustainable, but after the Knights threw away a winnable game in Townsville during Round 2, it’s nice to see they’ve made some progress about defending a lead. Friend of the site JonnyForeigner of the Storm Machine newsletter has a great write up of the game.
Lastly here’s the top 20 players by RMOE/run for Round 3.
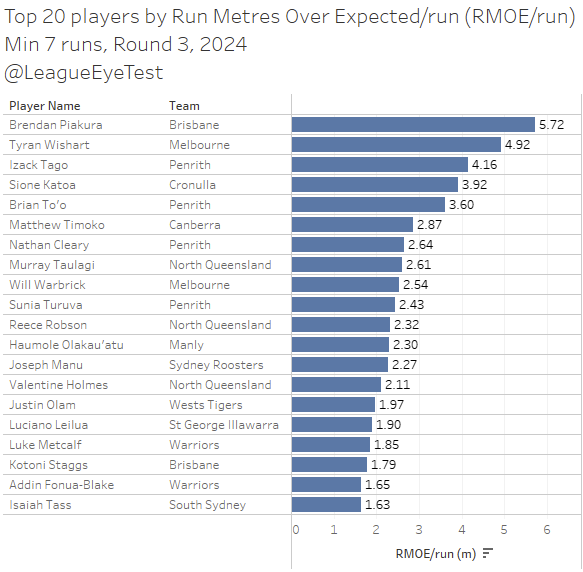
Broncos edge forward Brendan Piakura was one of the few positives for last year’s grand finalists in their loss to the Panthers. Piakura’s RMOE/run was +5.72 from 9 carries, adding nearly six metres over expected per run, a very impressive mark.
Second place was Storm utility Tyran Wishart at +4.92 RMOE/run, ahead of regular RMOE contender centre Izack Tago at +4.72.
Nathan Cleary’s masterclass against the Broncos can be seen here as well, with the Panthers halfback sporting an RMOE/run of +2.64, placing him seventh for the round. This was his first positive RMOE/run number of the season, which shows how it’s not a good regular indicator of halfback performance but can show when they have a dominant running game.