Given how historically bad Brisbane has been this season (see below), and being an unbiased New South Welshman who supports the Eels and isn’t at all adverse to sticking the boot in continually, I thought I‘d have a look to see if Anthony Seibold was at the helm of a significant season in NRL history or just a regular bad one.
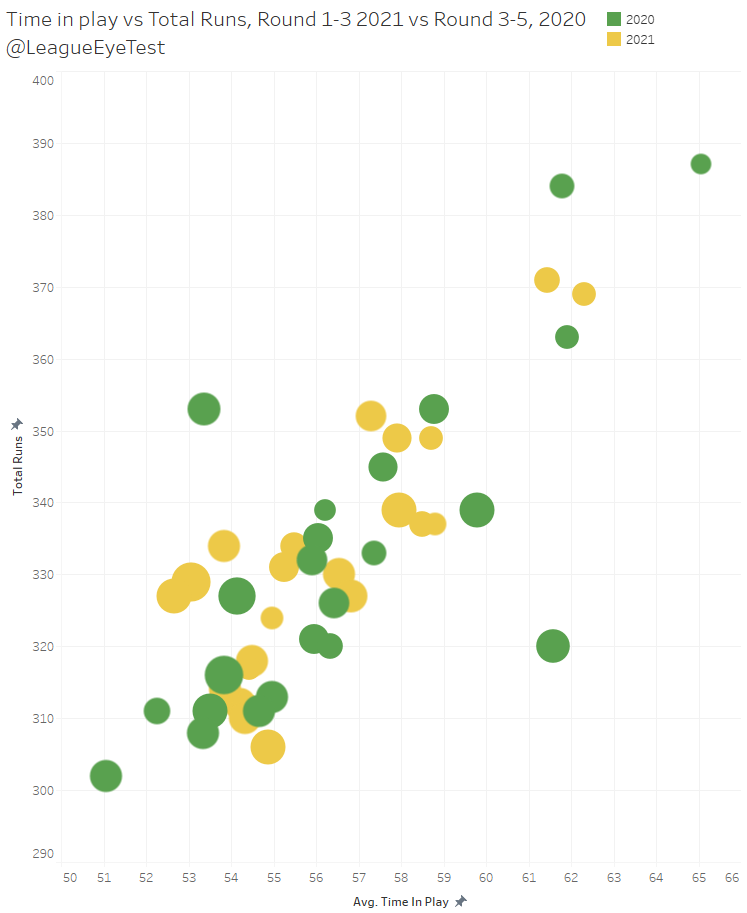
To do so, I wanted to plot average margin against average run metres by coach and season from 2014-2020. Using the Eye Test™, we’ve seen Brisbane repeatedly demolished through the middle of the field and be unable to return serve. Run metres generally correlate well with winning games, as you generate more field position and generally put your team in a better position to score points. Average margin should be self-explanatory.
So how does plotting these two data points look for Seibold and the Broncos?

Not pretty. One of the worst seasons over the past seven years for average margin, and barely averaging more than 1250 metres per game, also putting them in some shocking company. To put their average gains in perspective, Parramatta leads the way with over 1700 metres per game this season.
Going back to Seibold’s positioning, it’s not exactly the sort of career trajectory one would expect from a Harvard graduate. Nearly elite in 2018, before dropping to lower mid table in 2019 and now to whatever derogatory terms you’d like to define his 2020 by. Whether you want to attribute it bringing in the wrong type of players (Brodie Croft) or “losing the dressing room”, it’s clear that things are headed in the wrong direction and unlikely to turnaround anytime soon.
Going back to the chart, the bottom corner where Seibold resides this season isn’t particularly elite company either, as it includes:
- Justin Holbrook, Gold Coast (2020)
- Neil Henry, Gold Coast (2014)
- Jason Taylor, Wests Tigers (2017)
- Nathan Brown, Newcastle (2016)
- Luke Burt & Craig Hodges, Gold Coast (2019)
Not the best group of coaches to be associated with, although the jury is still out on Holbrook who looks to have turned things around in recent weeks. If anything, with more “stuff” happening in games due to the ball being in play more thanks to Vlandysball, the Broncos should be sitting higher in metres gained, yet they’re surrounded by some all time bad sides.
Should Seibold fail to last until next season, at least things can’t get worse for Broncos fans, can they?

Maybe we should move on…
Does the Broncos bench exist if it rarely gets used?
Brisbane suffering yet another humiliating defeat on Friday night was compounded by the way they lost it. Cronulla scored 18 points in the final nine minutes to claw back a lead that seemed unlikely to be run down. Were the Broncos gassed? There was a stat that Fox Sports produced during the latter stages of the game which would indicate so.
Yes, a net margin of -100 over the final 20 minutes of every game this season. That’s not just giving up, it’s basically waving the white flag as soon as you get to 60 minutes on the clock. What is causing their inability to finish games?
Looking at some data on how they use their interchange bench for the season, and a few things become apparent. We already saw above that the 2020 Broncos are one of the worst teams historically at generating run metres. Compounding things is that Brisbane has by far the lowest run metre contribution % from their bench of any NRL team, at just 11.98%. This puts an inordinate amount of pressure on the Broncos middle forwards who are showing up each week (Payne Haas, Pat Carrigan and Tom Flegler) to carry the load.

Coincidentally the team with the highest % of contribution to run metres from their interchange bench? The Cronulla Sharks, at almost double the Broncos rate with 24.56%. Nearly a quarter of the Sharks run metres comes from their bench, whilst the Broncos are slightly over 10%. Not only are they not gaining metres as a team, they’re also not seeing any significant input from their bench towards that paltry total.
Part of this is because the Broncos also use their less than almost another other club in the league. Brisbane averages just 103 minutes per game, second fewest and only ahead of Parramatta (99 per game).

The difference is that the Eels generally play their edge backrowers (Shaun Lane and Ryan Matterson) for the full 80 minutes. Even when Brad Takairangi filled in for Matterson in Round 11 against Manly he spent 66 minutes on the field. Marata Niukore deputised for Matterson this week and played only 45 minutes, the first time all season an Eels backrower had played fewer than 66 minutes unless they were injured.
This allows them to rotate their middle forwards more frequently and give them a break. It may be a reason that the Eels have the most runs of 8 metres or more in the competition, and nearly 50% more than the Broncos, who barely sit ahead of the Titans.

Injury logical reasons for this lack of bench use or production. There’s been a string of injuries that have affected their forward pack, with David Fifita, Matt Lodge and Alex Glenn (among others) who have missed significant time. Then you have the continual adventures of Tevita Pangai at the judiciary.
Yet the Broncos continue to be dominated in the middle of the field while Seibold uses his bench and rotations in a way that requires his starting middle forwards to play significant minutes and possibly tire at the back end of games. The players are there but as we saw above he tends to us them sparingly. Across the league in 2020, there have been 163 instances of interchange players seeing more than 40 minutes per game this season, and Brisbane have just 3 of them. Again, the fewest in the league.
As always, I’ll caveat this with the usual statements – I’m only using public data and the clubs, and their staff will have a much better idea of what is going on. Usually things are done for a very specific reason. But there’s a trend here that appears to be showing up more often than not and it’s far from pretty.
Moeaki Fotuaika, the best prop you rarely hear about
This week I wanted to highlight one of the best young forwards that you rarely hear about from traditional rugby league media. I’m far from the first person to point out how good Moeaki Fotuakia has been, that would probably go to Trent Copeland who was high on him a very early stage. He’s placed highly in my advanced statistics – Run %, Tackle % and Involvement Rate – for the past few seasons. If you’ve watched him play you know his motor is nearly unlimited, and the numbers he put in 2019 with a busted wrist were incredible.
With David Fifita and Tino Fa’asuamaleaui joining the Titans in 2021 there will be a lot more eyes on them and hopefully more praise for Fotuakia. And rightly so.
If you compare him to some other higher profile forwards this season his numbers hold up exceptionally well. The below radar charts show the percentile two particular players sit at for the averages of each statistic. Full credit has to go to StatsInsider for their wonderful AFL DNA charts which inspired me to put these charts together.
For middle forwards I’ve chosen Minutes, Runs, Run Metres, Metres/Run, Post Contact Metres, Tackles, Missed Tackles and Offloads. The closer the data points are to the edge of the heptagon, the better. Keep in mind these are percentiles and not the actual data, so two players may appear close together, but that just means their rank is similar, not their output. It’s one of the reasons radar charts aren’t great for sports data analysis, as they’re suited to data sets with a common metric like survey responses rating something out of ten. They’re still useful to look at as long as you know their weaknesses.
If a player is at 90% for Runs, that means that they had more runs than 90% of other forwards. Missed tackles operates slightly differently, as it is a negative that, meaning the closer to the edge of the heptagon, the fewer tackles a player misses. It’s also total missed tackles, which means players with fewer minutes and fewer tackle attempts may appear to be better defenders. This isn’t always true, remember that to miss a tackle you have to actually attempt one in the first place.
Here’s how Fotuaika matches up with a few bigger names.. You can click/tap on each image to enlarge it.


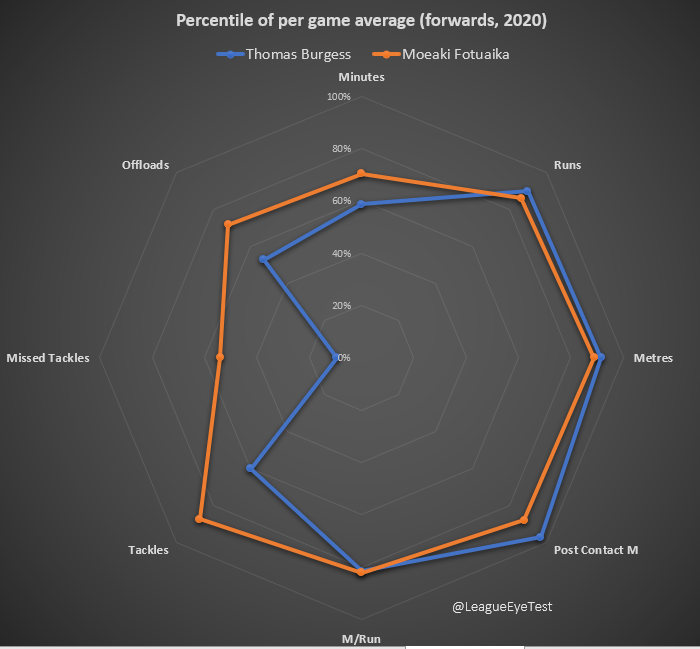
His compares very well here, with Fotuakia sitting well above the 80th percentile for Runs, Metres, Post Contact Metres, Metres per run and Tackles and equalling or outperforming Aaron Woods, Jake Trbojevic, Thomas Burgess and Jared Waerea-Hargreaves.
Speaking of Woods, he has been maligned so much by fans over the years for his perceived softness (whether warranted or not), that he is now probably underrated. Sort of like a reverse Mitch Aubusson, who has been classed as underrated for so long he’s now wildly overrated. His production is quite good, and whilst you wouldn’t want him to be the star of your forward pack, he would be a valuable addition to most clubs. At the right price of course.
Anyway, the next time the Titans are playing, take some time and watch Fotuaika exclusively for a few sets of six to see how much impact he has. He’s the perfect hardworking prop to pair with the new young stars headed to the Gold Coast next season.
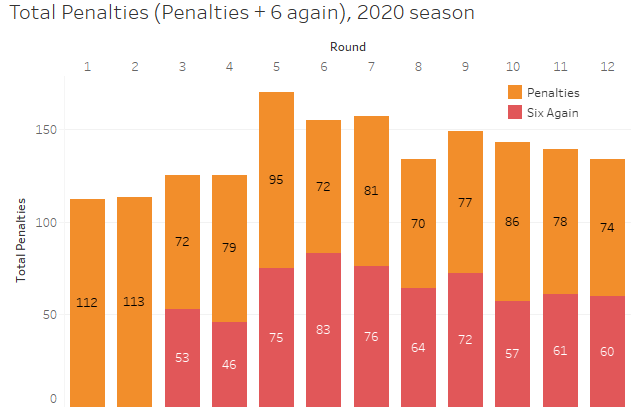
Penalty and set restart update
Just a quick update on penalties and set restarts from Round 12. Not a huge change from last week, we’re still seeing 16-17 total infrginements a game, with between 7-8 of them being set restarts. There is a set restart or penalty being called almost every 18 play the balls over the past few rounds.
Looking at refereeing averages, Adam Gee is still only behind Chris Butler for average set restarts called per game, but Butler has still only handled two matches so it’s not a fair comparison. Ben Cummins, who had been the stingiest referee for set restarts, has pushed his average up recently to over six per game, and still calls the fewest total infringements of any referee.

5-day turnaround addendum
I’d like to quickly point out that I missed another important piece of data in my post on five-day turnarounds last week, from Andrew Ferguson at the Rugby League Project:
It’s worth opening the image to see the win percentage by each team for each day turnaround. Yet another piece of data showing that there’s very little difference in 5-8-day turnarounds for clubs. I’ve edited last weeks post to include it now.