
This week I’ll be skipping any analysis of the pace of the game, for a few reasons. The first is something I alluded to last week, which is that we’ve hit a decent threshold of data points, the affect of the new rules is relatively clear and the impact of fatigue is still obvious.
The second is that friend of the site Liam of PythagoNRL fame has put together the best summary to date of the impact of the new rule changes on margin and form. It’s well worth your time to read through it. And I’m not just saying that because he’s cited some of my data.
Instead we’ve got two ways that the game has changed again under these new rules. It might not be faster overall, but sections within halves appear to be, but it’s definitely changed and fatigue is playing a huge part.
“Faster” may be a myth, but increased fatigue isn’t
Again, if you haven’t read the article posted above from PythagoNRL or last week’s post here on the Eye Test, I’d recommend reading them first to get a picture of where the game is at currently under the new rules. It may not be faster but we know that fatigue is playing a larger part due to the reduction of stoppages where players would typically recover.
Last week’s post also introduces the “fatigue indicators” that I’ve been keeping an eye on to see what impact fatigue may be having on whatever passes for rugby league this season. Here’s that table update after Round 4.
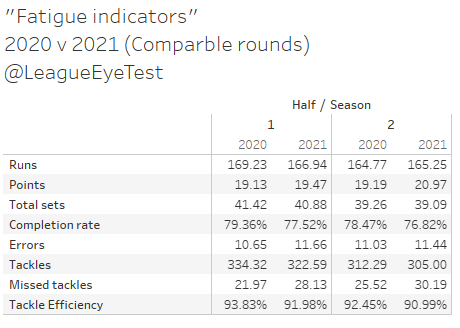
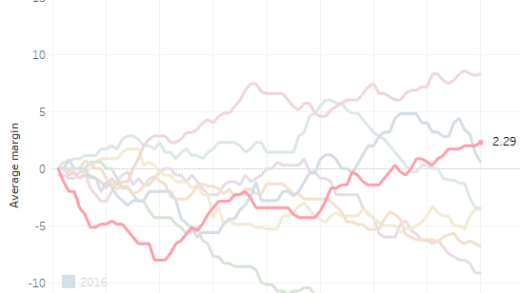
Scoring in first halves has evened up slightly, but we’re still seeing nearly 2 points per game more scored in the second half this season, which is illustrated beautifully by Tim Newans here:
The other things that stand out from the “fatigue indicators” include fewer runs and sets in both halves but increases in errors and missed tackles, both of which can be affected by poor decision making influenced by fatigue.
And it’s that last one I mentioned, the missed tackles, that has intrigued me quite a bit. Missed tackles is always a tricky stat to interpret at a player level because you have to be in a position to attempt a tackle to miss one, but looking at an aggregated league wide level that sort of ambiguity should be removed.
So I looked at the percentage change year on year for those stats to see just how much they had changed. And that missed tackles number stands out even more as you can see below.
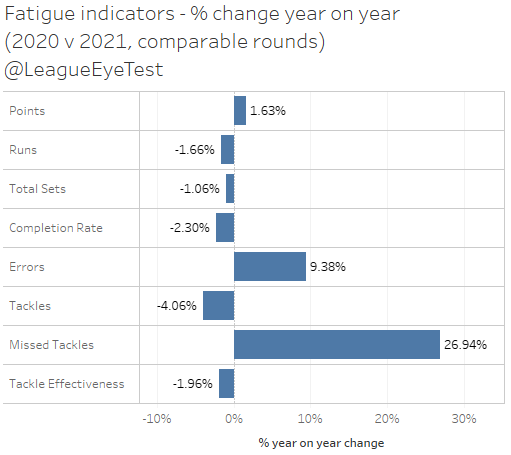
It amounts to +27% in missed tackles this season, despite -4% in tackles completed. Errors are also up by 11.6% which isn’t an insignificant number either and contributing to the lower completion rates, but to have a quarter more missed tackles is a sure sign there’s been a dramatic shift in the game.
Obviously these numbers are being skewed by the increase in lopsided results right? Canterbury, Manly and North Queensland all have conceded 100 points more than they’ve scored so the increase must be due to them, while Brisbane’s only positive result this season is beating up on the aforementioned Bulldogs. Given this, I filtered out any game that included those teams and checked the percentage change again.
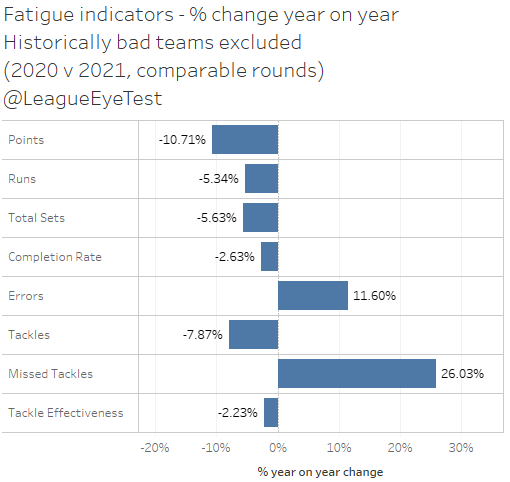
The change for missed tackles is still +26%. But I thought we’ve always had bad teams and the rule changes have just highlighted that? Whatever the case, the increase in missed tackles is clearly not just due to some games between good and bad sides with large margins of victory.
The kicker for all of the data I’ve just posted? It’s from first halves only, when you’d expect there to be less impact from fatigue on performance. These rule changes appear to have affected players fatigue so dramatically that they’re gassed in the first half and missing a quarter more tackles than they had in the previous year.
I know the intention with this seasons rule changes was to further decrease the advantage defenses had, but reducing them to the point of exhaustion and unable to complete a tackle may not be the optimal way of doing it. Then again, I’m not running a national sporting competition on the whims of a select few who wish to return to their salad days.
Getting back on track, for second halves the numbers are still high but a bit more muted. Below is the above chart with the same teams excluded.
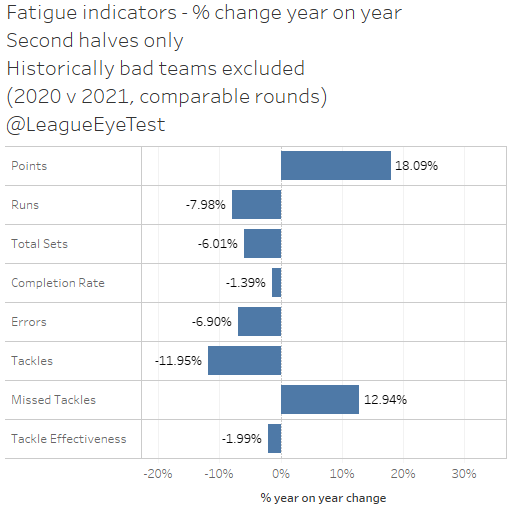
Errors are actually down in the second half when you take out the four bad teams, by 6.9%, which makes . Missed tackles are up nearly 13%, whilst completed tackles are down 12%. Given that second half points are also up 18%, that may be because teams are spending more time under the posts watching a conversion than running or tackling. You could also surmise that fatigue is becoming such a determining factor that some players aren’t even in position to attempt a tackle let alone miss one.
The affect of fatigue can be seen when you look at which positions are missing more tackles this season. Below is the year on year change in missed tackles by position.
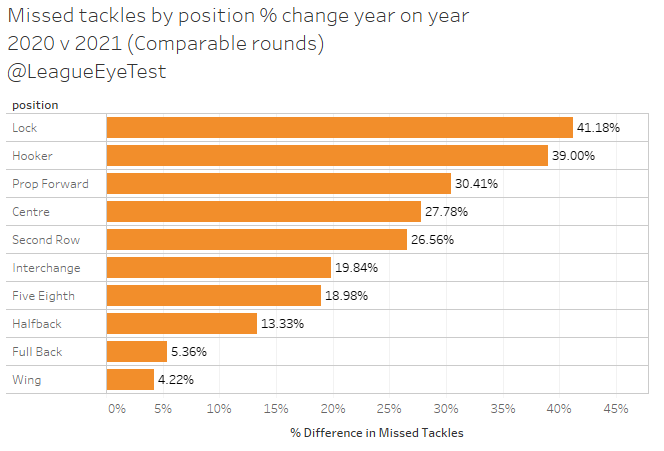
Given that middle forwards defend the majority of runs, it’s not surprising to see them missing more than the edges. The one that stands out for me is interchange players, who are one of just two positions playing more minutes in 2020 (I’ll get to this later). They’re missing tackles at 20%, which is lower than the overall missed tackle increase of 26%. It’s not a sample size issue either, we’re looking at the same number of games (32) from four comparable rounds – 3 through 6 in 2020 and 1 through 4 in 2021.
The fact they are under indexing on the increase missed tackles also indicates that fatigue is the culprit here. If it weren’t and purely a factor of defenses being on the back foot due to the rule changes, they’d be missing tackles more tackles at a rate similar to starting middle forwards. Yet the increase for interchange players is about half of locks and hookers, and one third fewer than front rowers. They’re not missing as many tackles because they’re not as fatigued, despite being predominately middle forwards or middle utility players.
The other key thing is that it’s not just the bad teams who are missing significantly more tackles. Looking where these sizable increases have come from, it’s mostly a league wide trend. Below is the chart showing % change year on year for every team.
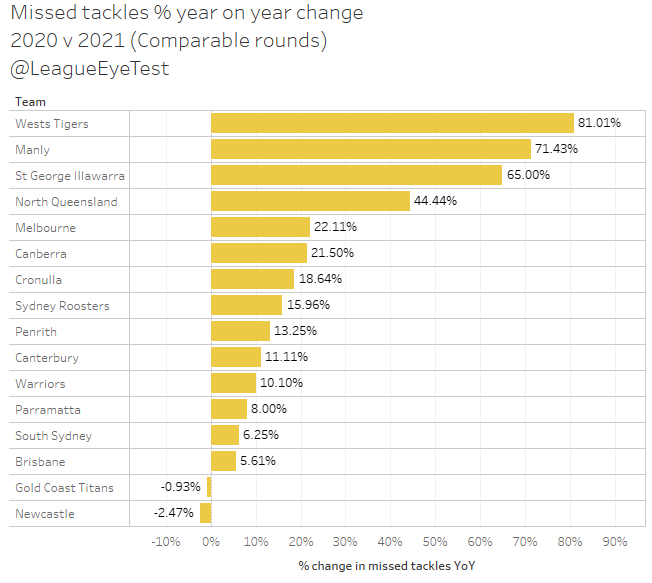
There’s only two teams (Newcastle and the Gold Coast) who have fewer missed tackles in 2021 compared to 2020. The team with the largest increase from last season is the Wests Tigers, jumping from 79 to 143, an eye watering 81% increase over just four rounds.
It’s not a pretty sight as even the stronger defensive teams like Melbourne and Canberra are missing 20% more tackles than they did a year ago. Brisbane are only missing 5% more than last season, but when you’re already missing a significant amount of tackles even a single digit percentage increase can be substantial. Nonetheless it shows that the jump in missed tackles is not purely the domain of the downtrodden and poorly administered, and most likely showing the impact fatigue is having across the board.
Speaking of missed tackles, NRL Physio posted some of his typically great analysis on HIA and injuries in tackles, which also noted tackling technique tends to dip under fatigue.
This certainly reflects the data I’ve posted above showing a significant increase in missed tackles being a factor of fatigue. But hey how good are fewer stoppages?
Centres are the new middle forwards?
Another smaller impact of the rule changes this season has been a slight change in distribution of workloads for NRL teams. Long-time readers will know I’m a keen observer of work rate for middle forwards and seeing who is (and isn’t) contributing.
And as I usually do, I had a check to see which positions taking their runs off a single pass from dummy half (your standard one out hit up), which makes up about 48-50% of all runs in a set restart world. The results are below, comparing 2020 with 2021.
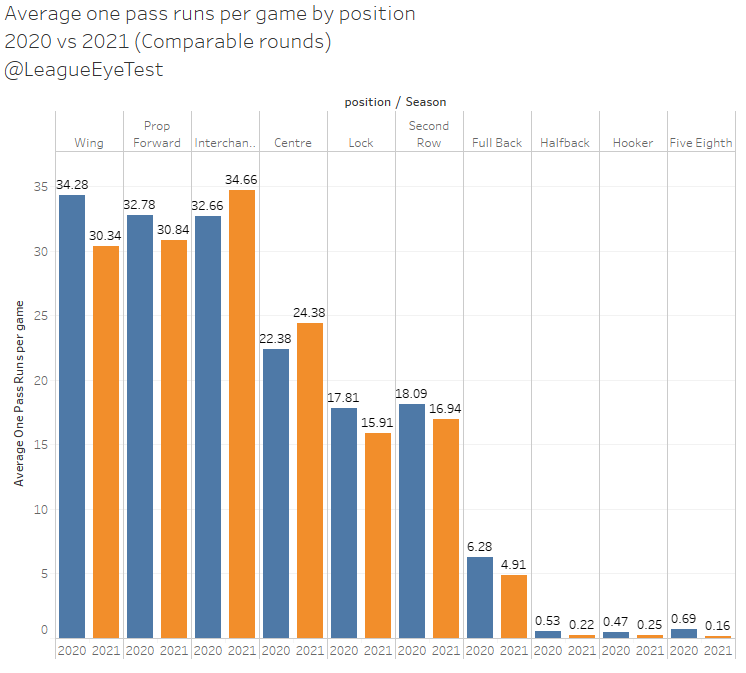
This season, Interchange players and surprisingly centres are the only ones that have increased their number of one pass runs. Every other position, including wingers who previously took top spot, have declined.
Why is this happening? Again, it’s most likely fatigue. Front rowers are spending slightly more on time field (+1.7%), but as seen above they’re running the ball less, around 2 times fewer per game. This might indicate they’re tired and possibly even not getting back on side soon enough, requiring centres to step in after wingers and help return the ball out of their own area following a kick. This lower involvement by starting forwards explains why interchange players spending an extra three minutes on the field this season, while locks and second rowers are spending less time on field.
When you look at it by share of hit ups then you can see the change a bit more obvious.
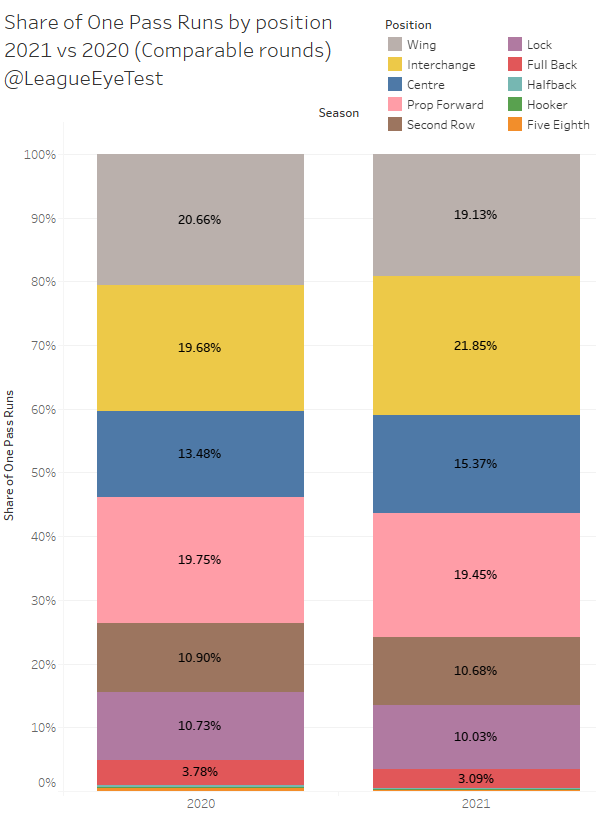
Wingers have dropped under 20% of hit ups, whilst interchange players have moved to nearly 22% from 19.7% a year ago. Centres now make up 15.3% of all one pass runs, up from 13.5% last season. Clearly the workload is being distributed more evenly.
It should be noted that we’re looking totals per position, not per player, meaning these numbers are for 2 wingers, two front rowers, two centres, one lock and four interchange players. It still shows that fatigue is having an impact, with hit ups now being spread further across teams rather than just being the domain of middle forwards and wingers bringing the ball out of their own areas after kicks.
Brian To’o breaking out this season
Prior to last Thursday night’s Penrith v Manly game, I posted a chart on Twitter showing just how much damage Panthers winger Brian To’o was doing when he ran the ball. At the time he was sitting first in runs per game and equal first (with James Tedesco and David Fifita) for tackles broken per game. Here’s the update after four games, and To’o is still leading the way in tackle busts per game at 7.75. The size of the data point indicates average run metres.
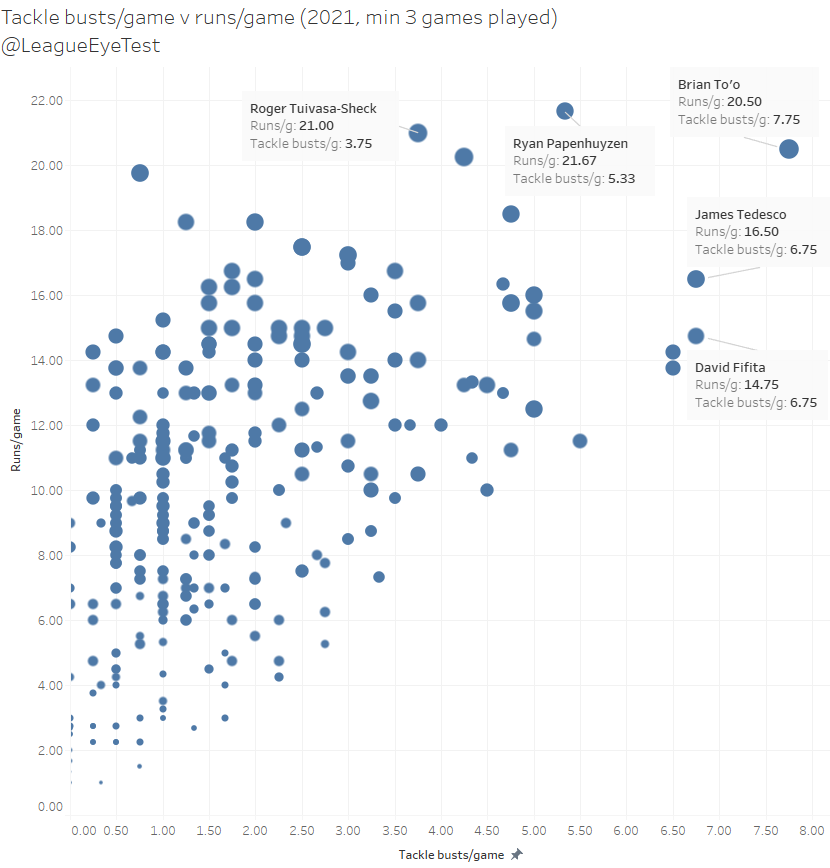
He’s been unsurprisingly overtaken by Ryan Papenhuyzen for runs per game after he almost single-handedly demolished Brisbane, but To’o is still one of only three players running the ball at least 20 times per outing and breaking tackles at a higher rather than either of them, while also leading the way in run metres and post contact run metres.
Speaking of Papenhuyzen, it was a similar visualisation I had posted to Twitter (pre Eye Test) that highlighted how strong he was in the back of the 2019 season when he started six games at fullback, leading to him securing the position full time in 2020.
I’m not suggesting To’o is going to end up as impactful as Tedesco or Papenhuyzen have been, but it’s clearly an indicator that he’s developed into one of the most damaging runners in the competition.

🔥🔥🔥🔥🔥 analytics my man