
Last week I mentioned one of the things that the new NRL rules has changed in 2021 is how often teams use their interchange bench. With fatigue playing an even larger part of the game this season due to the reduction of in game stoppages, players off the bench are spending nearly 10% more time on the field this season, up three minutes to 33.8 per game.
It’s not a huge change yet, but as middle forwards tire bench players are impacting the game even more and becoming more important. Not only are starting players tiring quicker and earlier in games as teams go all out early in halves, we’re also seeing clusters of head injury assessments and other injuries during games, which may or may not be related to the increased fatigue.
Thanks for reading The Rugby League Eye Test. Subscribe below to receive new posts in your inbox
Whatever the reason, having a strong interchange bench and using it correctly is becoming an important part of successful NRL clubs.
Which teams are using it more this season? To start with let’s examine who is (and isn’t) using their bench. Below is a chart of the average minutes by all interchange players by NRL club for 2021.

North Queensland is leading the way, with nearly 162 minutes per game from their four bench players as they deal with injuries and discipline issues. With Josh McGuire in exile and Jason Taumalolo injured, their few big middles aren’t available resulting in a forward pack by committee, with usual dummy half Rueben Cotter lining up most weeks at lock. The Sharks are averaging 153 per game but that’s exaggerated by their disastrous second half against the Eels where they had no fit players to interchange. The Warriors aren’t far behind, as they had been running a four forward bench until round five when Paul Turner debuted.
On the other end of the scale, the lowest are the Broncos and Eels, at barely more than 100 minutes per game across their four bench players. The Eels usually don’t substitute their edge forwards, with Shaun Lane and (usually) Ryan Matterson playing 70-80 minutes and Nathan Brown typically in the 55-65 minute range, rotating their middles and holding Will Smith as a late utility replacement.
The Broncos tactic of leaving Tom Dearden or Brodie Croft on the bench isn’t that different from the Eels. Last season when Croft was on the bench he did come on as a dummy half and defended (well tried to) through the middle. An increase of just 1% in interchange minutes used in 2021 highlights just how little has changed from an overall view, even if it has changed somewhat at a micro level. Here’s how the rest of the NRL has changed their bench usage this season compared to 2020.

Unsurprisingly with the reasons mentioned above North Queensland is going to their bench 41% more than 2020. Penrith is the other big mover, using nearly 30% more minutes on interchanges. On the other end of the scale, the Dragons are playing their reserves 17% fewer minutes, whilst Newcastle is also using 17% fewer minutes off the bench than last season, a number which stands out considering their shocking injury toll. Still, we’re seeing 11 of the 16 NRL clubs go to their bench more this season, and another three only 2% less, whether it be for fatigue, concussion, injury, or all three.
Going back to the low minutes that the Eels and Broncos use off their bench, it results in a similarly small percentage of their average running metres coming from their bench compared to their starting players. This can be seen below, at just 13% for Brisbane and 14% for Parramatta, the two lowest percentages of all 16 NRL clubs this season.
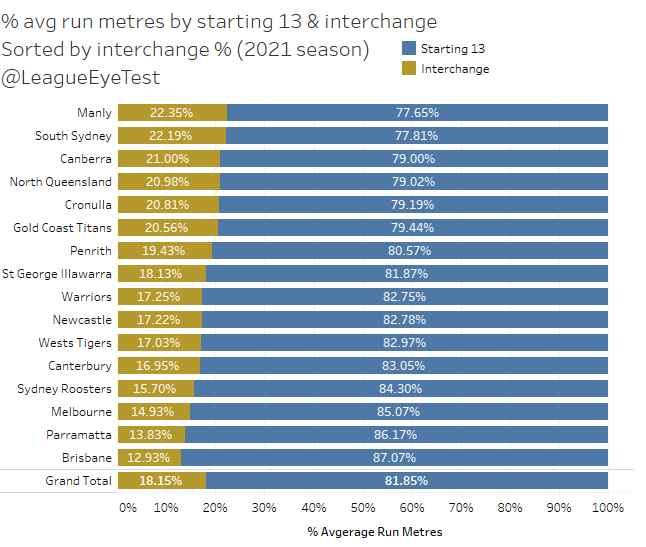
At the other end, Manly get 22% of run metres off their bench, slightly ahead of South Sydney whilst the Cowboys sit fourth at 21% despite running first for minutes off the bench. The average across the NRL is 18%.
Not all metres are created equal however. Below is a chart of run metres by interchange players, broken down by post contact and pre contact metres.
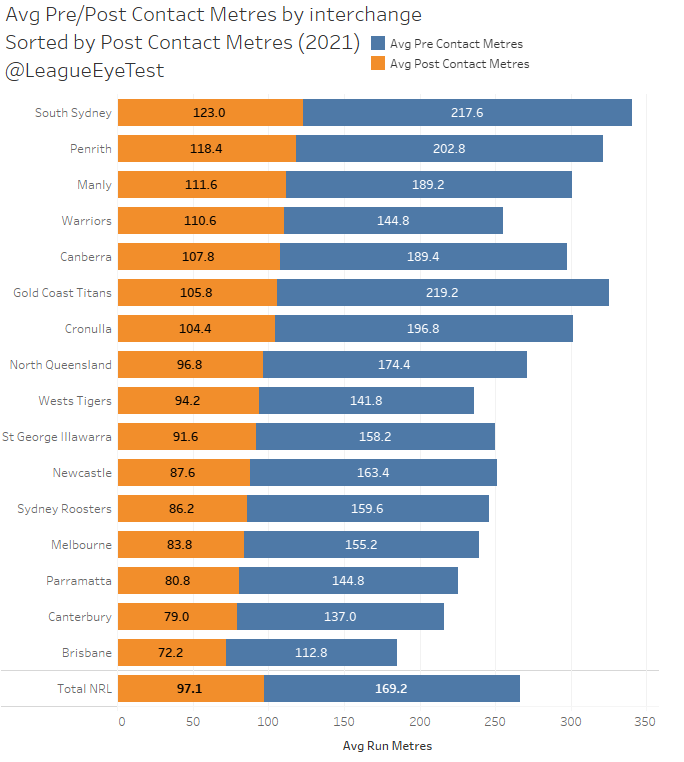
Souths get the best output from their bench, with 123 metres per game from their interchange and unsurprisingly Penrith are right behind them. The Warriors generate the fourth most post contact metres, but significantly fewer pre contact metres than those in the top half.
Only two teams produce less than 80 post contact metres per game from positions 14-17, one being Canterbury and the other being Brisbane. Even worse for the Broncos, they also get 20 pre contact metres fewer per game than the Bulldogs, and nearly 60 metres fewer than the NRL average.
This creates issues for teams like Brisbane, who have starting forwards that can generate metres, but as the game progresses with fewer stoppages, having one less forward to rotate is causing them to tire quicker.
If we look the previous pre/post contact metre chart but include starting forwards as well as interchange players, Brisbane are sitting mid table this season in post contact metres at 286 per game. Parramatta aren’t too far ahead at 290 per game. Both are ahead of the NRL average at 276 metres per game. Here’s the same chart from before but including starting forwards as well as interchange players.
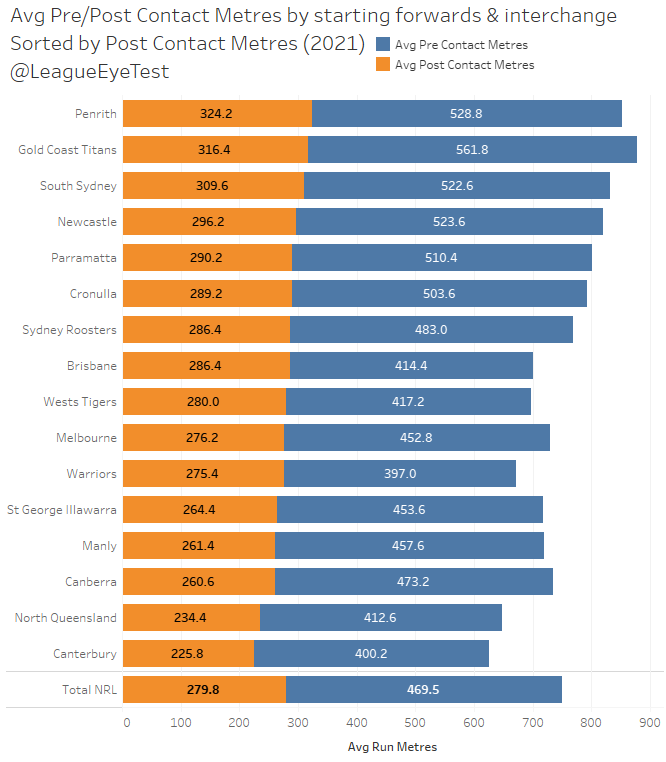
The real concern for Brisbane is their pre-contact metres from starting forwards and interchange, which are 13th in the NRL at just 414 per game and nearly 50 metres per game below the NRL average. Injuries to Matt Lodge and the abscence of Payne Haas hasn’t helped, but they’re still not where they would expect to be. If we sort the above chart by pre-contact metres (the blue section), it becomes more apparent.

The Broncos only sit ahead of North Queensland, Canterbury and the Warriors, which isn’t a pretty place to be in 2021. Parramatta are able to get away with stowing a utility on their bench because they gain around 100 metres more per match than Brisbane in pre contact metres. Which means they’re getting to contact later, where Brisbane forwards are getting hit early and are needing to push through contact to generate a smaller number of metres.
Kevin Walters wasting an interchange position on Croft or Dearden may be one of the reasons why the Broncos forwards are able to hold up early but fade late in games. Adding another big man on the bench and rotating their starting pack more often may alleviate that in this seasons fatigue riddled NRL.
The Wests Tigers are in a similar position to the Broncos with their low pre contact metres, but that is more due to their forwards inability to push through contact which was something I covered in 2020 and Tigers fans know too well.
Round 5 Interchange impact players
In Round 1 I highlighted Isaiah Papali’i’s huge impact off the bench for the Eels with nearly 200 metres gained. That was the highest run metre total by an interchange player since the start of 2020.
In Round 5 we had two similar performances, which I’ve additionally highlighted below.

Despite infuriating everyone with his grubbiness and inability to remain available, especially Roosters fans, Jared Warea-Hargreaves eclipsed Papali’I’s mark in Round 1 on the way to over 200 metres gained in just 43 minutes from 21 runs. The platform laid by him enabled the Roosters to stay in and ultimately win the game through some brilliance from Sam Walker.
That effort from the Roosters prop took a lot of the attention away from another huge effort though the middle by Panthers forward Spencer Leniu. He couldn’t match the other two for total metres gained with 183, but he smashed out 14 runs in just 26 minutes as Penrith ran through the Raiders.
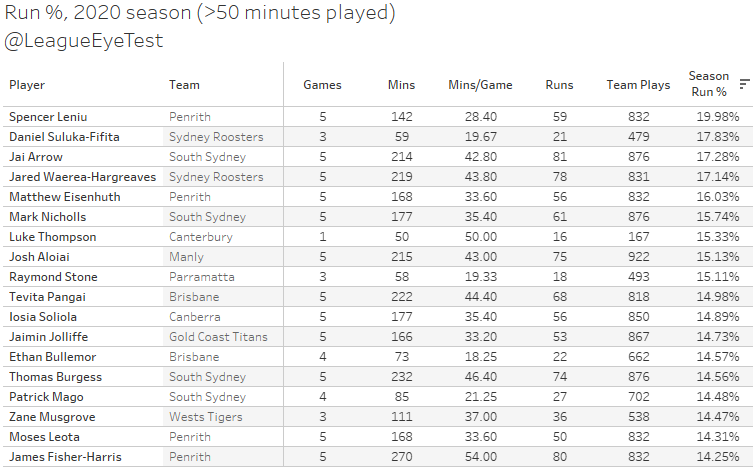
If you’ve been following the Eye Test on Twitter (and you should be), you may have noticed that Leniu has been posting some huge Run % numbers all season. If you don’t know what Run % is, there’s a post on the site explaining it, but in short it’s an advanced statistic that shows the rate at which a player completes runs whilst they’re on the field. Leniu’s rate for 2021 so far is 19.98%, which means he’s completing a run one in every five plays whilst on the field. Further, it means every full set the Panthers have, Leniu is running the ball at once during that set. And his season run rate is 2% higher than anyone else in the NRL, seen in the below table of season leaders for Run %.
That 14 runs in 26 minutes resulted in a Run % of 24.76%, meaning he was running the ball on one in four Panthers possessions. Occasionally you may see that sort of rate for a player playing fewer than 20 minutes, but rarely above it. It’s no wonder than Leniu is becoming one of the premier bench players in the NRL.
Brian To’o continues his domination with the ball
Keeping with the Panthers theme this week, and it’s hard not to with their continued dominance of the competition, is more Brian To’o run domination.
Last week I shared a visualisation of his run attempts and tackle busts, where he’s sitting among the most dangerous in the NRL. This week it’s breaking down the length of his runs.
Below is a plot of the average number of long runs (greater than 8 metres) against the average number of short runs (fewer than 8 metres). Gold data points represent interchange players, whilst blue points represent starting players.

The Panthers winger sits atop the NRL at nearly 16 runs per game of 8 metres or more, with only David Klemmer (14 per game) and Roger Tuivasa-Sheck (13.8 per game) approaching him. Three quarters of his runs are 8 metres or more, which is a considerable percentage when you are running nearly 21 times per game for over 200 metres.
To’o wasn’t a slouch last season either, sitting only behind Jason Taumalolo, Klemmer and Tuivasa-Sheck.
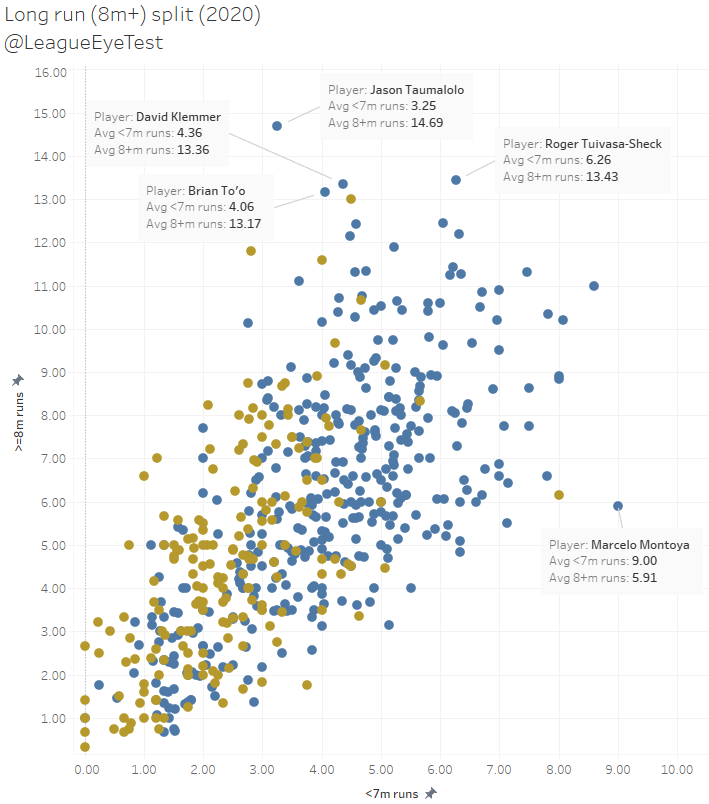
I’ve also noted Marcelo Montoya’s performance on this chart as well as he’s been a huge outlier in two straight seasons now and is almost the antithesis of To’o, with twice as many runs under 8 metres as over it.
If you enjoyed this post please consider supporting The Rugby League Eye Test through one of the links below.
Scan the QR code or copy the address below into your wallet to send some Bitcoin to support the site Scan the QR code or copy the address below into your wallet to send some Ethereum to support the site Scan the QR code or copy the address below into your wallet to send some Litecoin to support the site Scan the QR code or copy the address below into your wallet to send some Bitcoin cash to support the site Select a wallet to accept donation in ETH BNB BUSD etc.. Donate To Address
 Donate Via Wallets Bitcoin
 Ethereum
 Litecoin
 Bitcoin cash
Support The Rugby League Eye Test
Support The Rugby League Eye Test
Support The Rugby League Eye Test
Support The Rugby League Eye Test
Donate Via Wallets


3 Responses
[…] Coaches have responded, utilizing their first interchanges earlier than final season and handing bench gamers more time in total. […]
[…] Coaches have responded, using their first interchanges earlier than last season and handing bench players more time in total. […]
[…] Coaches have responded, utilizing their first interchanges earlier than final season and handing bench gamers extra time in whole. […]