
Another week, another set restart post here on the Eye Test. If nothing else, I know my brand and how to stay in my lane.
Last week I mentioned my holy grail would be pinpointing what tackle and where on the field each set restart was occurring. Thanks to some of the finest minds on NRL Twitter helping me out, that is now possible (for 2021 at least) by combining it with the set restart data I’d put together for last week’s post. We now have the tackle when each restart has occured and an approximate location of where the restart was awarded.
I’ll spare you the details on what t7ype of witchcraft and sorcery led me to collating these numbers, other than again being grateful for some advice and crowdsourcing from some great minds. I’ll also throw out the disclaimer that there are likely some mistakes in this set, as we’re looking at over 1100 set restarts so far this season. All data is presented as is and I take no responsibility for any errors, although the impact of such errors within a sufficiently large data set like this shouldn’t significantly impact any results.
Now that I have this data, what exactly should we be looking for? We know from last week’s post that set restarts are awarded at a lower rate as the game progresses, and as games approach the 80th minute more restarts are awarded to the trailing team. Is it tackle number or location a good place to start?
Friend of the site (and real hooper) James Mack suggested a way of analysing who is gaining the most out of set restarts by looking at the extra tackles generated by a set restart.
The idea is that no team is giving up “six more tackles” because they’re conceding about one third of them on the first tackle. I’m not going to go over this for State of Origin as suggested, but it’s a good starting point for the NRL this season. For simplicity sake I’m counting any restarts awarded on the zero tackle as a “first” tackle. It’s a great idea to see who has benefited the most. But first I’m going to look at who has been conceding the most.
Now that we have the data, we can find out what the average tackle is when a set restart is awarded. Just how many extra play the balls are teams facing when they hold down in the ruck or jump offside?
2.26. Or 2.3 if you’re being generous and rounding up.
Yes, the deterrent for holding down in the play the ball or straying offside during a play the ball is just 2.3 tackles. Most teams could easily withstand an extra one or two tackles, and it’s no wonder that they’re doing it consistently. The consequence for giving away a six 2.3 again is minuscule for the modern NRL team that backs itself defensively. Who needs an extra 20-30 metres of field position anyway?
Looking back at teams conceding, how does that 2.3 split out if you look at the restarts by tackle number and half? The answer is below, showing the % of restarts occurring on each tackle.
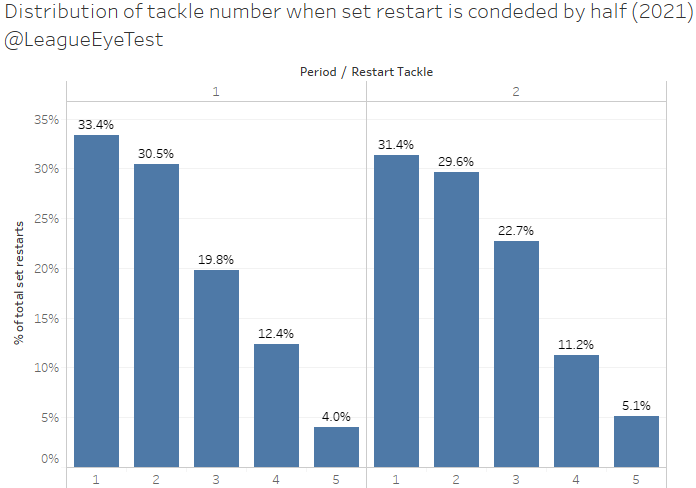
Overall it’s about one third of restarts committed on the zero or first tackle, and another 30% on tackle 2. Almost two thirds of restarts are giving away just one or two extra tackles. I’ve beaten this point to death over the past year but the punishment doesn’t fit the crime. You’re almost disadvantaging yourself by not using them tactically to gain an advantage.
The chart above shows there isn’t much difference between halves, with just over 60% occurring on tackles 1 or 2 in the second half compared to nearly 64% on the same tackles in the first half. The one thing that does change is that there are slightly more third tackle restarts (22.6% vs 19.8%) and fifth tackle restarts (5.1% vs 4.0%) in the second period.
Has the average tackle when a restart is conceded increased or decreased during the season? Again I take you back to Graham Annesley’s quote I used last week that was transcribed by Jason Oliver at the always wonderful Rugby League Writers:
“We have seen an increase in six agains. We’ve seen an increase in six agains early in the tackle count & in particular field positions. So, referees are being reminded, & will continue to be reminded, that they have that [sin bin] as an option.”
If you took this at face value you’d expect to see an increase in six agains early in tackle count. What does the data show though? Here’s the average tackle that a set restart was conceded by round this season.

It looks pretty consistent, mostly between the 2.1 and 2.3 range. If anything, the rounds preceding and following Annesely’s statement that there were more six agains early in the tackle count showed the highest averages since Round 3 at 2.5 and 2.4 for Rounds 17 and 18 before dropping back to the usual range of 2.1 in Round 19.
From this I would again assume that the six agains aren’t happening more frequently, or earlier, but observer bias is making people think they are. Most rounds are falling within 0.1-0.2 of the season average, or somewhere between a 5% and 10% variance which is nothing out of the ordinary.
Back to the season average, does that 2.3 tackle differ by team? If you’ve been reading the Eye Test long enough you’ll know that it does AND I’m going to show you.
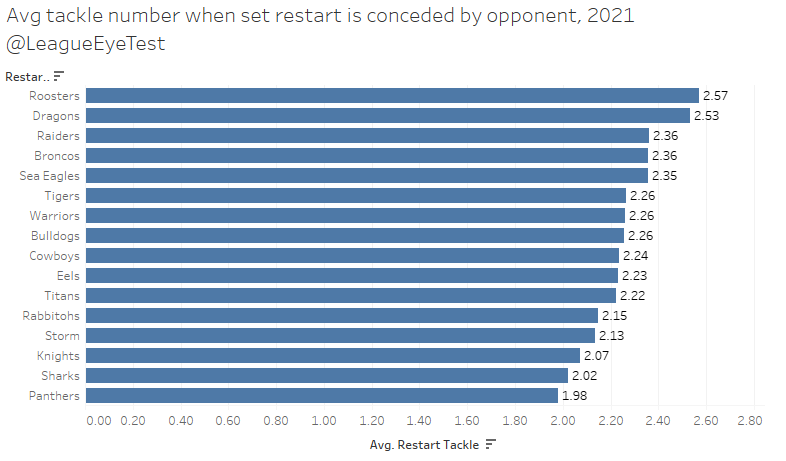
Unsurprisingly the Panthers are giving away set restarts the earliest, conceding them on average just before the second tackle, the only side in the NRL to do so in fewer than two tackles. The Storm aren’t far behind at 2.13, just ahead of the other top four sides in Parramatta and Souths. Again, giving restarts away early and in a safe location is a strategy.
At the other end of the scale, the Roosters give them away on average more than half a tackle later than the Panthers. The Roosters location for restarts conceded differs from the likes of Melbourne and Penrith, who are happy to commit these infringements inside an opponent’s half. They are more likely to give them away defending in their own area, a Roosters trait that has been carried over from conceding penalties in the same way.
Are there any differences if we split that team average by halves? Again, if you’re a long time reader you know there are and they’re below, sorted by first half average.
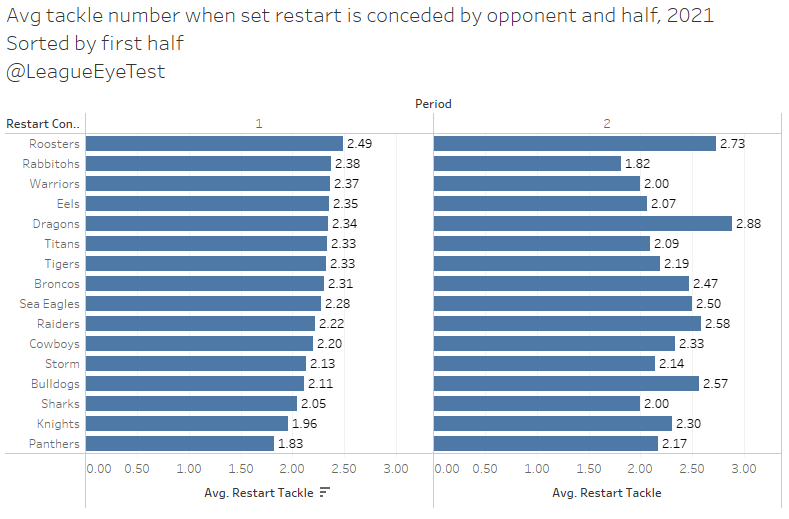
Looking at each half individually shows a few trends. The first is that the Panthers forfeit the extra 2.3 tackles even earlier, on average after 1.83 tackles, and slower in the second half at 2.13. It’s no wonder they’re getting off to fast starts, being incredibly willing to slow the ruck down very early in games to maintain control of a game.
Newcastle manages to dip under 2 in the first half but commit them much later in the second half, at 2.3. The Dragons second half issues might stem from here, where they are allowing a set restart at 2.88, nearly three tackles into a set.
Souths are one of the few who manage to buck the trend and commit these transgressions earlier, going from 2.38 in the first half to 1.82 in the second half, which is the lowest of any team in either half. Melbourne are their consistent best, conceded at 2.13 tackles in the first half and 2.14 in the second half.
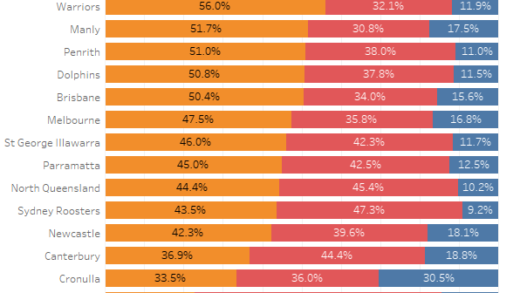
Now that we’ve analysed who is conceding them and on what tackle, what teams are benefiting the most from set restarts? Who is getting them later? The chart is below.
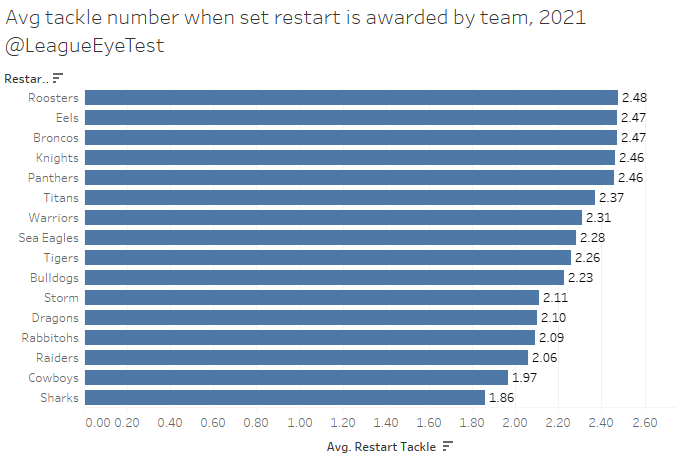
There are five teams whose average tackle for set restarts being awarded is approaching 2.5 – the Roosters, Broncos, Eels, Knights and Panthers. Given their ladder position it’s no surprise that Penrith and Parramatta rate highly here. Melbourne are decidedly mid table whilst the Cowboys and the Sharks are both seeing restarts awarded earlier, with their average under the 2nd tackle at 1.84 and 1.97 respectively.
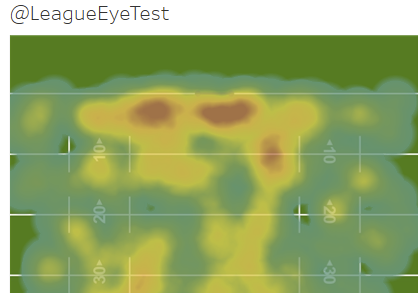
The breakdown of tackle locations for restarts is as you would expect as well, which you can see in the animated gif below. If you’re unsure which tackle you’re looking at check the top left corner, and all teams are assumed to be running left to right.
Locations of set restarts by tackle, 2021 season
The majority of tackle one (including zero) or two restarts are inside 40 metres. Tackle two restarts tend to occur between the 20-50 metre area. Tackle three restarts are mostly between 30m to the opponents 40 metre line. Fourth tackle restarts occur in two places – around the opponents 40 metre line and on the goal line. And the rarest of all, the last tackle restart, is rarely given outside of an opponent’s tryline.
One thing that stands out from this animation is that the proposed change to award penalties in a team’s own half but restarts in the attacking half will only solve part of the problem. There’s still going to be excessive holding down or jumping early by teams desperate to hold out an attacking team close to their line. It is almost as if penalties were the perfect solution and the game removed them to appease nobody.
Surprisingly there’s not a lot of deviation from the distribution of tackles when restarts are awarded when looking at referees. Most of them fall in the one third awarded on tackle one, and another roughly 30% on tackle two, with three notable exceptions.

Adam Gee awards a restart 24% of the time on the first tackle, with 31% on tackle to and 29% on the third tackle, the highest of any NRL referee. He is the only regular official not to have his highest percentage of restarts occur on the first tackle.
Ben Cummins still has about one third of restarts awarded on the first, but his second tackle percentage is just 23% with 30% coming on tackle three. Finally, Grant Atkins has a lower first tackle percentage but the drop from his second to fourth tackle is much lower than the rest of the field.
If you enjoyed this post please consider supporting The Rugby League Eye Test through one of the links below.
Scan the QR code or copy the address below into your wallet to send some Bitcoin to support the site Scan the QR code or copy the address below into your wallet to send some Ethereum to support the site Scan the QR code or copy the address below into your wallet to send some Litecoin to support the site Scan the QR code or copy the address below into your wallet to send some Bitcoin cash to support the site Select a wallet to accept donation in ETH BNB BUSD etc.. Donate To Address
 Donate Via Wallets Bitcoin
 Ethereum
 Litecoin
 Bitcoin cash
Support The Rugby League Eye Test
Support The Rugby League Eye Test
Support The Rugby League Eye Test
Support The Rugby League Eye Test
Donate Via Wallets


Incredible analysis thank you. This illustrates well why the old adage of play to the ref is crucial. I’ve watched +300 nrl games this season (thks covid) & Storm stand out to me as the team who do this the best. They have so many methods in slowing down almost every opposition play the ball & engage with the ref constantly without sanction, this gives them huge momentum as well as pyschological advantages. They are masters of these dark arts & work incredibly hard to perfect the illusion of innocence, hence the early domination & winning the arm wrestle early. Cowboys last week matched them, Todd Payten’s no fool. Love your work💪🏾
Benford’s Law – at work again, pretty incredible!