
Another month has passed in NRL season 2024 and we’re going to have another league wide efficiency update after some team specific deep dives on the Eels and Bulldogs. This marks one third of the way through the season already and the trends we’re seeing are more substantiated.
And one such trend is the Warriors being winless in their last four games and having just three competition points to show from their last five outings. Their inability to score points should have coach Andrew Webster worried.
This was meant to be the “easy” stretch of their season, with games against the Dragons, Titans and Knights. To come out of that with nothing is a big concern, however I’m still somewhat bullish on their chances this season for reasons we’ll get into shortly.
There were some thrilling games during Round 9. The on field margins were down much closer this round after two weeks of extreme blowouts. The average margin after 80 minutes was 10.3 points, well down from the three converted try plus margins of Rounds 7 and 8. It wasn’t close to Round 6, where the average margin was just 6.1 points after 80 minutes.

Round 9 was trending towards one of the lowest average margins since 2016, with scores being only apart by 2.8 points at the 56th minute. A barrage of late tries by the Panthers and Roosters helped push up that average margin into double figures. If you removed those two games, the average margin from the remaining six games was just five points after the final siren. Far more competitive indeed, even if some of the results had tinges of controversy.
With these results and the prior rounds of blowout scores, let’s take full stock of how the NRL’s landscape changed with the Eye Test’s monthly efficiency update.
First as always, the plot of average points scored versus average points conceded to get a sense check of actual on field performance. For this chart, lower is better in defence, further to the right is better in attack.

Cronulla, as league leaders, are the standout here, allowing just under 14 points a game whilst scoring over 27 themselves. The only ones outscoring them are the Roosters at 28.7 per game, and no one is conceding fewer points than the Sharks.
Penrith and Melbourne continue to show strong defences, ranked second and third in points conceded respectively. The Bulldogs excellent defense, which we highlighted recently on the site, is still impressing, allowing just 14 points to the Tigers on Saturday and sitting fourth in points allowed per game at 17.38.
At the bad end of the scale, there’s the Cowboys (25.4) and Titans (28.1) allowing a swathe of points, but they’re still not even in the same ballpark as South Sydney’s horrific 36.5 point average.
Let’s move on to expected points for and against, which serves as a proxy for value of field position gained and yielded. For new readers, there’s an expected points explainer here but basically each start of play (play the ball) is given a value based on the probability of scoring a try from that location on field and tackle number. Again, lower is better defensive field position, and further to the right indicates better attacking field position.

The Warriors position on this chart really stands out, as they’ve been generating the best field position in the competition and allowing the least valuable field position to their opponents. How are they winless in their last four matches? We’ll try to make some sense of that shortly.
Melbourne and Penrith are conceding similar amounts of field position this year, but their biggest difference is coming from possession in attack. The Panthers are second best for the value of their attacking field position at 22.3 per game, whilst the Storm third last at just 16.4. Yet there’s only four points between them – 194 for Melbourne and 190 for Penrith. It’s not about how much field quality position you have, it’s how you use it.
There’s three teams who are granting opponents easy paths to their goal line with Gold Coast, St George Illawarra and surprisingly Cronulla giving up at least 22.5 expected points per game after nine rounds
Now we move on to the context missing from the above charts – comparing points scored or conceded with expected points gained or allowed. Think of it as process versus results. Here’s how the league looks after nine rounds, grouped into four quadrants:
- Dominant – above league average in both actual and expected points per game
- Efficient/lucky – above league average in actual points per game but below average in expected points per game
- Inefficient/unlucky – below league average in actual points per game but above league average in expected points per game
- Incompetent – below league average in both actual and expected points per game

There’s some big changes here from four rounds ago. Penrith have pushed firmly into the Dominant quadrant and are the only real dominant attacking side.
Manly have trended back towards league average in points scored. They sit in a clump of four teams who are treading the boundary of efficient and dominant, with the Dolphins, Cowboys and Sharks. These four sides can score plenty of points, but it’s usually commensurate with the amount of field position they have.
The Bulldogs, Warriors, Raiders, Knights and Eels are the opposite of the above four sides, scoring fewer than league average points and having above average field position. For four of those teams, with their injuries and playing lists that’s understandable. For the Warriors, it’s extremely alarming, and we’ll investigate it more below.
The Roosters, Broncos and Storm are the most efficient team in the league with the ball, scoring more points than league average with the ball despite low value field position. Basically, the teams in these quadrants either score more long range tries (in the case of Brisbane) or need less possession inside 20 metres to cross the line (in the case of the Roosters and Storm).
One of the reasons Brisbane are so efficient with the ball is that they can score tries from anywhere on the field. The Broncos have the second longest average distance per try, traveling an average of at 27.8 metres.

Surprisingly the Dolphins have the longest average distance per try scored, averaging 31.7 metres, ahead of the Broncos and Canberra at 26.8 metres.
Unsurprisingly the dreadful Eels rank last here, at just 16.6 metres when scoring a try, indicating they can only do so when camped in an opponents 20 metre zone. The Sharks are second last here at 17.0, but that is more an indictment of how often they’re close to the line than an inability to score from long range.
Moving back to the efficiency chart, the bottom left quadrant of ineptitude passes the eye test (the real one, not this one), with the Titans, Dragons, Bunnies and now Tigers occupying this space. There was some genuine enthusiasm from Wests Tigers fans after their first few games, but their attack has stalled and their execution inside 20 metres is as putrid as ever.
Now let’s move on to the same chart above but for points conceded and expected points yielded.
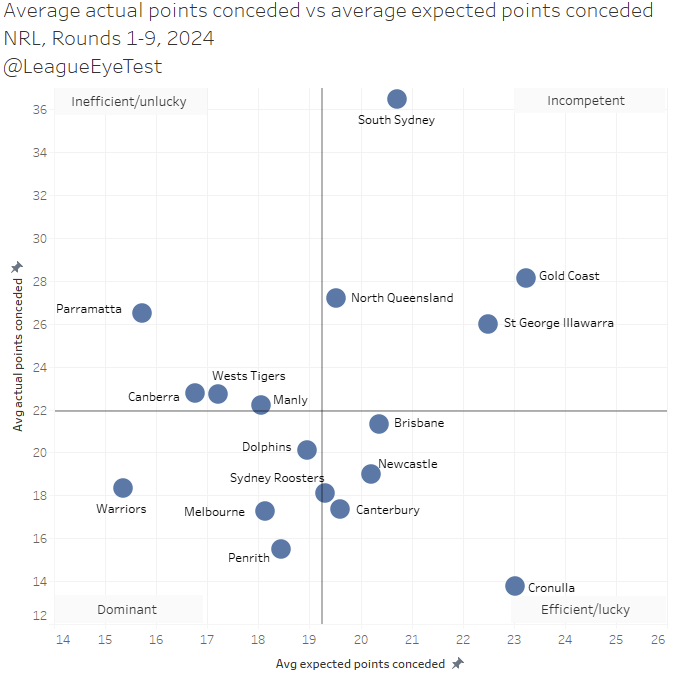
The unserious Cowboys have finally crossed the fence into the incompetent quadrant, joining the Dragons, Titans and Rabbitohs. It’s probably where North Queensland belongs, as we looked into their defensive issues a few weeks ago. Letting Mark Nicholls waltz into a yawning gap in the middle of the field untouched against the Dolphins was a great example of how their attitude defensively continues to be atrocious.
There’s little to add to the Eels after last week’s dissection of their disastrous season, they’re still the most inefficient team defensively and when we get to some of the numbers later Eels fans will just shake their heads. Canberra, Wests and Manly are on the border of inefficient and dominant defensively, which isn’t a bad spot to be. Canberra’s position is actually a success with their injury and lack of experience, showing they may actually be good. However, as we saw above the Tigers attack is bothering no one, and there’s only so many games you can win when you’re scraping together 14 points per game in attack.
Which brings us the dominant quadrant, where the Wahs have set up camp all season. And as you’d expect, we can also see the Storm and Panthers here, but the surprising appearance here is the Dolphins.
Not that it’s shocking for Wayne Bennett coached teams to be strong in that half of the game, but at the same point last season when they had opened their debut year so well, they were still allowing 24.8 points per match. This year that number is down to 20.1 per game, despite the increased focus on wide attacking play this season. I’m sure the Rabbitohs will be hoping he can work some similar kinds of magic at Redfern next season, but they’re also in a lot worse shape than the Dolphins were in 2023.
Wrapping up the efficiency analysis, let’s look at the percentage of points scored above or below each teams expected points.
The Roosters and Broncos look unstoppable here, with the Bondi club a nice 69% above expected for points scored, whilst Brisbane are also 60% above their expected numbers. They’re scoring more than 60% more points than an average team would score given the same field position and possession.

Melbourne aren’t too far behind at +48%, whilst the foursome of Cronulla, THE Dolphins, Manly and North Queensland all range between 30-38% above expected.
At the other end of the scale, it’s back to business as usual for the Tigers, who are scoring at 19% below their expected points, a scenario they’ve been in for what seems like the last decade. For all the improvements Benji Marshall has made, their ability to get over the line on the back of sustained goal line possession hasn’t improved. The forced change to their halves this week on the back of Aiden Sezer’s rightful suspension might be the shakeup they need.
And then we have the Warriors, at -16%. As we saw above, they’re accumulating the best field position in the competition, but part of that is because they can’t break the line either. Their percentage above or below expected is similar to South Sydney (-15.2%) but the Warriors generate nearly five points worth of field position more than them.
I’ve provided the context above, so this next chart is less misleading, looking at points conceded above or below expected points, showing the Warriors are seventh worst in the league at +19.5%.

The context is that whilst they’re conceding 20% more points than they “should” be, it’s magnified because of just how well they’re controlling field position. 20% of 15.3 is about three points, whilst the Gold Coast, who are also giving up about 20% more than expected, are doing so on 23.2 expected points per game.
The obvious standout here is Cronulla, allowing an obscene 40% fewer points than expected. The fact they’re winning these games whilst allowing opponents so close to their line for extended periods is incredibly impressive, and I’d usually advocate this type of defense would fare well in September.
That is until you realise, they’ve played the Warriors, Bulldogs, Cowboys, Raiders (twice), Rabbitohs and Dragons. Hardly a murders row of finals contenders, but You can only play who is in front of you though, and the Sharks will be laughing all the way to a top four spot and a home final as long as Nicho Hynes is healthy.
Their first real test of the season for the Sharks will come on Saturday in Melbourne against the Storm, although they’ll benefit from the absence of Ryan Papenhuyzen and possibly Jahrome Huges. Some clubs get all the luck.
Which gets us to the big question of the week, what do we make of the Warriors? Is the sky actually falling?
In short, it’s not falling but they’re going to reach a point of no return sooner rather than later. The above charts mostly show that their systems and structures are good, especially defensively, something they’ve carried over from last season. I’m a big proponent of process over results, especially when some one or two disallowed tries could swing some of these results. But at some stage the results need to come.
On the positive side, their defense is holding up and they’re limiting teams ability to get the ball in attacking situations. Their defensive metrics are better than last season, and it’s well known how defensively strong teams will usually go further in finals football. The Knights had 21.5 points of field possession in Sunday’s game but only managed 14 points, as seen in the chart of expected points for the game below.

The issue was that the Wahs could only muster eight points on 27.7 expected points worth of field position. On the positive side that shows that when they get the ball, they’re able to get to their spots and put opponents under pressure. It appears they are just failing in execution, which may be related to some predictable attack, something we’ll examine shortly.
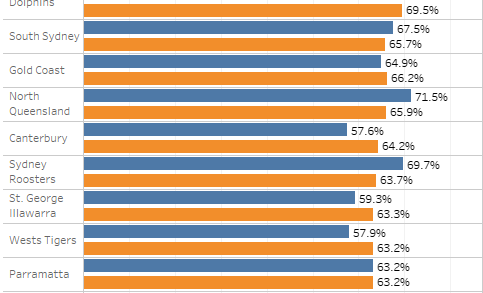
To further highlight just how little quality field position Warriors opponents have, here’s a chart of the percentage of opponents play the balls in their own half, opponent midfield (50-20 metres) and inside opponents 20 metres for the first nine rounds this season.

Teams playing the Wahs have nearly two thirds of their play the balls inside their own half at 64.7% and are one of just four teams above 60%. Additionally, they only allow 12.7% of play the balls inside their own 20 metre area, and no other team is below 16%.
Part of this is that they don’t allow teams significant yardage past the play the ball. They rank 3rd, 5th, 6th and 4th on metres past the play the ball on tackles two through five. Blue is good, orange is bad.

And with the ball they rank for metres gained past the play the ball on tackles two through five ranks 2nd, 5th, 6th and 5th. Again, blue is good, orange is bad.

Which results in their net metres per run (metres per run gained minus metres per run conceded) placing fourth in the NRL at +0.462, only 0.001 behind the third placed Roosters. The Sharks rank behind them at +0.231, which points to Cronulla succeeding more through volume of possession.

In summary, if you want to score on the Warriors, usually you have to work for quality field position. The Dragons game in Round seven being the obvious outlier.
Losing Luke Metcalf to injury after Round 4 seems like an important point in their season. Without him, their attack feels more predictable, and they’ve been incredibly right side dominant all season, and somewhat more so with him out of the lineup. If you look at where they are scoring their tries this season, courtesy of Stats Insiders try location data analysis, of their 28 tries scored prior to Round 9, they have 18% on the left, 39% in the middle and 43% in on the right.
That 18% (5/28) is the lowest in the NRL, with the Dragons being the only other team below 20% of tries scored on the left. The 39% of tries they score through the middle of the field (11/28) ranks first in the NRL, with the only other team above 30% being Parramatta, not the best company. Their right side of 43% (12/28) only ranks 6th, even with them favouring it.
Their heat maps of play the balls corroborate the above numbers. It shows that once they’re inside 20 metres, the Warriors seem to be setting up around the posts with some small spots of yellow on the right, with little action on the left hand side of the field. For most of the field the intensity is directly through the middle, rarely straying outside the tram tracks. Knowing this makes the Warriors much easier to defend.

If you compare the above numbers to the efficient sides this season like Cronulla or the Roosters, you can see they have a much more even spread of play the balls inside 20 metres and more width in general. Not that they’re using a lot of them to generate points.


On the surface it appears that opponents have picked up on how the Warriors are attacking and are loading up on the middle and left hand side defensively to combat the Warriors preference for going right after setting up near the sticks.
Their love for the middle field might be what is making them so predictable. 70% of their play the balls have occurred in the middle third of the field, the highest in the NRL.

It may also be that they’re playing deliberately safer football and hoping their defense can win them games. The Warriors average the fewest errors per game out of any team in the league and looking at their error rate (how many touches of the ball per error), they’re also leading the NRL at 49.3 touches per error.

This does sounds like a positive but there’s an inflection point where playing too safe becomes a negative. If you’re not taking risks, then you have zero chance of them paying off and I’ve looked this previously when talking about how irrelevant completion rates are. It’s about taking the right risks, not just trying to control the ball at all costs. Looking at the above chart, the most efficient scoring teams aren’t handling the ball as well as the Warriors.
For example, Brisbane have the worst error rate in the league at one every 33.5 touches per error. That’s part of the Reece Walsh experience, for every try he creates, he also butches at least one more with a bad pass or fumble. But if you try to coach those errors out of him, you also reduce the number of half chances he turns into scores.
Similarly, the Roosters have traditionally been a low completion rate side, as Trent Robinson knows that some of these riskier plays will pay dividends. And if they don’t, they have the goal line defense to lean back on. This is the sort of approach the Warriors may need to take, as the safer and predictable attack might have reached the limit of how effective it is.
I’ll freely admit I’ve not seen as much of the Wahs as I’d like over the last month, and might be off the mark with some of this assessment. But when I have seen them, combined with the numbers above, they feel like they’re intent on getting through their structures correctly and any instinctive play is secondary and somewhat of an afterthought. Webster will need to evolve with the rest of the league in attack and incorporate some more width, especially early in sets.
At an individual level Metcalf’s absence hasn’t made a huge difference in how much of the ball Shaun Johnson has been seeing, although SJ is clearly not playing at 100% of late. Playing alongside Metcalf for the first four games of the season, Johnson averaged 62 touches a game per Fox Sports Stats. That has only jumped up to 68 per game since Round 5. What has changed is that he’s engaging the line more (13.3 in the first four games to 15.4 in the last five) and running more often (2.0 to 4.4 runs per game), which is an interesting change given he’s playing through an Achilles issue.
The other major change this season was the return of Charnze Nicoll-Klokstad in Round 5 at fullback, taking over for Taine Tuaupiki. CNK has been far more involved with the ball, averaging nearly 42 touches per game, up from the 27 receipts per match that Tuaupiki had. Nicoll-Klokstad is also running the ball more, at 25 times per game, ahead of the 15.7 carries per game Tuaupiki made.
Both fullbacks’ average passes and metres per run are almost identical, meaning the result of their involvement isn’t that different, just the occurrences of it are. And most of the extra carries from CNK are coming after a kick via one pass hit ups. It’s not a monumental change, but it shows that Nicoll-Klokstad has been more involved with the ball than Tuaupiki was, which may also be disrupting their attack.
There’s also been a bigger workload asked of Addin Fonua-Blake in the last month. The front rower averaged just 50 minutes per game in the first four rounds but has had to play an average of 66 minutes from rounds 5-9. In game injuries have played a part in this, but it’s hard to expect him to be as effective in the last ten minutes of a game if he’s playing extended minutes. If their attack relies on the go forward of the pack, having tired middle forwards trying to close out late games isn’t ideal.
Against Manly in Round 6 Fonua-Blake went over 50 minutes before having a rest and ended up playing 73 in total thanks to the 10 minutes of golden point. Hopefully this won’t result in additional wear and tear on such a key forward later in the season. Related to this is Marata Niukore’s absence, which is also another low key loss for the Warriors, and it will be another six to eight weeks before he returns. The depth he brings and strength running the ball will be a welcome return.
There’s been a lot of concern about the Warriors recent form, and rightly so given the lofty expectations, but the numbers support that the way they’ve been playing would usually produce the right results. Their last two losses have come from a combined nine points, and their first two losses of the season were from a combined eight points, including the round two heart breaker against Melbourne. If a few more things went their way, they could easily have five wins instead of three and we’d not be having these conversations.
I wouldn’t be writing off their season just yet, but there will need to be changes made in the short term. The largest problem for the Warriors is how ineffective they are in attack and what they are up against in the next fortnight. They face the red hot Roosters this weekend, who we established before can score from anywhere on the field, which will be a true test of how good the Warriors defense is. And defensively the Roosters are allowing almost the same number of points as the Warriors from worse field position. If there was ever a reason to change things up, this would be the week do to so.
After that they face the improving Dolphins before finally getting their first bye of the season. With several players nursing ailments or sitting on the sidelines, that week off still seems too far away.
The Warriors clearly need to change something with the ball because they’re not taking advantage of the field position they’re creating, and we saw above that they’re not creating a lot of points outside their opponents 20 metre zone. Whether it’s going left more often, taking more risks or reducing the amount of ball through the middle, something must change for the club to succeed this season.
They’ve continued their hard work in defense from last season, but the success with the ball hasn’t followed. A team with these defensive metrics shouldn’t be struggling the way they are, it’s usually the defensively challenged teams like the Cowboys that are more concerning. Webster will need to turn that part of their game around quickly to ensure they’re playing finals football, as with the parity of the NRL this season every result is important.

Well done, what a great analysis of the Wahs current woes, keep up the excellent work😀