
I’ve been covering set restarts on the Eye Test now for over a year and have been wanting to look at restarts in a few different ways. What minute they’re called, the margin when they’re called, which referee is awarding them, where on the field they’re called and which tackle the infringement occurs on. Some of this I can’t do with public data unfortunately, so they will have to be put on the back burner.
Thanks to the Origin break and no need to post any content during the shortened NRL Rounds, I can finally tick off the first three. I’ve now charted every set restart by minute, margin, and referee since their inception in Round 3, 2020. Again a big thanks to friend of the site Liam of PythagoNRL fame for sharing the initial minute dataset that I’ve used to compile this. All data is presented as is and I take no responsibility for any errors.
The positive part of this analysis is that it confirms a lot of suspicions I’d held about when six agains were being awarded. That’s not a bad thing. I always reference Seth Partnow, former Milwaukee Bucks Director of Basketball Research and current NBA analyst at The Athletic, who stated that the art of analytics is “being less wrong“
I’ve written previously about the fact that there’s a huge drop in set restarts in the second half, especially compared to penalties which are actually being called more in the second half this season. That can be seen in the chart below, up to Round 18.
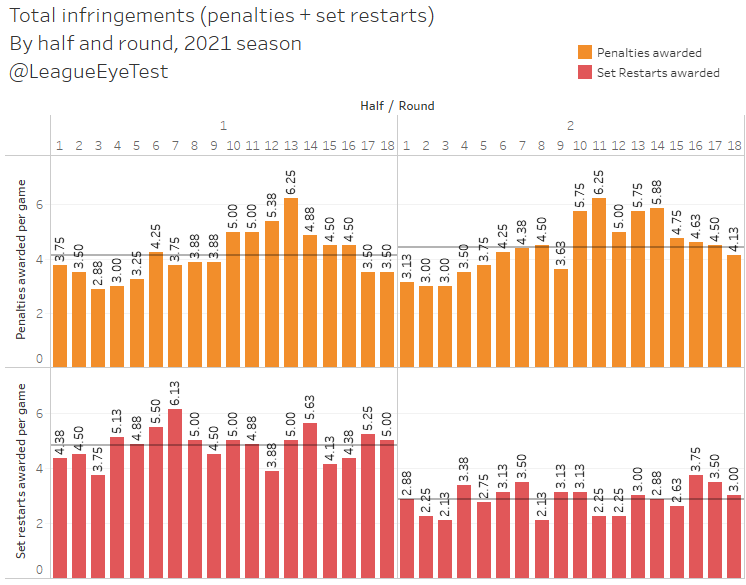
The general flow of restarts within an NRL game appears to move like this. There is a flurry of them in the first half, evenly split between both teams. This slows down after the break and then towards the end of the game you see a few token restarts to the trailing team once the game is truly decided.
Below is the total number of set restarts broken down by minute. Apologies for the next few charts being hard on the eyes, it’s difficult to fit the full 80 minutes in without losing detail.
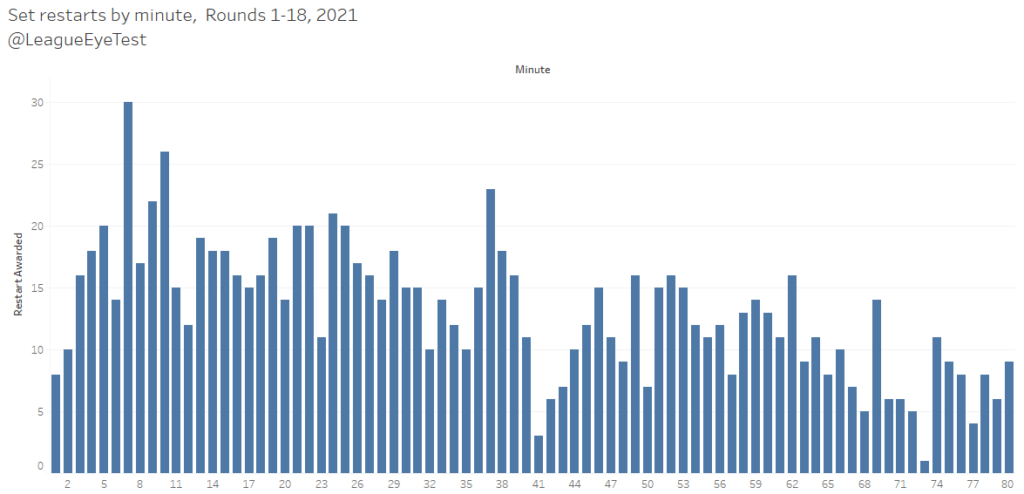
You can see a number of peaks, between the 5th and 10th minutes, between 20th-25th and then again from 35th to 39th minutes. It dries up again as the second half starts, picking up slightly until the minutes hit the mid-50s and then it starts a steady decline until the game ends.
As an aside, in an Eye Test trainspotting moment only I will care about, before this weekend there had not been a set restart given in the 73rd minute of any game this season.
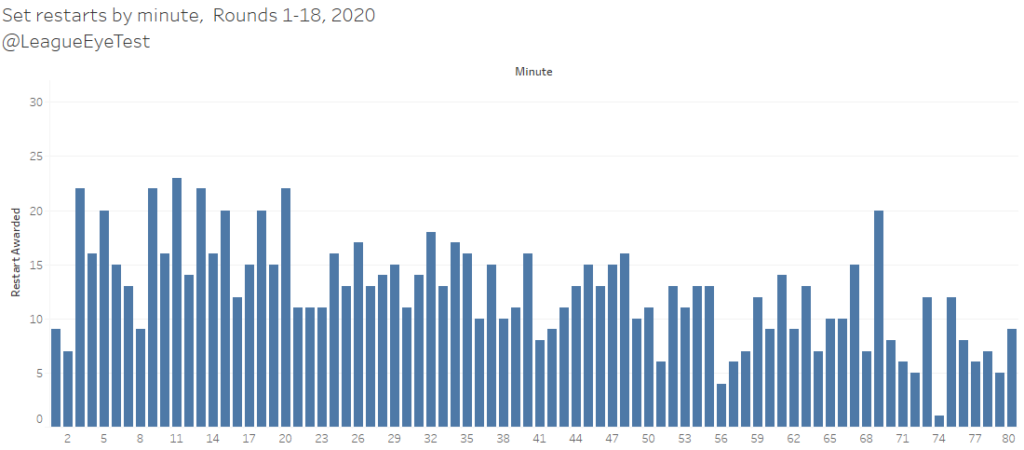
If you look at the same chart for 2020 there’s a similar trend, but it’s a more gradual decline and spread more evenly. Although that 73th minute looks conspicuously like the 73rd minute in 2020.
Do either type of set restart, either 10 metre or ruck infringement variety, get awarded differently throughout the game? Turns out they do. Here’s the above chart with a split for 10 metre infringements (blue) and ruck infringements (orange).
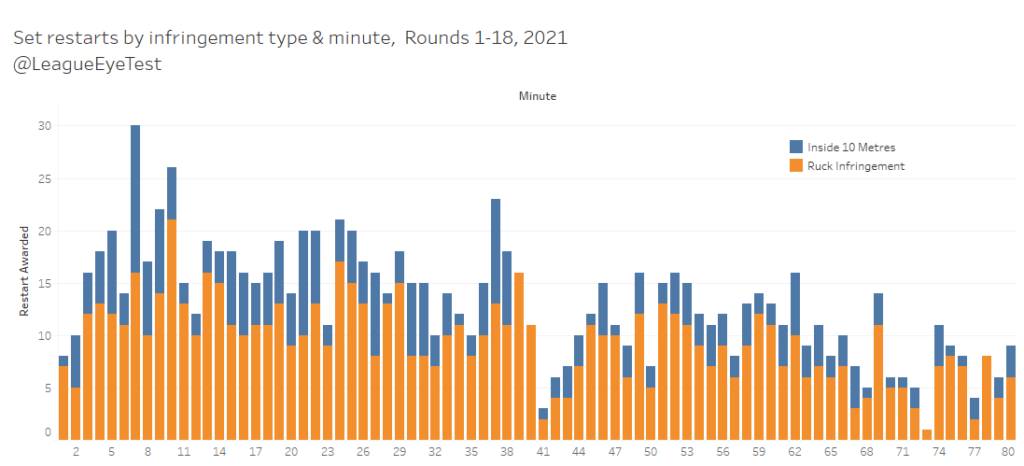
Overall it’s mostly ruck infringements as you’d expect, but early in the first half there’s a decent proportion of 10 metre infringements, possibly as teams are testing referees to see what they can get away with. As the game progresses, offside set restarts start to fade and ruck infringements are the vast majority of those called. It’s a subtler increase though, masked by declining volumes as you can see below.
In another trainspotting moment, there are also three minutes so far this season, the 39th, 49th and 73rd minutes where no 10 metre infringements have been given.
Now that we’ve seen the cadence of what type and when restarts are awarded, are they being awarded more to the leading or trailing teams? Here’s the same chart with restarts coloured by whether the awarded team was even with (blue), leading (orange) or trailing (red) their opponent.
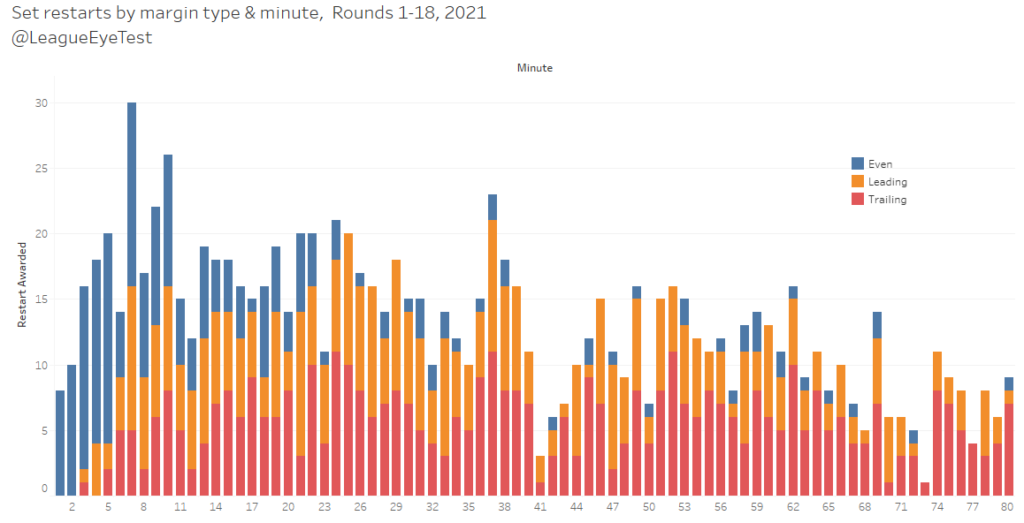
The trends start to become a bit clearer now, even if this chart is difficult to read, fitting in all 80 minutes doesn’t make for a pretty picture. Don’t worry I’ll make it more palatable shortly. What stood out for me was that the trailing/leading split was relatively constant in the first half, but in the second half swung in favour of the trailing team and in the final quarter of the game it is extremely rare for a side leading to be awarded a set restart.
Has this trend changed with the introduction of inside 10 metre infringements? If we group those 80 minutes into ten eight minute buckets compare them to 2020, the results are below.
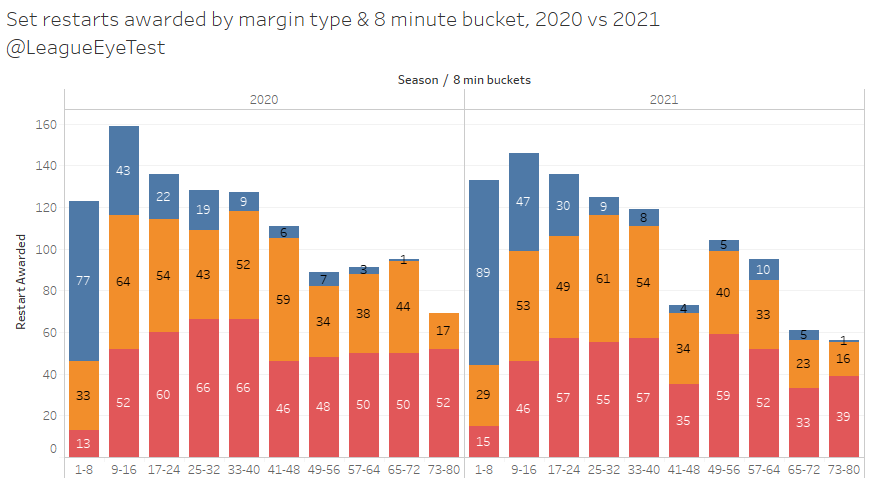
There isn’t too much difference in the decline in 2021 compared to 2020, other than the first eight minutes after the break dropping sharply this season.
It’s easier to see the overall trend here, and the somewhat even split of restarts between trailing and leading teams, leaning slightly to the team ahead on the scoreboard. Once you hit the 50th minute that flips around with the trailing team having a significant advantage in receiving set restarts, even at a ratio of over two to one in the final eight minutes.
Here’s the same chart as above, just for 2021 but showing percentage of margin type and restart type, which further highlights the swing towards trailing teams as the match progresses.
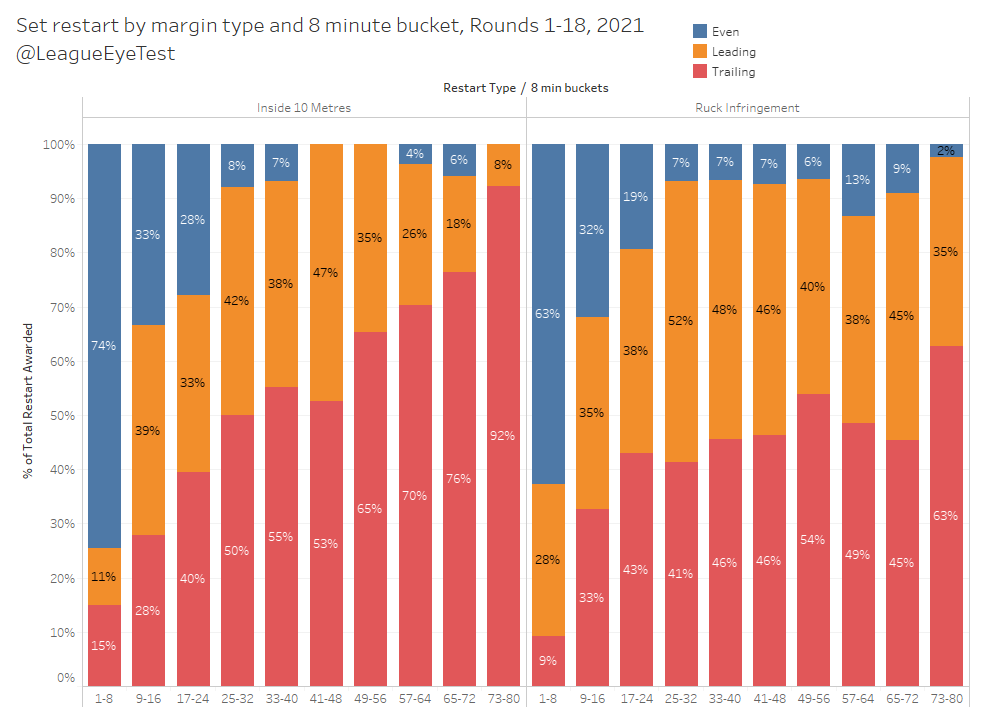
Inside 10 metre infringements hit 50% by the 25th-32nd minute group, and from early in the second half are given to trailing teams almost two thirds of the time. The last eight minutes of a game sees 92% – yes 92%! – of 10 metre infringements given to the trailing side. As shown above those are on low volumes though. There’s only been 13 offside set restarts given this season, and just one has gone to a team leading the match.
Ruck infringements are slightly more even throughout the course of game, until again at about the 50th minute when the trailing side gets a bit more attention. Again the final minutes of the game sees the losing side get almost two thirds of restarts.
What about looking at this data by teams? Surely there are some teams doing this differently? Why yes there are, and there’s no prizes for guessing who, although I won’t reveal everything straight away. First we’ll look at the type of restart by team for 2021.
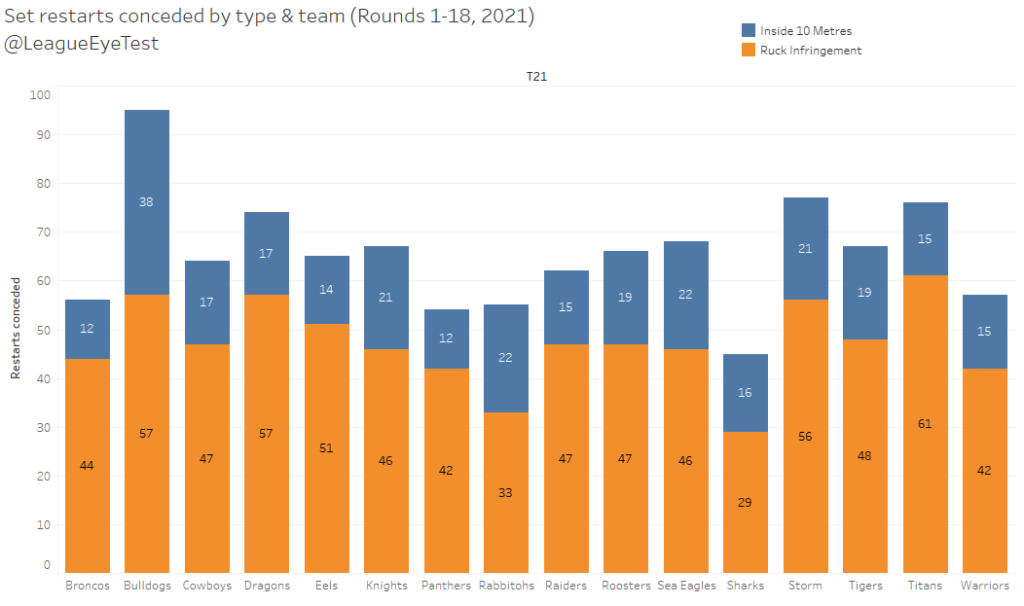
If you need any indication of how poorly the Bulldogs are going, this is great example. A whopping 38 restarts for being offside this season, 16 more than the next placed teams (Souths and Manly). To be that much worse at a fundamental part of the game is ridiculous, if players are consistently unable to remain onside then there are some big problems that I’m not even sure Gus could help. For ruck infringements, the Gold Coast take top spot, conceding 61 ahead of the Bulldogs (57) and Dragons (57).
As we saw above though, there are proportionately more set restarts awarded early in games. What if we only looked at say, the first three eight minute buckets and saw which teams were conceding the most restarts before the 25th minute?
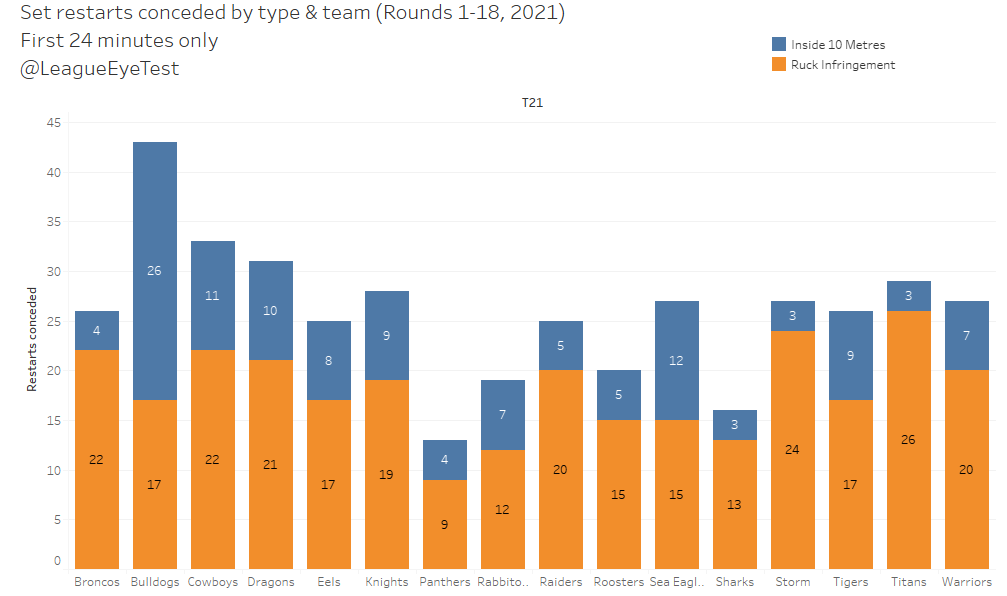
One thing stands out here to me, and it’s not the Bulldogs. It’s the Gold Coast and Melbourne, who have conceded 26 and 24 ruck infringements early, first and second in the NRL. Both have conceded just three offside set restarts over the same period.
If you look at the other sides at the top of the ladder, they’re either no conceding restarts entirely (Penrith), or conceding them at a 60/40 or 70/30 rate like Souths or Parramatta. So why is Melbourne’s trend more like a bottom half of the table team?
Because it appears to be their strategy, which might be clearer if you look at their split of restarts by percentage across all 8 minute buckets throughout a game.
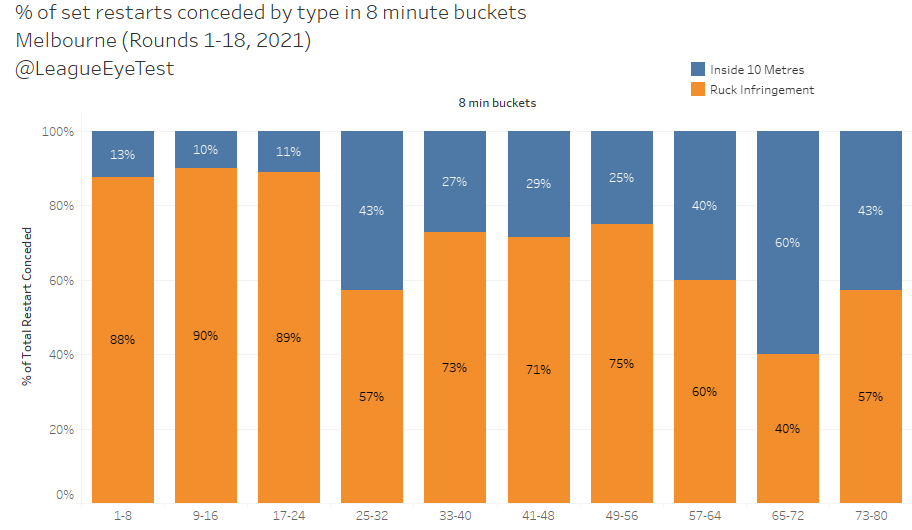
Here we can clearly see that for the first 25 minutes of a game the Storm are giving away 90% of the restarts as ruck infringements, likely from continually attempting to slow down the play the ball and control the speed of the game. As soon as the 25th minute hits that drops back to the 70/30 and 60/40 splits mentioned above and remains there for the rest of the game. During this period, it looks as if Melbourne no longer attempting to slow the pace of the game down. Their aim appears to be to control field position, jump off the line quickly and give opponents as little time as possible to advance the ball.
Why would this work? I’ve already shown that offside set restarts are less likely to be called later in games. If you know that 10 metre infringements are less likely to be called as the game progresses, it makes sense to wait until later in the game to push the boundaries regarding defensive line speed, as there’s a smaller chance you’ll actually be punished for it. And by the time Melbourne start doing it, they’re usually leading games quite comfortably, when they can afford to give away an extra tackle or two. The penalty doesn’t fit the crime.
Finally let’s look at a few charts showing how each referee awards their restarts over the course of a game. With this chart I’m using volumes, and I would focus only on the shape and trend of the chart and not the actual numbers. The main reason for this is that Adam Gee has officiated 19 games so far this season, and no other referee has controlled more than 16. Again, focus on the shape of the chart rather than the numbers.
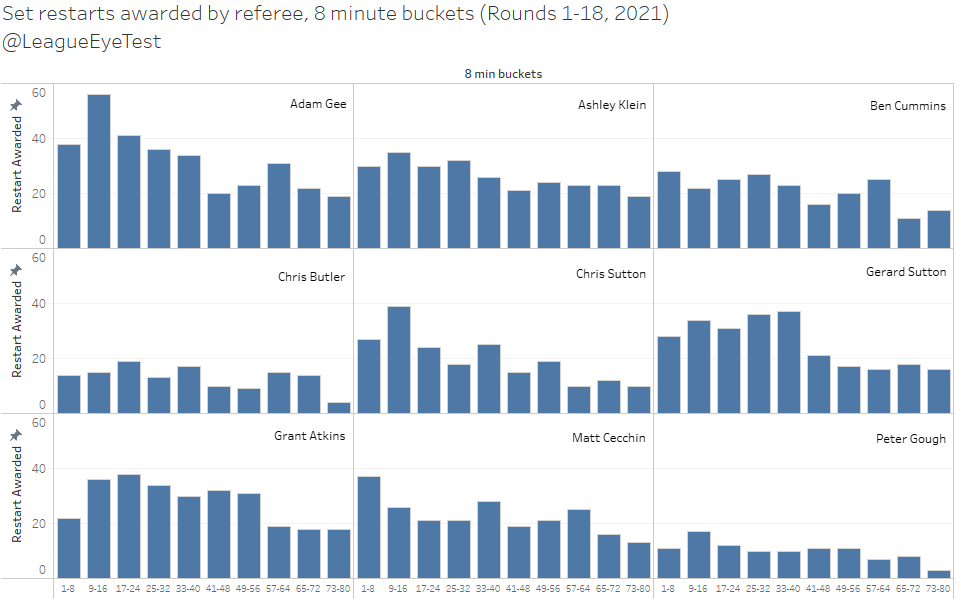
Regular readers might expect Gee to stand out here, given his propensity to hand out restarts early in games. Accordingly, his 9-16 minute bucket is the highest, much higher than any other bucket, and once the game hits 50 minutes his set restarts dry up considerably. Gerard Sutton and to a lesser extent Chris Sutton also have a higher early proportion of set restarts awarded. Ashley Klein also favours the first half but his second half drop is less obvious. Ben Cummins looks to put away his whistle at the end of games, as does Matt Cecchin and Grant Atkins.
Let’s look at the breakdown of each referee and the type of restarts they’re calling, sorted by average ruck infringements (orange) called with inside 10 metre shaded blue.
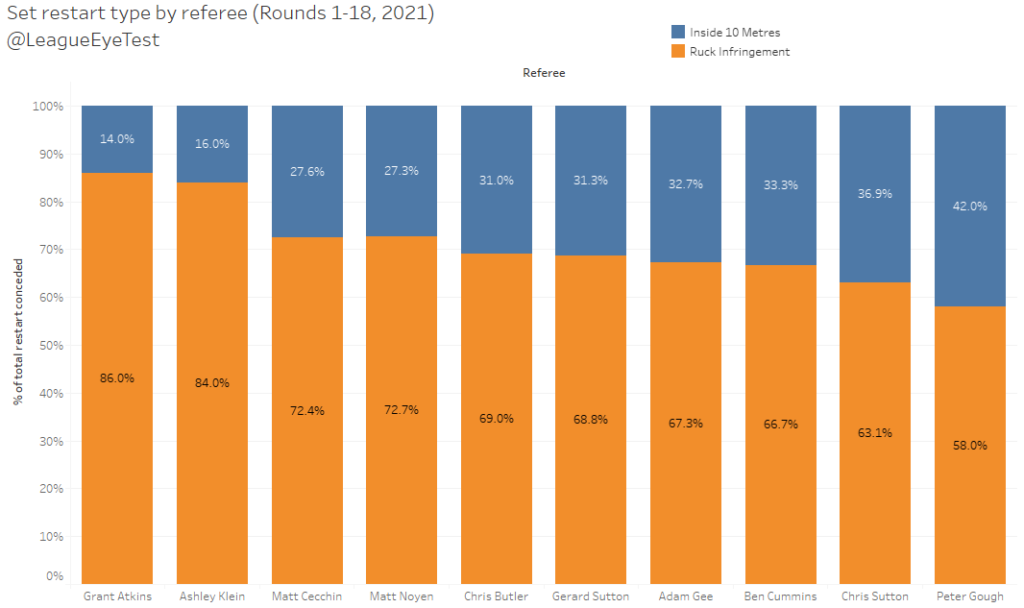
Aktins calls the fewest inside 10 metres, at just 14% of all set restarts, which is incredible considering he’s calling the most of them this season. Klein isn’t far behind at 16%, while Peter Gough is the most likely to call for inside 10 metres with 42% of his restarts called for teams being offside.
To tie this up, the last chart we’re going to look at is whether referees award restarts to teams leading or trailing.
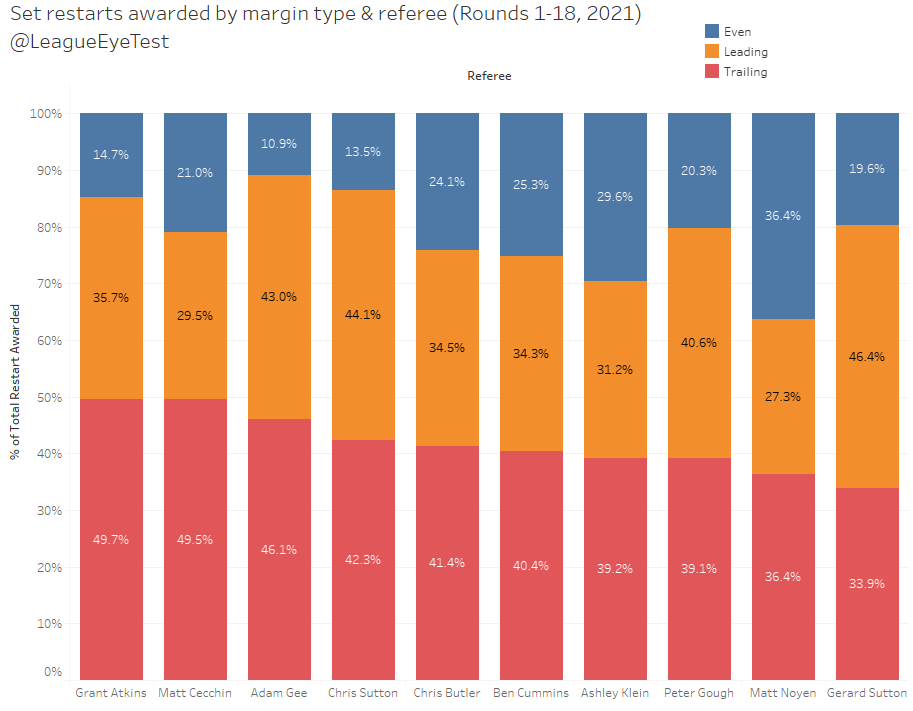
There’s a far bigger difference here than I’d expected, although a lot of that will come down to the abilities of the teams that referees are controlling. Atkins and Cecchin give half of their restarts to trailing teams, whilst on the other end of the scale, the Suttons – Chris and Gerard – give 46% and 44% respectively to leading teams, the highest in the NRL.
Matt Noyen has the lowest percentage of trailing or leading restarts awarded in the competition, but that is due to him officiating more even games than any other referee at nearly 36%.
Has there been an increase in set restarts?
Graham Annesley stated the following statement during his briefing this week, the transcript provided by friend of the site Jason Oliver on his excellent twitter account.
“We have seen an increase in six agains. We’ve seen an increase in six agains early in the tackle count & in particular field positions. So, referees are being reminded, & will continue to be reminded, that they have that [sin bin] as an option.”
I can’t refute the tackle count or field position points, and again, unless some kind soul wants to hook me up with some data. But I can refute there being an “increase” in set restarts. Here’s the same chart from earlier in this post with second halves removed.
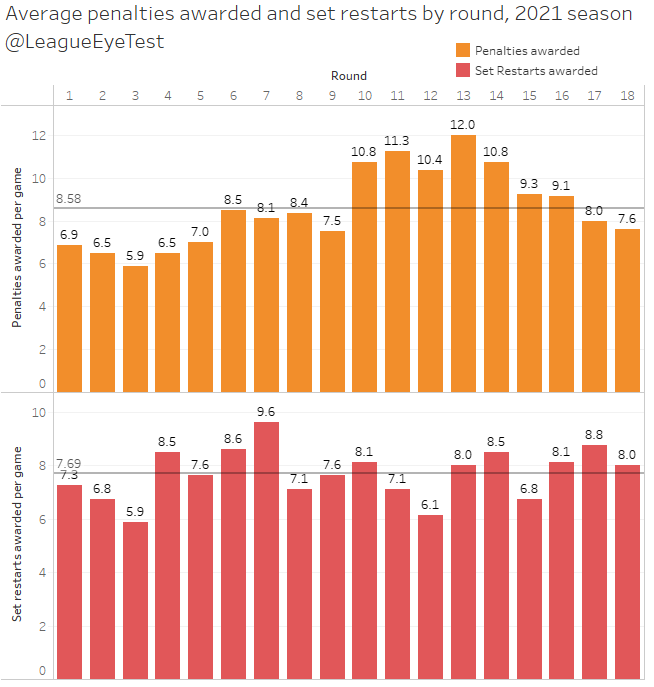
We can clearly see there’s no increase in restarts awarded. And shockingly there’s been a decrease in penalties awarded since the ill fated crackdown.
This is a hot topic again due to State of Origin game three featuring fourteen (yes fourteen) set restarts. Gerard Sutton called 10 in the first half and 12 by the 58th minute. Over half (8) were for offside infringements, including one in the 79th minute of a two-point game.
To put this in perspective there were nine restarts in game one, and 11 in game two. That 14 has only been beaten a handful of times in over 250 in NRL game since the rule was implemented. That’s what was so out of the ordinary on Wednesday evening. But as I’ve shown there haven’t been “more” of them lately.
My theory is that the hyperbolic media people are claiming there are more of them lately is due to observer bias.
It wasn’t just the volume of set restarts that dominated Origin game three, but the cadence of them. Four of those restarts came within one minute of another restart. Only five NRL games have featured at least four back to back set restarts within one minute. This number was the equal with the highest in NRL history.
That is until the Roosters played the Cowboys on Saturday and it happened five times, two by the Cowboys and three by the Roosters including three in half a minute.
The reason for the recent uproar is due to there being two games in the past week that had the most instances of near back to back set restarts that we’ve ever seen. Not more restarts, actually fewer, but they’re bunched together so you’re more likely to remember them. The repeated infringements are more likely to stick in someone’s head and appear to provide easy evidence that there’s more of them happening.
Classic observer bias.
If you enjoyed this post please consider supporting The Rugby League Eye Test through one of the links below.
Scan the QR code or copy the address below into your wallet to send some Bitcoin to support the site Scan the QR code or copy the address below into your wallet to send some Ethereum to support the site Scan the QR code or copy the address below into your wallet to send some Litecoin to support the site Scan the QR code or copy the address below into your wallet to send some Bitcoin cash to support the site Select a wallet to accept donation in ETH BNB BUSD etc.. Donate To Address
 Donate Via Wallets Bitcoin
 Ethereum
 Litecoin
 Bitcoin cash
Support The Rugby League Eye Test
Support The Rugby League Eye Test
Support The Rugby League Eye Test
Support The Rugby League Eye Test
Donate Via Wallets


Amazing analysis there Eyetest! Feels like teams are starting to game the restarts well and thos who do it better win more games.
Thanks for pulling this together!