This week’s NRLW post will be an efficiency update, similar to the monthly posts I’ve been marking for NRLM.
For those new to the site or only following the NRLW content, we look at actual scoring compared with each teams expected points to gauge how effectively they’re using possession, and how capably they are defending against good field position.
If you want an explainer on the site’s expected points model, a lengthy one is available here. Quickly, the short version is that every start of possession is worth a certain number of points based on the probability of scoring from that location on the field on that tackle number.
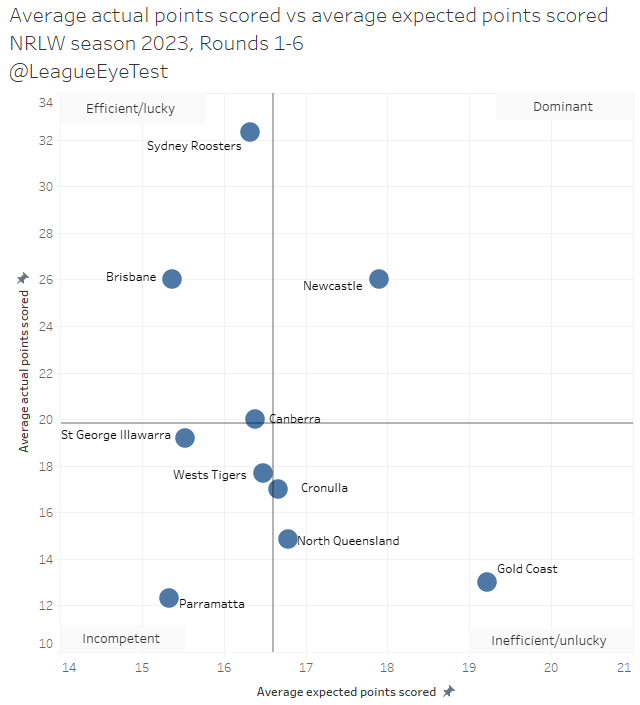
And to start with, we look at a plot of the actual points scored plotted against the average points conceded by each NRLW team to frame their on field performance.
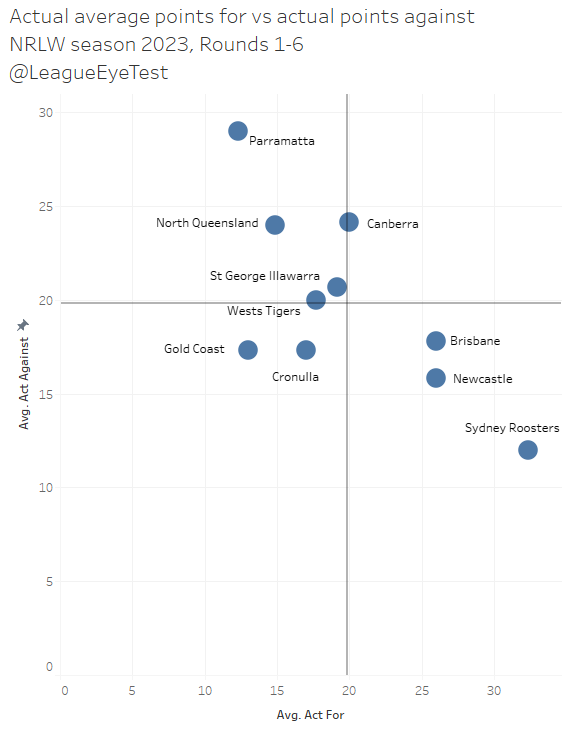
In the bottom right quadrant, we have the Roosters, averaging over 32 points per game and only conceding 12, clearly running rampant over the competition. The other two top teams in Newcastle and Brisbane have very similar scoring ability (26 per game) but the Knights defense is slightly stronger (15.8 v 17.7).
On the other end of the scale, the no longer winless Eels are conceding 29 per contest and only scoring 12.3 themselves. Both Canberra and North Queensland are allowing 24 points per game, whilst the Raiders scoring is better (20/game) than the Cowboys (14.8/game).
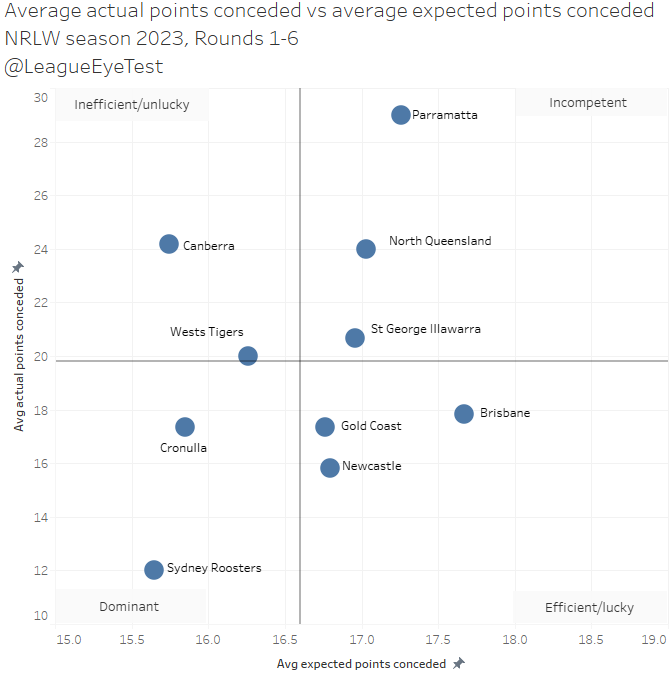
Now we’ll look at the expected points gained and yielded per game, to get an idea of the field position and possession each team has.
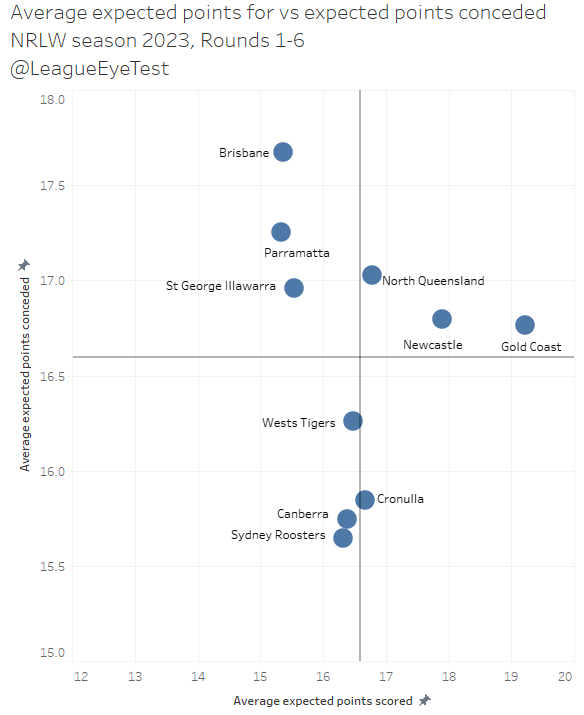
The first thing that stands out to me here from a few seasons of doing this for NRLM, is that the difference from the best to worst team for conceding expected points is just two points. The Roosters only give up 15.7, while the Broncos are last at 17.6. The margin in NRLM is much wider than this.
In attack it’s a little bit wider for the women’s teams, with the Titans leading the way at 19.2 expected points per game. Keep in mind this is the expected value of their position, or what an average team should score with the same field position and possession.
Interestingly the Broncos are also the lowest ranked team for accumulating expected points, at just 15.3 per contest. That’s probably a reason their inconsistent form where they sit in 5th place but are just one of three teams with a positive margin.
It’s also curious to see the Sharks and Raiders grouped with the Roosters on this chart, which would indicate all three have very similar possession profiles, which is remarkable when you look at the difference in on field results.
The Roosters are 5-1 with a +102 difference, the Raiders 4-2 and -23, and the Sharks 2-4 and -2. Clearly one team is far more efficient with the ball, scoring from low value field position, and it shouldn’t take a genius to work out which one I’m talking about.
Now we get into looking at that efficiency. The next two charts plot their actual performance against their expected values. First up is attack, and for those new I’ve labelled each quadrant. From the top left there’s:
- Efficient/lucky – high scoring from low value field position
- Dominant – high scoring from high value field position
- Inefficient/unlucky – low scoring from high value field position
- Incompetent – low scoring from low value field position
Here we can see just how efficient the Roosters are, nearly doubling their expected point total. The only other team in this quadrant is Brisbane, who despite having the lowest average expected points scored per match, are still able to put points on the board.
Newcastle is the only team in the dominant quadrant, an area occupied primarily by Penrith in the NRLM. The mid-pack teams of the Dragons, Raiders, Sharks and Tigers are all grouped around the centre of this chart, not sitting firmly in any one quadrant.
Which leaves us with the Eels, who don’t get close to the line and struggle to score, and the Cowboys who are around league average for expected points gained but bottom three in actual scoring, and the Titans.
The Gold Coast are a special case this season. They have the highest expected point average this season at 19.2 per game, well ahead of Newcastle at 17.9. But they’re only averaging 12.8 themselves, which is only marginally ahead than the attack challenged Eels. Yet somehow, they’re sitting in third place, with a margin of -20.
Now we’ll move on to the same chart again, but for defense, which might explain the Titan’s position.
This chart mostly plays out in order of the ladder. The Roosters are firmly dominant in defense, allowing the least amount of on field points and the least amount of high value field position in the NRLW.
Brisbane, Newcastle and the Gold Coast occupy the efficient quadrant, meaning their defense yields quality field position but they don’t allow a high number of points from that possession. Which most likely explains the Titans, who’ve been able to win games with the defense, but struggle in higher scoring contests. Friend of the site Liam from the Maroon Observer noted their issues scoring points in his excellent weekly recap, which you should all be subscribing to.
If you look at their heat map it explains a lot of those problems.
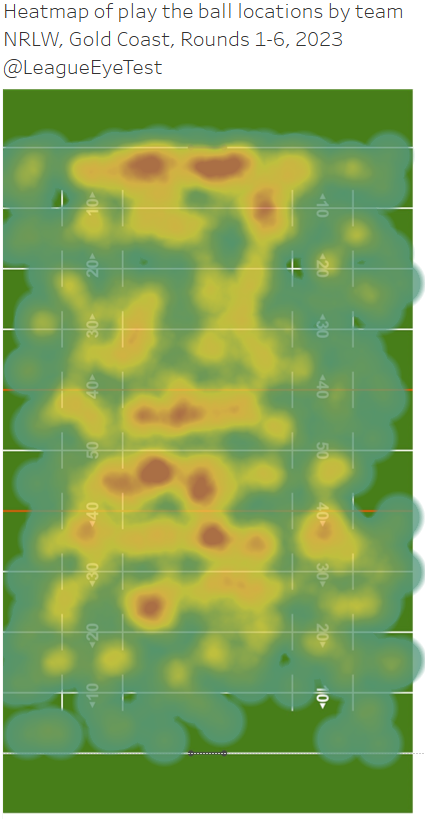
That is an obscene amount of play the balls on an opponent’s line for little reward. Very big Wests Tigers NRLM areas here.
Moving on, we have the bottom three clearly residing in the incompetent quarter, with the Dragons, Cowboys and Eels all conceding a high volume of points off a significant amount of high value field position.
To make these numbers a bit easier to digest, we’ll now look at them by the percentage difference from actual scoring to expected scoring. First up is attack.
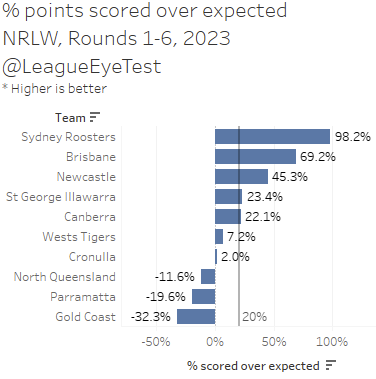
Again, it’s patently clear here how the Roosters are in a class of their own, scoring 98% more points than an average team would with the same field position. Brisbane (+69%) and Newcastle (+45%) also score more than expected at a rate above league average (+20).
On the negative end, the Titans struggles are also very evident as they are posting points at a rate of one third below what an average team would do. Parramatta (-19.6%) and North Queensland (-11.6%) are also scoring below average, whilst 8th placed St George Illawarra’s issue clearly isn’t attack as they rank 4th at +22%.
Now we’ll check the defense chart.
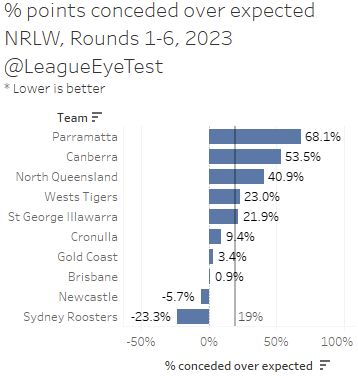
No prizes for guessing how badly the Eels would fare here, allowing 68% more points than an average side would given the same field position and possession. Canberra at +52% isn’t sustainable if they want to secure a finals berth, and the 9th placed Cowboys are also having a bad time this season defending their line as they give up 41% more points than expected.
There are just two teams this season with defenses that allow fewer points than expected, which are (again not surprising if you’ve been paying attention) the Knights at -5.7% and the Roosters at -22%.
We can sum this up by looking at net “wins” over expected. Simply we’re comparing actual wins with whether a not a team came out ahead on their expected points.
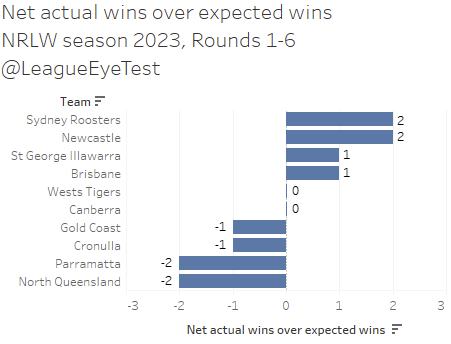
It’s the two favourites again here, with the Roosters and Knights both +2, indicating they’ve won two games that they should have lost based on expected points. The Dragons are also at +1, which means they’ve won one games they shouldn’t have, which is more of a feather in Teagan Berry’s cap than a verdict on the side itself.
At the other end of the chart Cowboys and Eels are all -2 net wins, meaning they’re underperforming against expected results. And the Titans are -1 for net wins, they should be 5-1 based on expected point outcomes. It also means they’ve had better field position than their opponents in every game this season but one, and clearly aren’t making the most of it.
That the Gold Coast has won four games, with two of them by just a single point, shows just how difficult they’re making things for themselves. If they put it all together then they could be a good shot at making the grand final given how close the rest of the competition is behind the top two.
Oscar from Rugby League Writers broke down some of the excellent play of their left centre Jamie Chapman in their NRLW rap this week, and if they can continue to feature her in attack their point scoring issues may become a thing of the past.
The Wests Tigers, Canberra and Cronulla have all looked promising at points this season, but the numbers above suggest that the Titans may be the team with the potential to knock off the Knights or Roosters.
Expected point charts
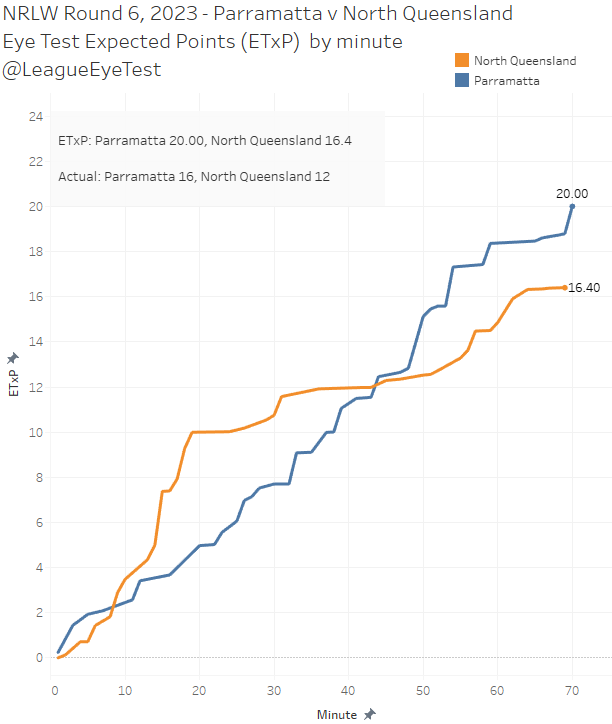
Parramatta v North Queensland
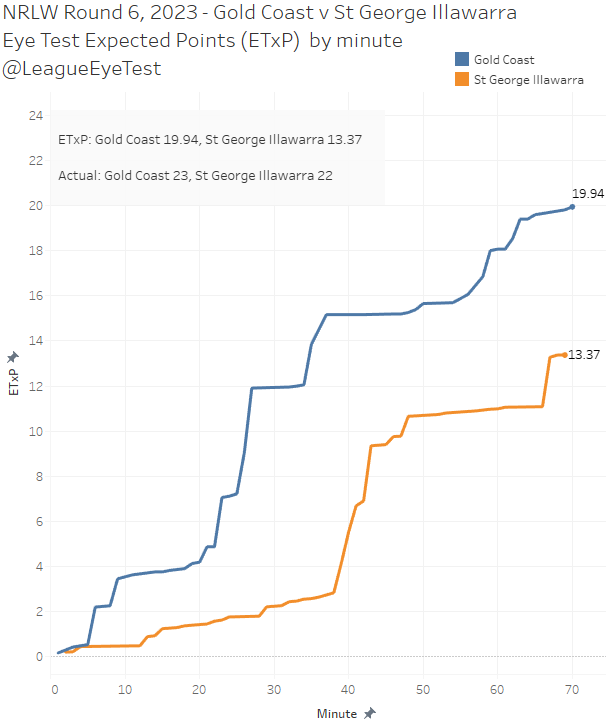
St George Illawarra v Gold Coast
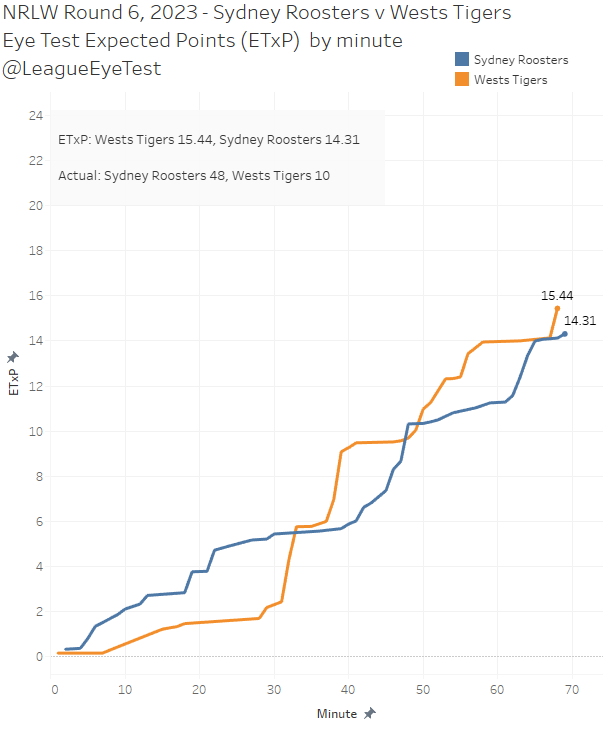
Sydney Roosters v Wests Tigers
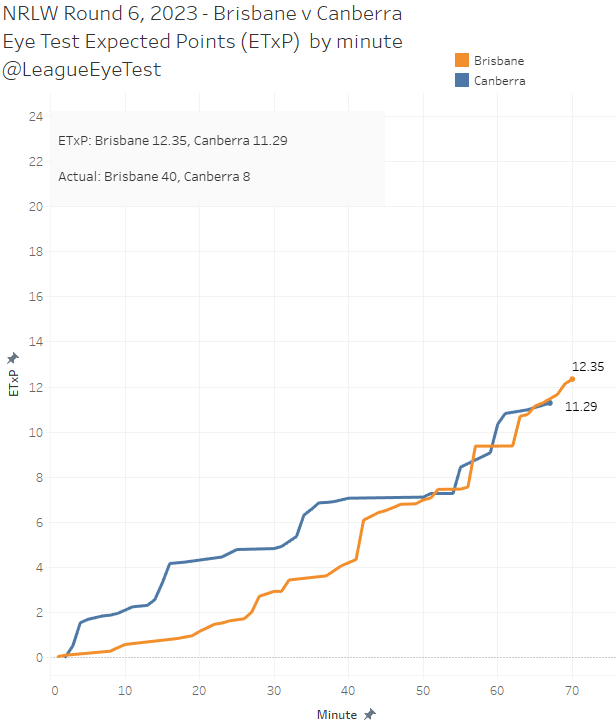
Brisbane v Canberra
Newcastle v Cronulla

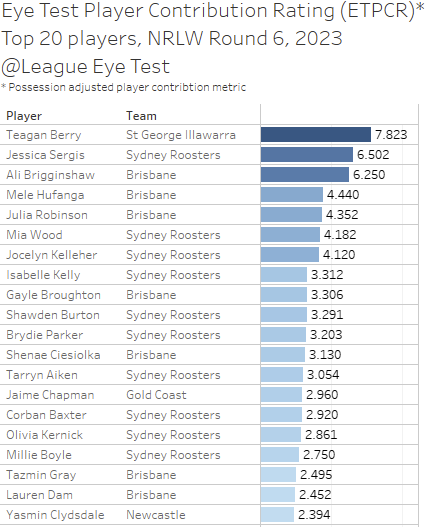
Eye Test Player Contribution Rating (ETPCR)
Here are the top 20 players for Round 6, led by Teagan Berry from the Dragons on the back of a four try performance in their one point loss to the Titans.
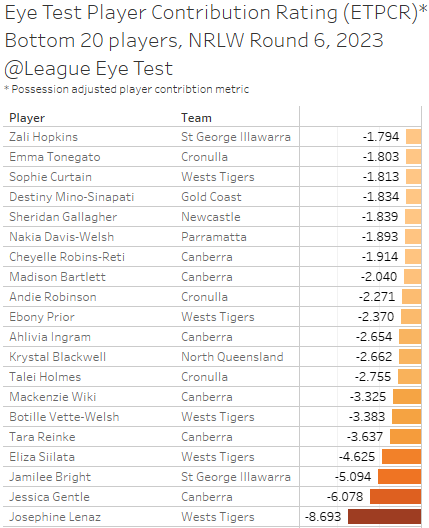
And now the bottom 20 players for the round.
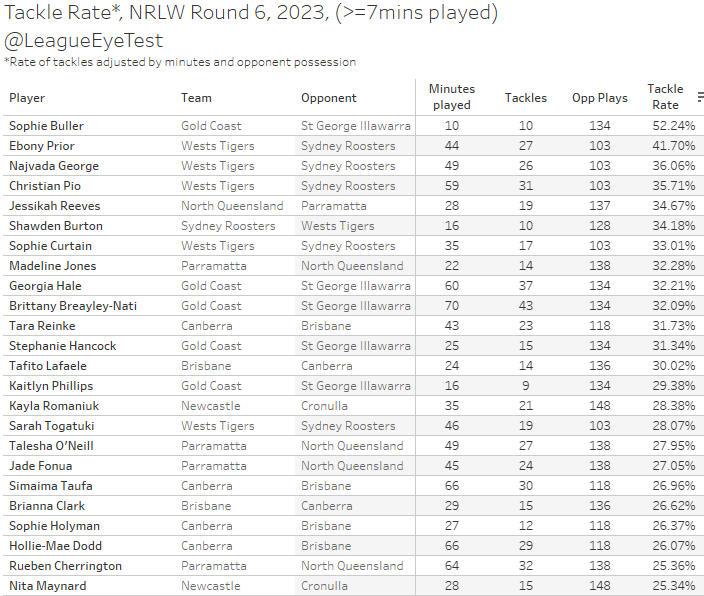
Tackle Rate
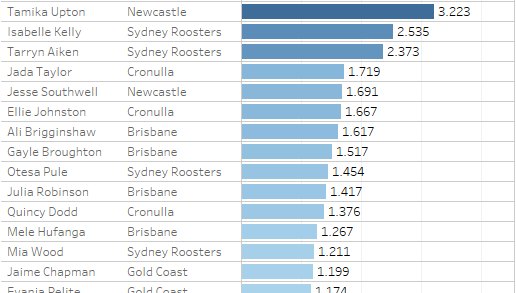
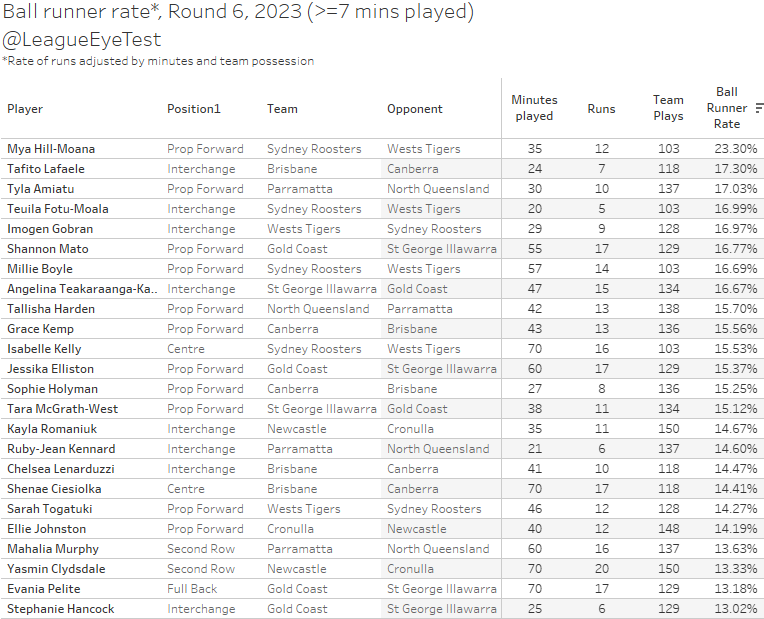
Ball Runner Rate
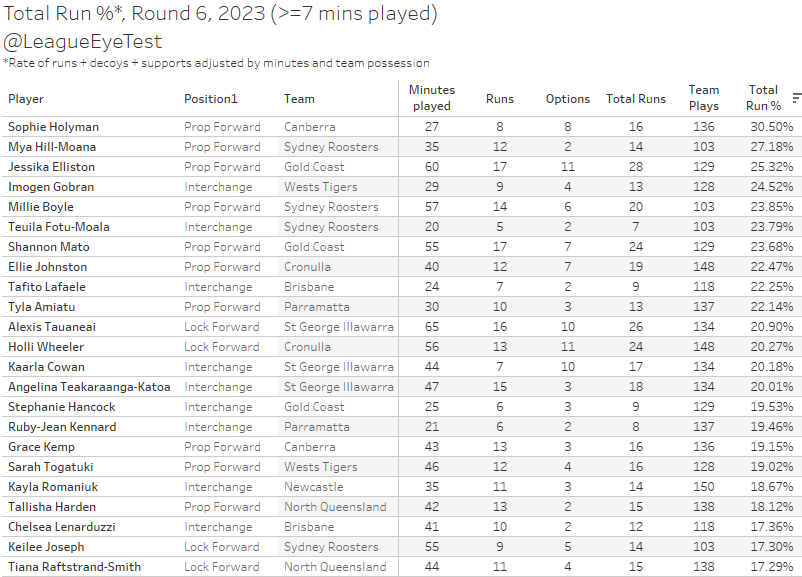
Total Run %
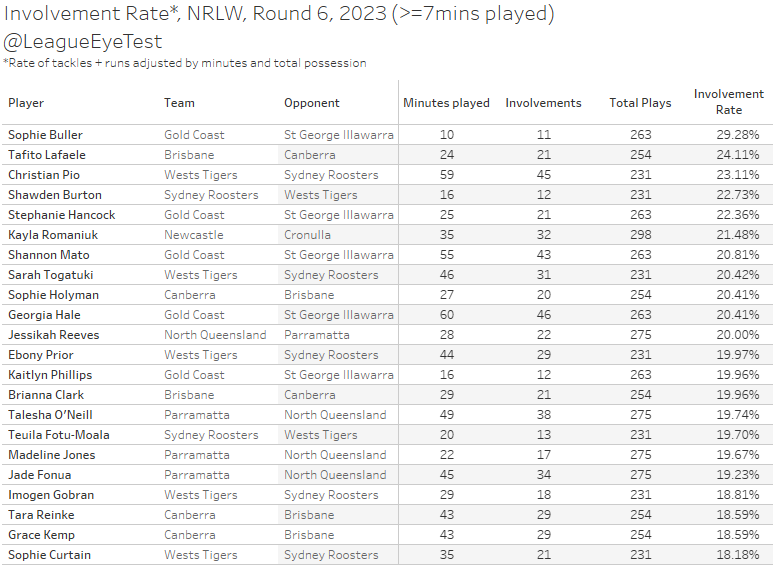
Involvement Rate