We’ve now had two rounds of the NRLW season and there’s only two undefeated teams remaining.
League leaders the Wests Tigers have looked dominant in their two matches this season, following up their 36-8 thumping of Parramatta with a 10-0 victory over the Sharks. The other undefeated team, Gold Coast, took a more difficult route to their second win, requiring extra time to squeak past Brisbane by a single point.
At the other end of the table, the Broncos are 0-2 but were more competitive against the Titans than they were the Roosters, but probably should have lost by more (see below).
Parramatta have picked up where they left off in 2022, already sporting a -54 point differential. Sadly for Eels fans, they’re unlikely to be able to backdoor their way into the grand final this year with one win due to the additional four teams.
I’d also like to thank everyone for their support and comments on last weeks post, and for those who read and shared it. Sadly these posts are still only generating 10-15% of the traffic that a NRLM post, but I’ll be soldiering on and hoping that builds as the season progresses.
Both myself and Liam from the Maroon Observer are in this for the long haul, the game deserves the same quality coverage the men’s competition gets. And hopefully with less crisis merchants. If you want this type of content to continue, spread the word and encourage people to read and share it.
Let’s get stuck into some expected point charts from Round 2
Brisbane v Gold Coast
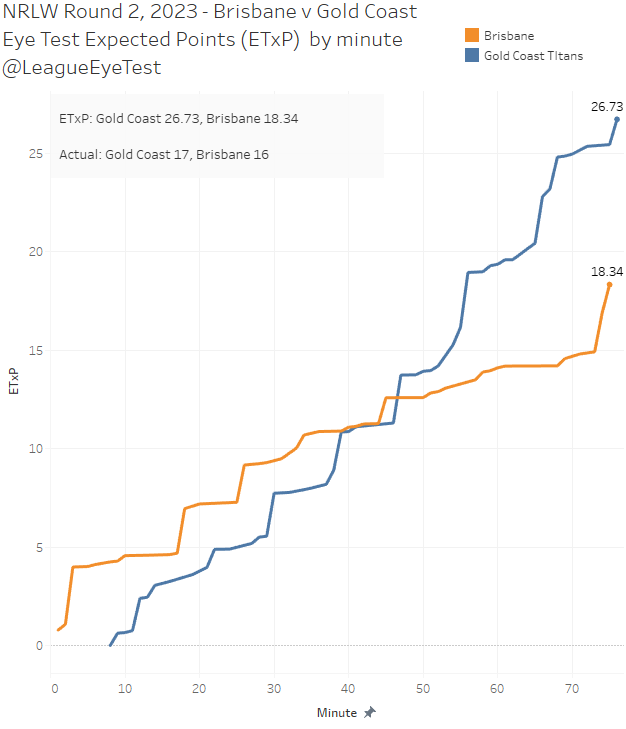
As referenced above, as much as the Broncos looked more spirited they were still far behind on expected points, with the Gold Coast ahead 26.73 to 18.34.
The Titans had better high point value possession in the first half, but really kicked on with it after the 47th minute until the end of the game when they started to really pressure the Broncos try line. Fox Sports Stats has the Titans down for 31 tackles inside 20 metres in the second half, which is higher than almost every other team’s total after 70 minutes.
Brisbane responded by not doing a lot, as you can see by the relatively flat line until the game reached Golden Point, where they had just two play the balls inside the Titans 20 metre zone. The Broncos finally realised they needed to score, something they hadn’t bothered to do since the 43rd minute. But the Titans beat them to it.
Canberra v Sydney Roosters
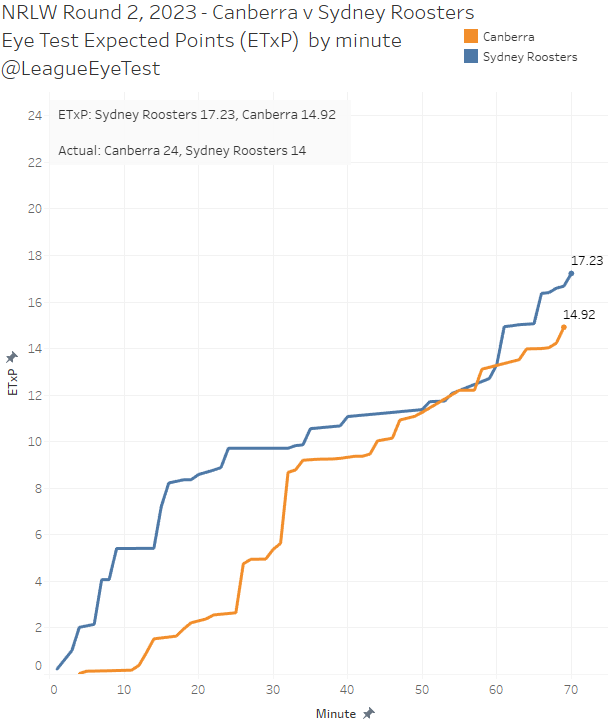
In what might be a first for the Raiders in either competition this season, they won a game where they were behind on expected points, AND held on to a late lead. The Roosters dominated early, something friend of the site Dan from The Sportress noted in his match review
But Canberra was able to claw back with some quality field position late in the first half and take the lead 6-0 into the break.
The interesting thing about the expected point chart is that neither side looked to dominate field position after the break. Play the balls inside 20 show this as well, with the Roosters seeing 11 of them and Canberra 12. The Roosters got close late but a try to Monalisa Soliola in the 63rd minute sealed the debut win for the Raiders.
Oscar of Rugby League Writers has a great breakdown of how Zahara Temara’s kicking game helped steer Canberra to this win.
St George Illawarra v Parramatta

Another blowout of the Eels, although the expected point chart paints a far rosier picture than what we saw on the field. Parramatta did see some high point value possession early and managed to tie things up at 4-4 after 12 minutes. However, from that point on it was all red and white as the Dragons led comfortably 20-4 at the half, already outstripping their expected total for the game of 16.60.
Things continued from there with St George Illawarra piling on another four tries from low point value possession in the second half as the Eels were continually pinned in their own half. It’s only two rounds into the season but it’s probably safe to put a pen through the chances of the blue and gold being there on grand final day.
Newcastle v North Queensland

This is one of the stranger expected points charts I’ve seen. The game was fairly close in the first half, with the score 12-10 to the Cowboys on the field and at a shade under 8 for expected points. After the long break the Knights ran in two quick tries on the back of some strong field position, but did not have a play the ball again after the 54th minute.
From that point onwards it was a North Queensland domination as they rattled off 19 straight points to secure a victory. They’ll want to control their discipline (9 penalties to 5, including a sin bin for April Ngatunpuna) moving forward, as they won’t be gifted possession every week as the Knights did by doubling the Cowboys error count.
Wests Tigers v Cronulla

Round 2 ended with the form team of the competition so far pitching a shutout over the Sharks. The Tigers defense was on show in this game, with the Cronulla having enough high point value possession and field position to win the game on expected points 15.47 to 14.00. They even had a similar level of possession to the Tigers, both completing 29 sets during the game.
But it’s what you do with the ball that matters, and Cronulla’s NRLW team were as toothless as their NRLM team was as neither side being able to trouble the scoreboard all weekend. In this game Cronulla had 24 chances inside 20 but came away with nothing, while the Tigers only needed 21 play the balls inside 20 to post their 10 points.
I’d also recommend reading this week’s edition of Beyond the Goalpost, which has a great breakdown of the Raiders and Tigers victories.
Now let’s look at the advanced statistics for Round 2.
First up is the top 20 players by Eye Test Player Contribution Rating (ETPCR)
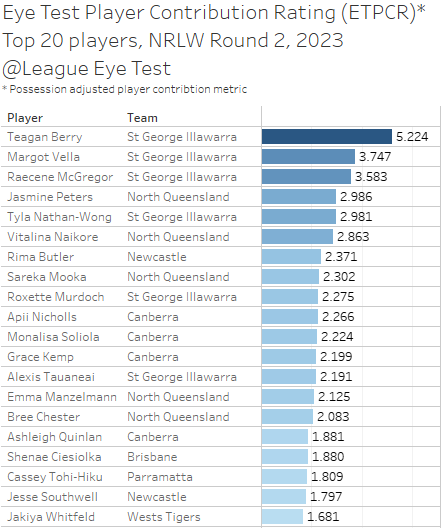
Given their significant margin of victory over the Eels, it’s not surprising to see Dragons players take the top three spots here. Fullback Teagan Berry led the way with an ETPCR of +5.224, while winger Margot Vella placed second with +3.747 and halfback Raecene McGregor third with +3.583.
St George Illawarra also had Tyla Nathan-Wong in 5th spot with +2.981, giving them four of the top five spots overall. Only North Queensland centre Jasmine Peters (+2.986) split the Dragons players.
Here are the bottom 20 players by ETPCR from Round 2
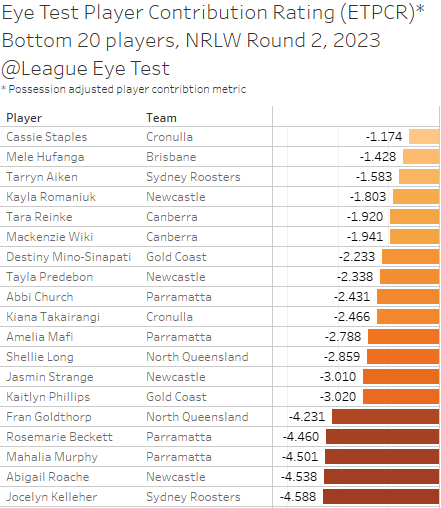
Despite losing heavily to the Dragons, Eels players aren’t featured as heavily as I would have expected here. Sydney Roosters halfback Jocelyn Kelleher had the lowest ETPCR this round at -4.588, with Newcastle centre Abagail Roache close by at -4.538.
Parramatta players then featured with the third and fourth lowest scores of the weekend, by Mahalia Murphy (-4.501) and Rosemarie Beckett (-4.460). North Queensland fullback Fran Goldthorp also had an ETCPR of -4.231, marking five players lower than -4 for the round. Round 1 only had a single player ETCPR of -4 or below.
Tackle Rate
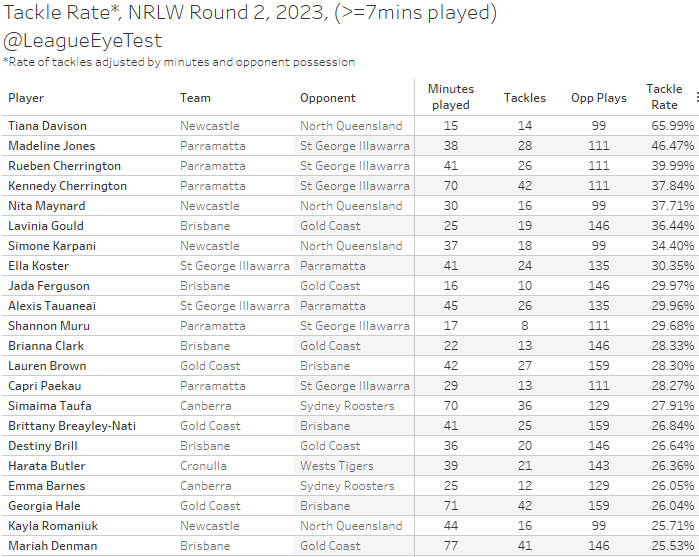
Tiana Davison of the Newcastle Knights had the highest Tackle Rate for Round 2 at 66.59%. This would indicate that she completed at tackle on two of every three play the balls she faced whilst on field. Second place went to Madeleine Jones of the Eels at 46.47%, with Rueben Cherrington in third place at 39.99%. That was slightly ahead of her sister Kennedy, who had a tackle rate of 37.84%. Given how much possession the Dragons had it’s not a shock to see so many Eels at the top of this list.
Ball Runner Rate
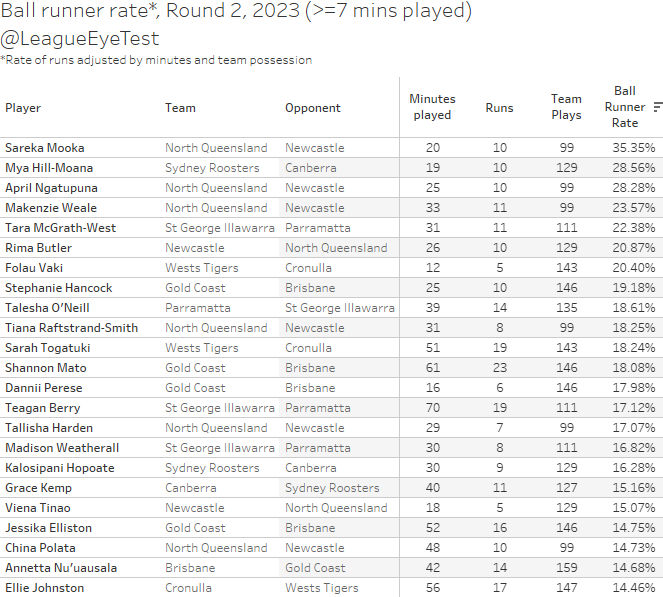
Sareka Mooka led all NRLW players in Ball Runner Rate for Round 2, at 35.35% which means she completed a run with the ball on over three in ever ten play the balls whilst on field. Sydney Roosters forward Mya Hill-Moana placed next with a rate of 28.56%, followed by another Cowboy in April Ngatupuna (28.28%).
Total Run %

Mooka also led the Total Run % metric as well this round, after adding in option runs (decoys and supports). Her 42.42% placed her ahead of second placed Hill-Moana at 31.42% with Ngatupuna in third again with a rate of 31.11%.
Unlike the NRLM, there hasn’t been a lot of differences between Ball Runner Rate and Total Run %. This is mainly due to there being less support and decoy runs in the NRLW as teams are putting fewer players in motion and running simpler plays. Hopefully we’ll see that change as the season progresses.
Still there were a few players with a high number of option runs this weekend. Shenai Lendill from the Dragons posted 12 option run in their victory, whilst Mariah Denman had 18 option runs during the Broncos golden point loss to the Titans.
Involvement Rate
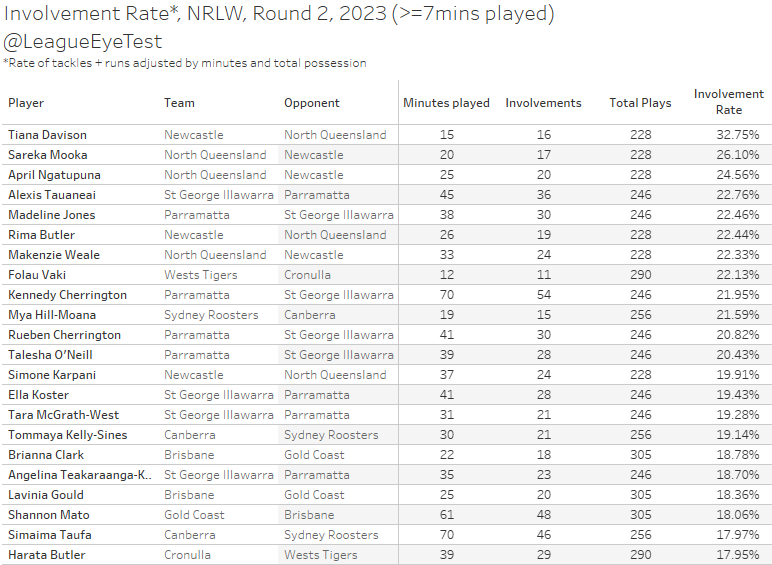
Davison pops up again here with an involvement rate of 32.75%, which indicates she completed a run or tackle on over three out of every 10 play the balls whilst on field. Mooka slotted into second place at 26.10% and Ngatupuna third with 24.56%.
Kennedy Cherrington also stands out here, playing the full 70 minutes for an involvement rate of 21.95%. Usually involvement rate declines as a players minutes increases, so it’s a testament to her work rate that she’s placed in the top 10 despite not getting a rest during the match.