The month of July has seen three teams go 4-0 in the NRL – Penrith, Brisbane and … *checks notes* Newcastle?!
After some progress in June where they lost three games by a combined fourteen points, including margins of four to second placed Brisbane and eight to the first place Panthers, Newcastle has strung together four wins on the trot during the past month.
The most impressive was Round 21’s 26-18 victory over Melbourne where they chased down a 12-0 lead after eight minutes. They won that game with their defense, something you’d not often say about Newcastle, as they didn’t cross the try line after the 44th minute and had to withstand a barrage of late Melbourne attack.
Adam O’Brien has his detractors during his stint with the red and blue, and rightly so given the lack of effort in some of their losses early in his tenure. But improvement isn’t always linear. He has stuck to his guns this season and this Newcastle team might have finally turned the corner. Which makes it even stranger that the Knights were reportedly interviewing Justin Holbrook as recently as last week.
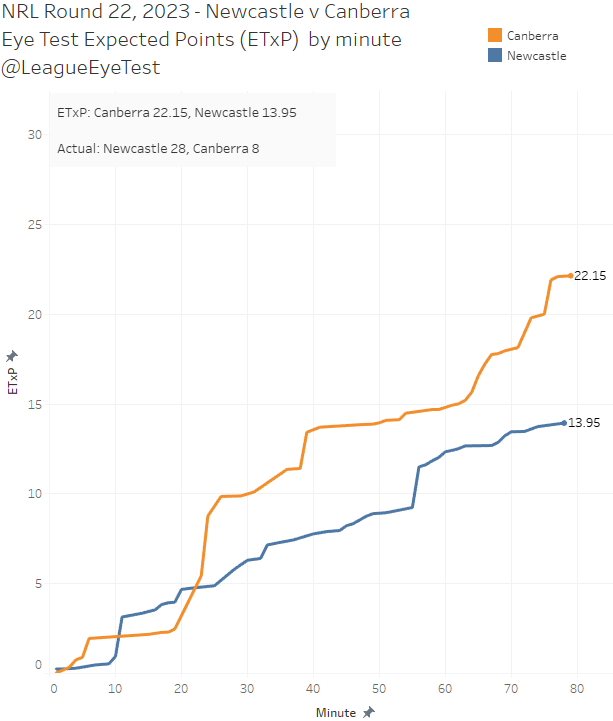
Saturday’s win over the Raiders was another example of the Knights winning defense winning them a game they should have lost. Under the Eye Test’s expected point model (ETxP), the Raiders had enough possession to win the game 22.15 to 13.95, as the chart below shows.
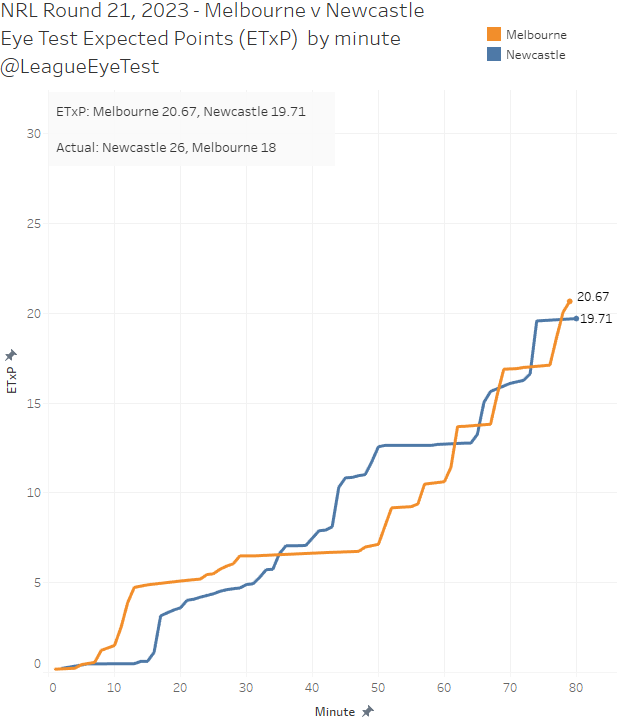
It was a similar situation in the Melbourne game as well, where the visitors should have picked up the win 20.67 to 19.71.
In both cases the Knights not only held on defensively but scored enough points to give their players sufficient leads to preserve. Whilst I wouldn’t be looking to extend him right now (a very Dragons move) O’Brien should be given credit for the recent performances of his side. Whether or not he’s in charge next season is another thing.
With that in mind we’ll be taking a very Knights focused look at the NRL’s efficiency landscape this month, where we’ll compare on field performance with expected results.
First up as we’ve done previously, we’ll look at the actuals to get a sense of where teams are sitting form their real output. An easy way to read this chart is that the further to the bottom right you are the better, and the further to the top left you are the worse you’re performing.
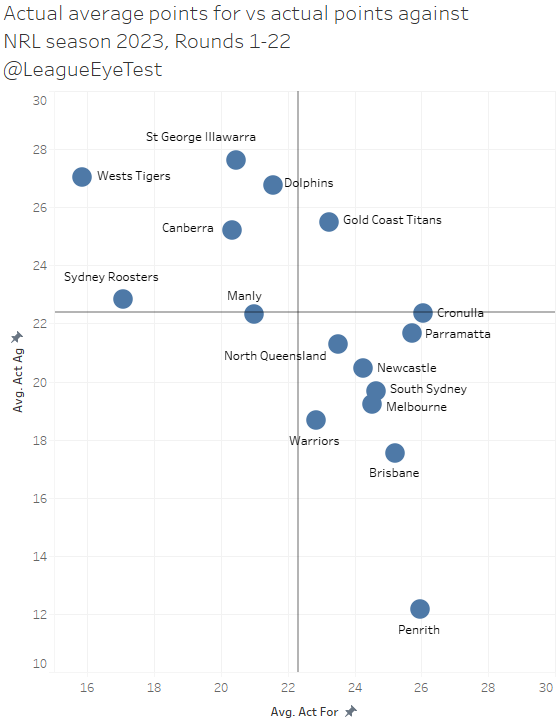
In a shocking turn of events, the Panthers continue to edge away from the rest of the competition here and no one is within nearly a converted try conceded. The second best defense in the competition – Brisbane – is 5.3 points per game more porous than the Panthers.
The team the Knights beat this weekend, Canberra, has more in common with the cellar dwellers of the NRL this season than those in the top eight. Manly look like the top 8 gatekeepers this season, if you’re doing better than them, you’re likely gunning for a finals spot, and if not then you’re thinking about next season already.
Let’s move on to the theoretical output now, by charting the expected points scored and yielded. This is done using the sites Eye Test Expected Points metric (ETxP), which you can read about on the site if you’d like some more information. The short version is that it assigns a point value to each play the ball based on the probability of scoring a try from that location and tackle number.
It’s a good way of assigning a point value to possession and field position, and then comparing the actual output to the theoretical one. Here’s the expected for/against chart after 22 rounds. Again, bottom right good, top left bad.
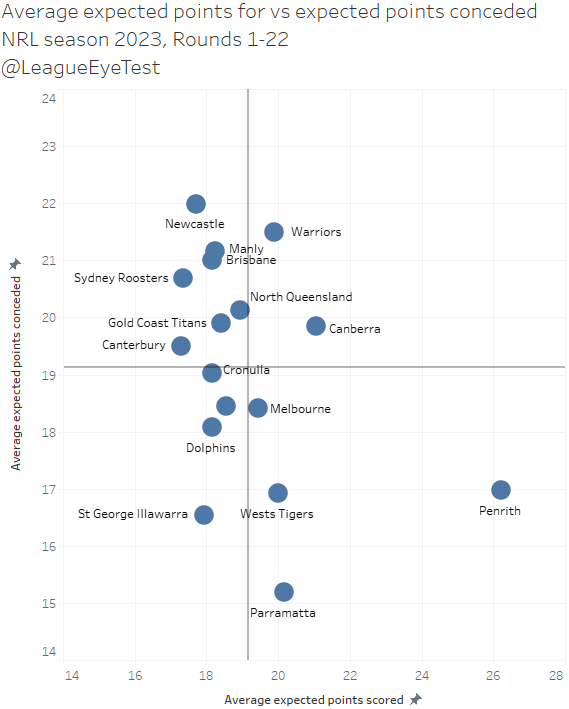
Those with a keen eye will notice Newcastle at the top left here. I’m not going to expand on their situation here and would rather let my readers marinate on it for a bit. But you’ve picked up on an important point here, the Knights give up the highest average expected points per game in the NRL this season.
To dig in a bit deeper and see which teams are more efficient with the ball, now let’s chart expected points versus actual points scored. For this chart (and the next one showing conceded actual and expected points), I split the chart into four quadrants. Efficient/lucky, dominant, inefficient/unlucky and incompetent to help read the chart.
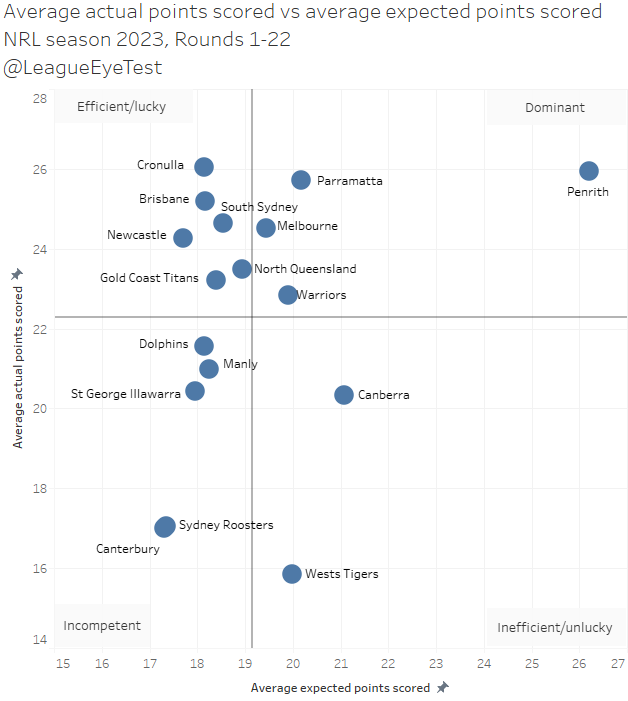
Again, we’ve got Penrith lapping the field. They’ve extended their lead over the field, and you’d be quite the contrarian to pick anyone else than them to win the grand final this year. Melbourne, Parramatta and the Warriors are the only other teams to occupy the ‘dominant’ quadrant here.
The efficient/lucky quadrant, which has teams scoring above league average on field but below league average in expected points, is where the Knights sit for now, along with a few other teams firmly entrenched in the top eight, and the Titans.
The inefficient/unlucky quadrant is now occupied by just two teams – the Wests Tigers and the Canberra Raiders. There’s those Raiders associating with the bottom quarter of the competition again. The negative for/against differential should have been enough of a red flag, but their continued inability to turn field position into points has crippled their season. Even if they limp into the finals, it would be difficult to see them making it out of the first week.
And in the incompetent quarter, the Roosters and Bulldogs expected points from field position and actual points scored are almost identical, which is probably a good explainer for why the tricolours are having a very ordinary season.
Now we’ll check the defensive side, with the same chart as above but flipped for actual and expected points conceded. We’re using the same quadrant descriptors, but the chart is flipped – lower is good, higher is bad.
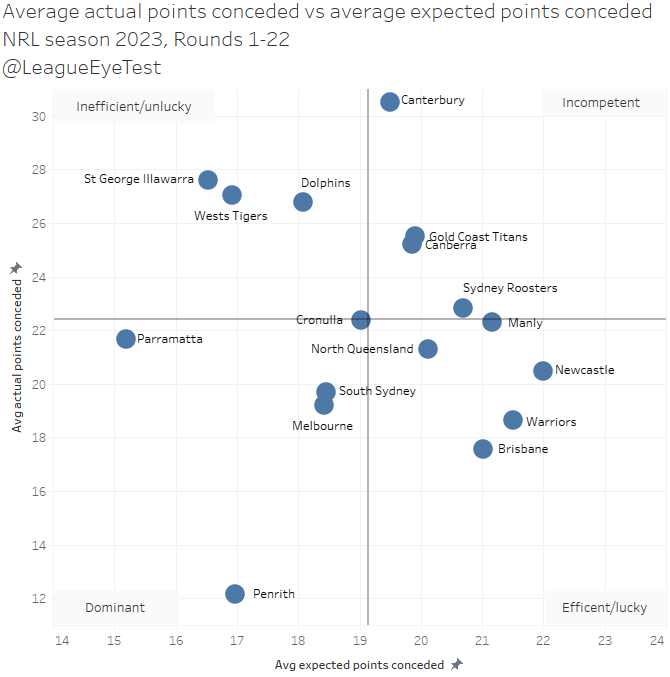
And boy the Bulldogs are bad. They’re only just over league average in expected points conceded at 19.5 per game but give up more than 50% than that in allowing over 30 points per game. Joining them in the incompetent quadrant are the Roosters, Titans and Raiders. Again, we can see they’re almost identical to the Titans, which probably explains why both continue to surrender sizable leads in the second half.
The less said about the ‘inefficient/unlucky’ defensive sides the better. All three of them allow points from low value field position, which is a recipe for disaster in rugby league. The Dolphins at least have the excuse of being a first year team.
Again the ‘dominant’ quadrant is, well, dominated by Penrith, with Melbourne, Souths and Parramatta existing on the fringes.
The Eels issues this season can be encapsulated here. They yield the lowest expected point average in the NRL (just 15.2 per game conceded) but are right around league average in actual points conceded (21.7). Their problem has never been about point scoring but maintaining a possession advantage, which I wrote in length about earlier in the season. In short, they don’t generate enough metres more than their foes and if they don’t have more ball, they struggle to keep up.
The Sharks sit almost dead centre here, indicating a very average defensive side. Which is exactly the type of performances we’ve seen from them in the last month, after noting it on the site recently. Good enough to beat the bottom half, not good enough to stay with the top half. There’s a chance they don’t even make the top eight now.
And then we get to the ‘efficient/lucky’ defense quadrant, where the Broncos and Warriors have resided for most of the season. This month they’re joined by two streaking teams – the Cowboys and the Knights.
The Cowboys are closer to the Sharks on this chart, allowing slightly above average expected points but conceding slightly less. They had looked like possible competition outsiders but their inability to put away the Titans on Sunday dampened their hopes.
And then there’s the Knights. As noted earlier, they’re the worst at conceding field position this season. On average they give up 22.0 expected points per game, the highest in the NRL. But as of Round 22, they have the sixth best defense, only conceding 20.47 points.
If we limit this char from Rounds 18 to 22, the Knights defensively have looked more like Penrith than any other team, firmly sitting in the dominant quadrant based on their last four outings.
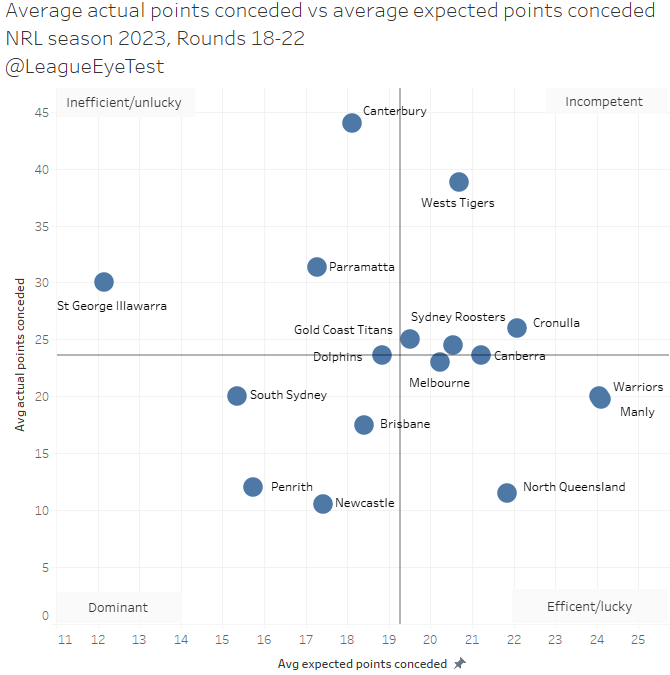
Yes, they’ve had the benefit of playing the Dogs & Tigers in that time, but their wins over Melbourne and Canberra came with a total of just 24 points allowed in 160 minutes. That’s the sort of defense against top eight sides that Cronulla could only dream of.
If we look at the percentage difference between actual and expect points scored, not a lot has changed on this chart since last month, with one exception.
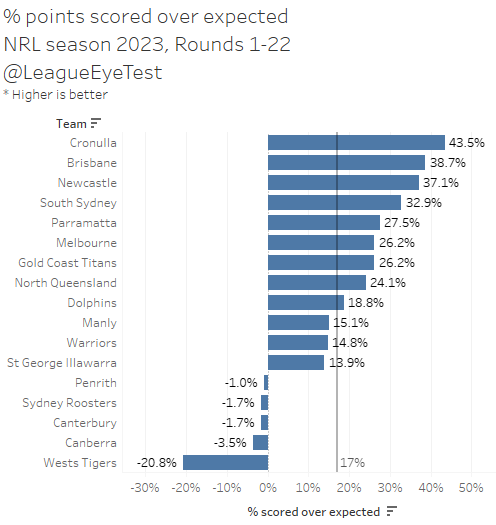
Cronulla still leads here at 43% above expected, but they had very little high point value possession in their loss to Penrith which has seen their efficiency drop from 56%.
The Knights were fifth a month ago at 31.6%, and they’ve improved to 37.1% which places them third in the NRL. That’s even above South Sydney, who usually dominate this metric. If you recall earlier, we saw the Knights had the third lowest expected point average with the ball in the NRL at 17.7 but are solidly mid table in actual points scored (24.3). More than the majority of the league they’re able to generate points from low value possession.
And their defense is in a similar situation. Remember earlier that I noted how the Knights give up the most expected points in the league at 22.0 per game? Meaning they allow teams more high point value possession than any other? Here’s every team’s percentage of actual points conceded against expected points yielded.
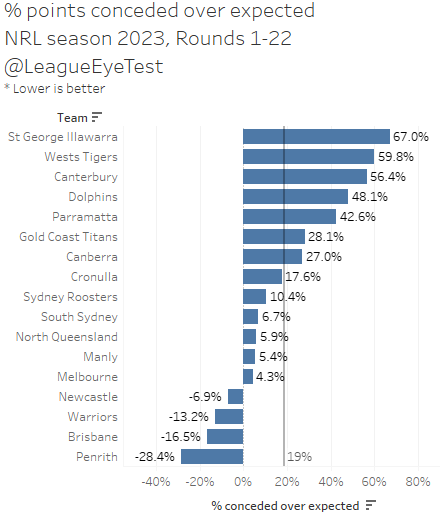
There is Newcastle, who give up the highest value field position in the NRL, allowing 7% fewer points than expected. They’re only one of four teams with a negative value here (although you could class below the league average of 19% as ‘negative’), and the other three could end up taking the top three spots on the ladder.
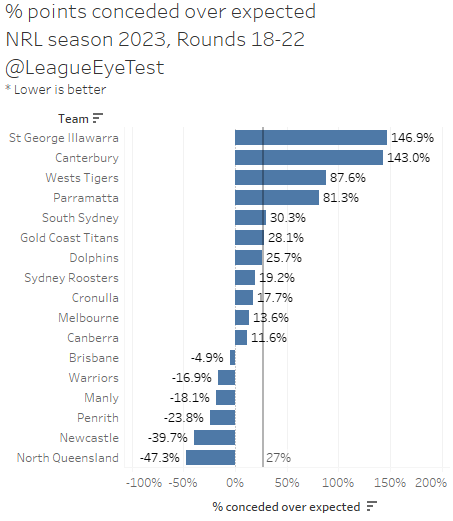
It looks even better for the Knights if you just consider the last five rounds, where they’re conceding nearly 40% fewer points than expected in their four games. Only the streaking Cowboys at -47% are better, and that includes Penrith who just held Cronulla to zero.
This ability to score from low value field position and withstand substantial goal line defense is very unlike the Knights of recent seasons. It’s also enabled them to win two games that they were behind on by expected points. Below is the number of wins over expected by each team this season.
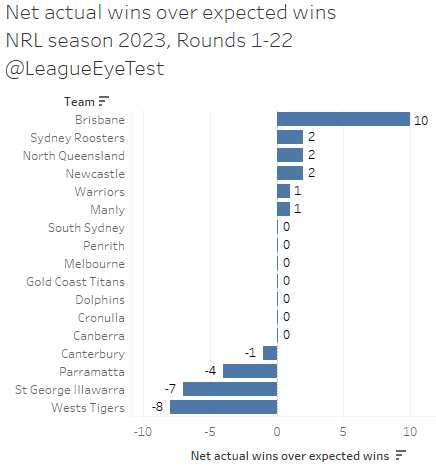
As mentioned, Newcastle is +2 in wins over expected. They’ve won five games where they were behind on expected points – Rounds 2 (Tigers), 4 (Raiders), 6 (Warriors), 21 (Melbourne) and 22 (Raiders again). The three they’ve lost were in Rounds 1 (Warriors), 4 (Manly) and 15 (Brisbane).
Of course, the big story here is Brisbane, who are +10 wins over expected this season. I’ve been banging on about it for most of this season, but their ability to defend their own line under constant pressure is remarkable for team with so many young players. It happened again on Friday when they suppressed the Roosters.
And it’s that type of red zone defense that makes the Knights ability to withstand pressure impressive. This season they’re averaging -7.21 net play the balls inside 20 metres, the worst in the competition.
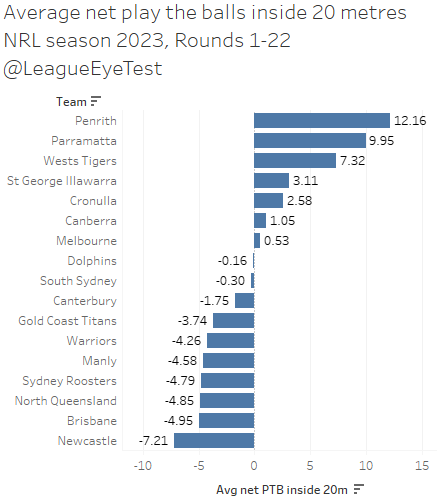
Basically, Newcastle gives up 7 more tackles inside 20 than they see themselves. It’s even more than Brisbane, who we identified earlier in the season as having an elite defense given the low number of points, they allow close to their line. If their defense is elite, then the Knights of the last month deserve that moniker as well.
If you compare their opponent play the ball heat maps, they have very similar profiles.
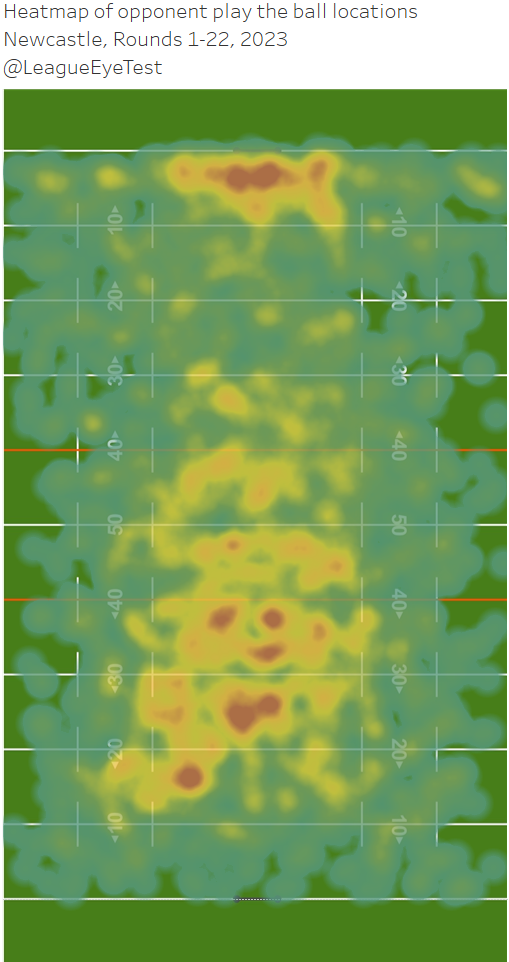
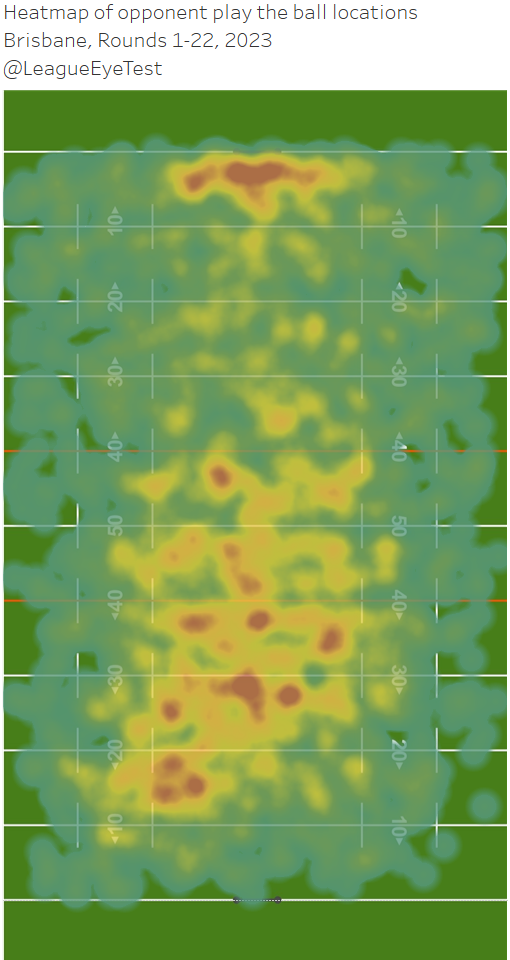
Both have a very high intensity area around the sticks, with the Knights having slightly more play the balls near the try line around the extreme edges of the field. There are two subtle differences between them though.
One difference is that Newcastle doesn’t see a lot of play the balls between 10 and 30 metres from their own line, which Brisbane do, seen by the yellow patches on the heatmap.
The other difference is that the Broncos opponent heatmap inside their own half is slightly wider, which would indicate their adversaries are trying to pick gaps on the edges of Brisbane’s defensive line. For Newcastle opponents, the intensity isn’t as high on the edges as they work the ball out against the Knights. That’s also shown with data – teams facing the Knights have the fourth narrowest distance from the middle of the field for play the balls of all seventeen teams.
This would denote that teams facing them favour themselves through the middle of the field when trying to generate yardage. And as noted above, it’s not until they get closer to the line that they start to work over the extreme edges of the Knights defense.
Another thing that O’Brien should get credit for is something that (possibly incoming Knights coach) Justin Holbrook couldn’t do at the Titans – get the best out of Greg Marzhew.
I’d noted in 2021 that Holbrook should have been playing Marzhew more, even with his substantial defensive issues, as other than Brian To’o there wasn’t a runner who was as damaging in the NRL. I’d also noted on X/Twitter earlier this season that Marzhew was having one of the best seasons under my ETPCR metric, after being one of the worst performing players last year.
And he’s continued that form. Below is a plot of average tackle busts versus average runs and the results are obvious.
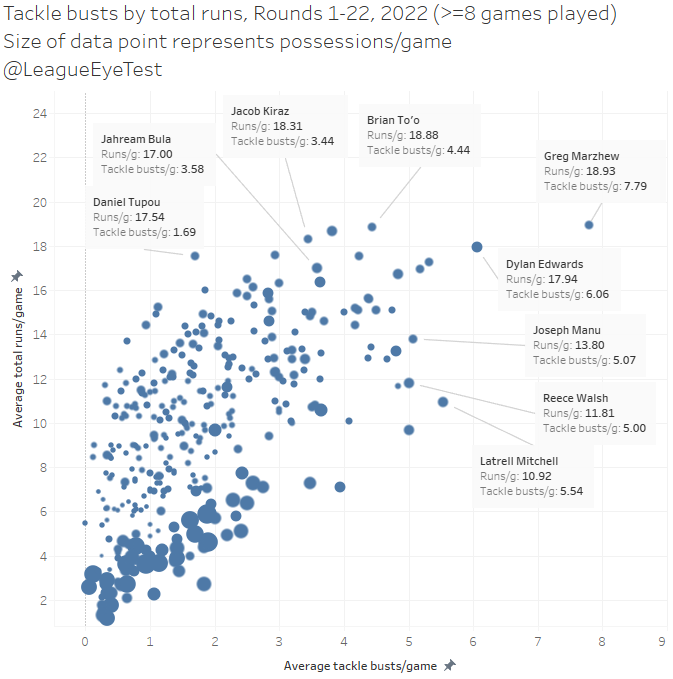
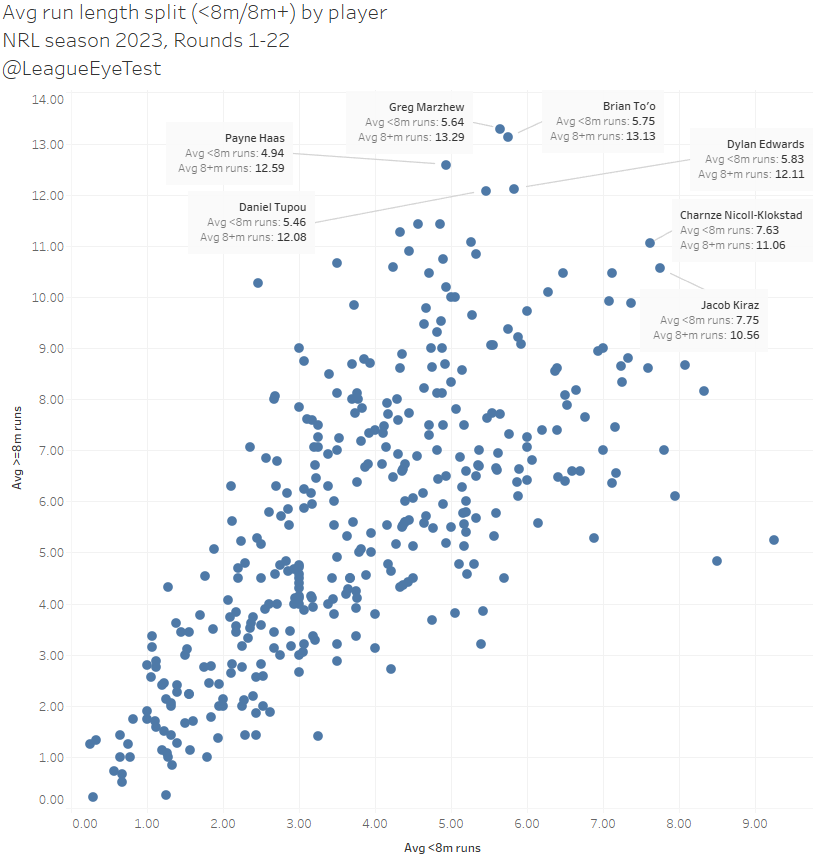
First in the NRL for tackle busts per game (7.8, according to Fox Sports Stats). Not only that, but Marzhew averages the most eight metre plus runs in the NRL this season at 13.29, just ahead of To’o at 13.13.
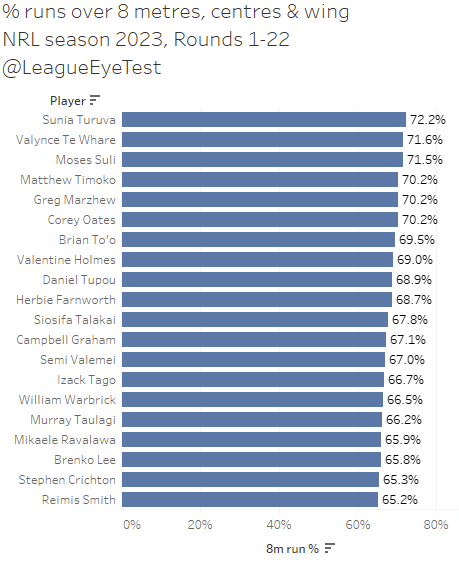
That equates to about 70% of his runs being 8 metres or more, one of the best numbers for outside backs in the league.
The players that Marzhew ranks behind don’t run the ball as often as him, and of those above him only Matthew Timoko has had the ability to turn a game on it’s head like the Knights winger does.
The fact that Holbrook and Marzhew could be paired up again next season will be something to watch. Clearly O’Brien has worked out how use him to the best of his abilities, something you couldn’t say about Holbrook for the past two seasons.
As little as four rounds ago Newcastle was in 14th place on the ladder and now, they’re sitting in 9th, although they were still only three points out of the eight given the closeness of the competition. They’re only one competition point out of the top eight and possess a better for and against difference than the Raiders (obviously), Cowboys and Sharks.
The downside is that they’ve had all of their byes and will be in charge of their own fate with their on field performances.
Newcastle’s run home is a dream as well. This weekend they’re facing the Dolphins (Perth), then there’s another match up with the Dogs (home), South Sydney (home), Cronulla (home) before finishing up with the Dragons (away). There’s a strong possibility they could finish the season 4-1 and a win over the Sharks could be the one that sees them leapfrog Cronulla into a top eight position.
And with their recent ability to defend, anything could happen if they can make it to September. That might not be enough to earn O’Brien a contract renewal, but it should definitely earn him some respect.