
The Canberra Raiders entered Round 23 with a point differential of -78, the 6th worst in the NRL.
Their opponents were the last placed Wests Tigers, who’ve conceded more than 500 points this season and given up scores of 74, 36, 34, 18 and 32 since the first of July.
It represented the best chance for the Raiders to right this number and regain some control over their finals hopes, which friend of the site Dan from the Sportress noted in his excellent match review. But he also noted that both teams are incapable of playing eighty minutes of decent footy, which is why this game was a concern for lovers of green milk.
In the end Canberra exited Round 23 with a point differential of -74, still 11th in the competition.
On expected points, they should have lost the game, indicating that the Tigers had better field position and possession than Canberra. A consistent narrative for the Raiders in 2023.
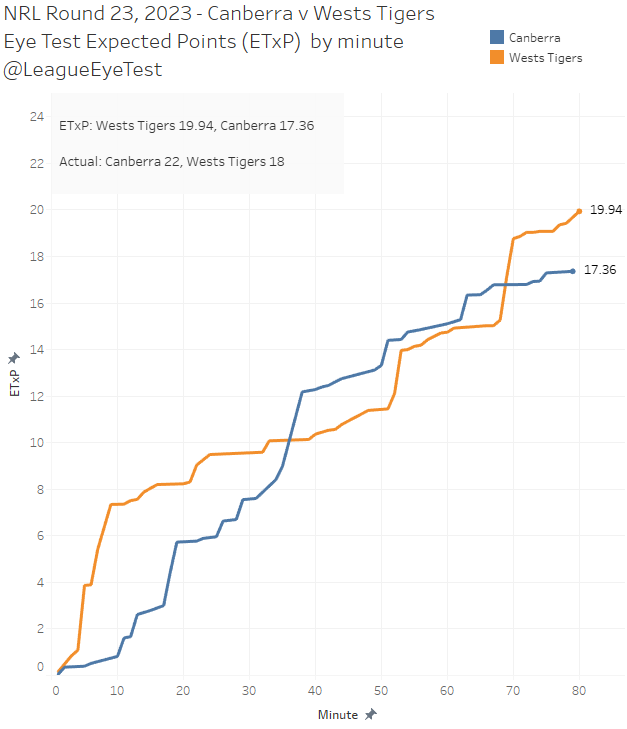
Canberra were just lucky that the Tigers are the only team in the NRL less efficient with the ball. They now have played the Tigers twice this season and won both games by a combined margin of 5 points, which is a great example of how the Raiders tend to play down to the quality of their opposition.
Which is in contrast to the Knights, where we highlighted last week that they’ve played Penrith twice this season but lost by a combined margin of just nine points. The Panthers scored eighteen points alone in the last nine minutes of their 53-12 win over Canberra in March.
Yet despite their abysmal point difference, a win over Melbourne on Sunday (as unlikely as that may be) would land Canberra inside the top four with three rounds remaining.
Some of this has been well chronicled – they’ve had one double digit win all season, a 36-26 victory over the Dragons in Round 19. They’ve had four games decided by one point, another four by four points and one more decided by two points. Doing things easy isn’t the Canberra way.
There’s always the chance of a close game when the Raiders are involved. Which is why their fanbase is one of the most tortured in rugby league, the three words that strike the most fear into Raiders fans might be “second half lead”. We’ve examined this phenomenon before, and it came up again earlier this season when we looked at the Titans.
So how does a team win 12 of 20 games but have an average margin of -3.7 points end up in fifth spot?
Before we get into the usual analysis, let’s first take a look at the for and against of every NRL era season (1998-2023) to get an idea of how common it is for a team in the finals, let alone possibly top four, to have a negative for and against record. Regular readers might remember this chart from a few seasons ago.
There have been sixteen teams with a negative for/against record to play finals football since 1998.
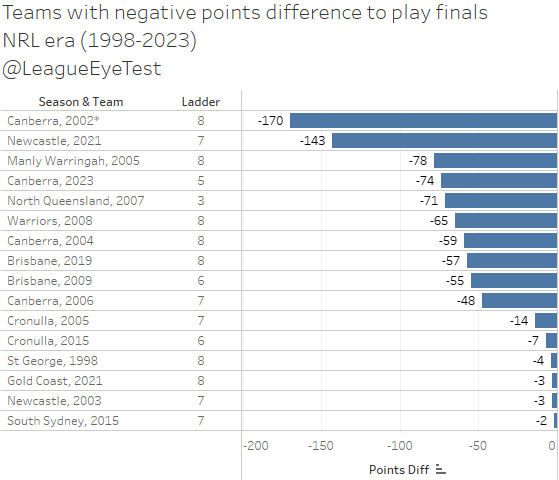
The 2002 Canberra Raiders were the worst at -170, although they don’t really count because they limped into the finals at the expense of the 20-win Canterbury side that was busted for salary cap breaches.
The next worst is the 2021 Newcastle Knights, at -143, which is purely down to how cooked the 2021 season was with set restarts and one-sided games. Next are the Manly Warringah Sea Eagles of 2005 who conceded 78 points more than they scored at the end of the regular season. Then there’s the 2023 Canberra Raiders, who sit at -74, just ahead of the 2007 North Queensland Cowboys at -71.
Most of the sides making the top eight with a negative difference came in 8th, a few in 7th and the odd one in six.The aforementioned Cowboys somehow made it to third place, with a point differential worse than that year’s wooden spooners, Penrith at -68. Plus the 2023 Raiders, currently 5th although they may not finish there.
Additionally, there have been just four teams prior to 2023 to play NRL era finals football with a below average attack AND defence. Average attack & defense is calculated for the total NRL era (1998-2023) and sits at 21.49 points for or against per game.
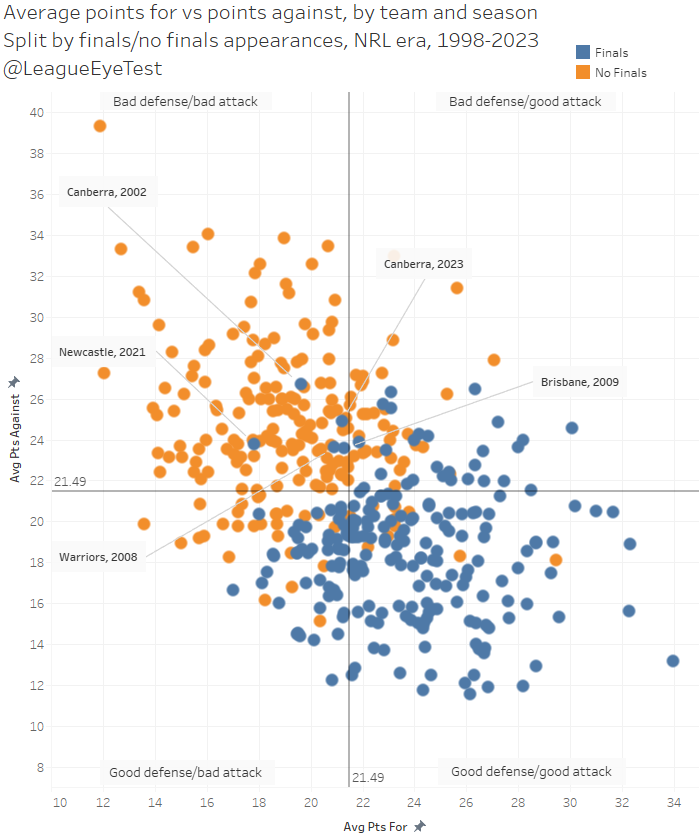
Those are the 2002 Canberra Raiders*, 2008 Warriors, 2009 Brisbane Broncos, 2021 Newcastle Knights. And now the Canberra Raiders are likely to join them.
Now we’ve got a bit of perspective on how uncommon this is, let’s see if we can unearth why it might be happening. As usual, all data is from Fox Sport Stats.
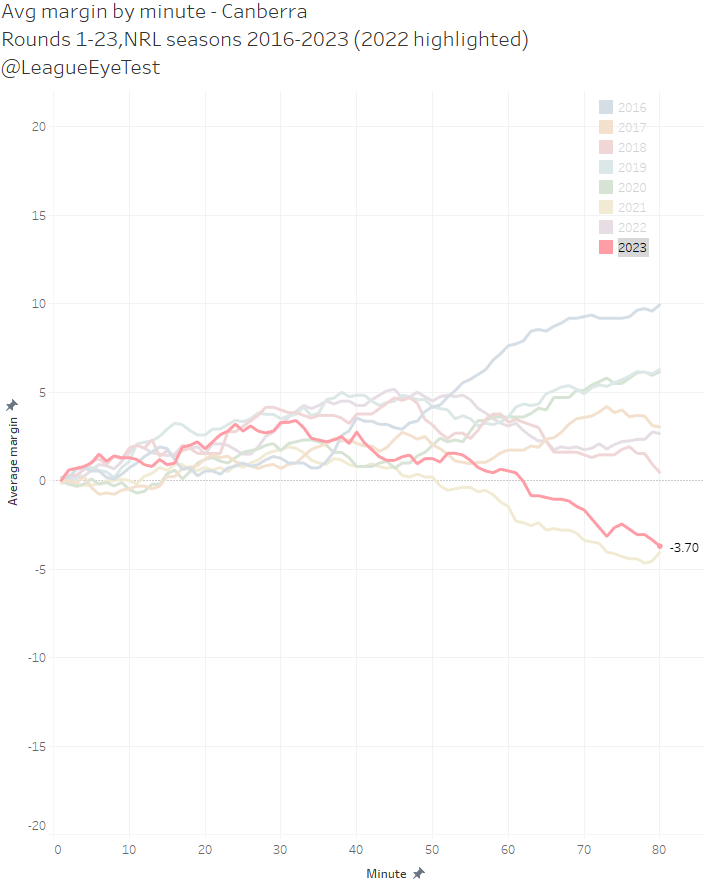
Overall, the numbers are pretty dire for Raiders fans, especially the way their 2023 margin tails off in the second half. They peak around the 30th minute mark at an average of +3.2 ahead, and end up on average 3.7 points behind after 80 minutes.
It looks even worse if you split it out into top eight and bottom 8/9 teams.
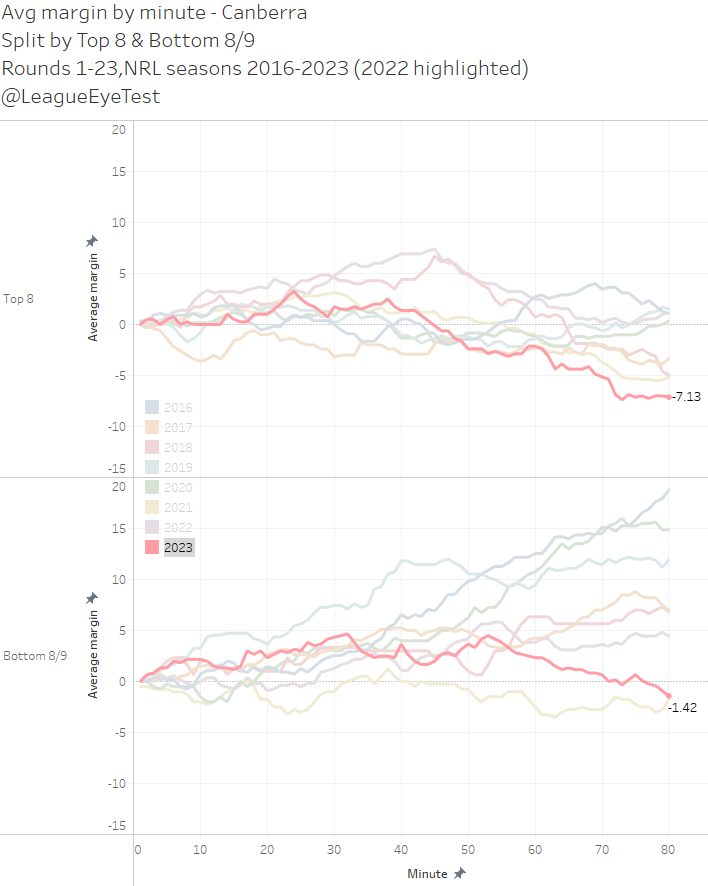
Against teams in the bottom 9 on the ladder at kick off, they’re clearly dominant early in games, as they have a positive average margin in for almost the full game. But that domination drops from a peak of +4.6 points to -1.42 after eighty minutes, a very clear sign of letting your foot off the gas.
When playing teams in the top half it’s another story. The average margin swings +/-1 for the first half, showing the Raiders can compete with the competition’s elite teams for 40 minutes. After the long break the wheels fall off, and they end up behind by an average of 7.13points per game after 80 minutes. That number is by far the worst for Canberra since 2016. Some of that can be attributed to their 53-12 loss to Penrith, if you take that game out, they’re only behind by -2.3 points after regulation time. Same trend, just a lower gradient.
Even more interesting about their margins is how long they’ve been leading in games. Below is the percentage of minutes each team has been leading, trailing or even over the course of the 2023 NRL season.
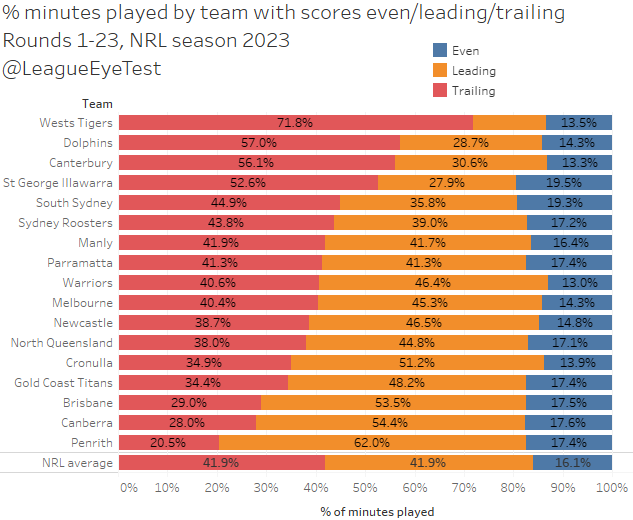
Canberra has the second lowest percentage of minutes trailing at 28%, only sitting behind Penrith. The fact they’ve done so further highlights the bizarreness of their negative point difference. Clearly, they can compete with the elite teams, even if it’s not for a full game. But it also highlights that when they clock off and let their guard down, those leads disappear very quickly. Again, issues around stringing together that 80 minutes of decent footy.
It’s an interesting dichotomy as last week we presented some efficiency numbers where the Raiders had a profile more like the Gold Coast Titans, or the bottom four clubs. As a refresher here’s the same charts again updated for Round 23.
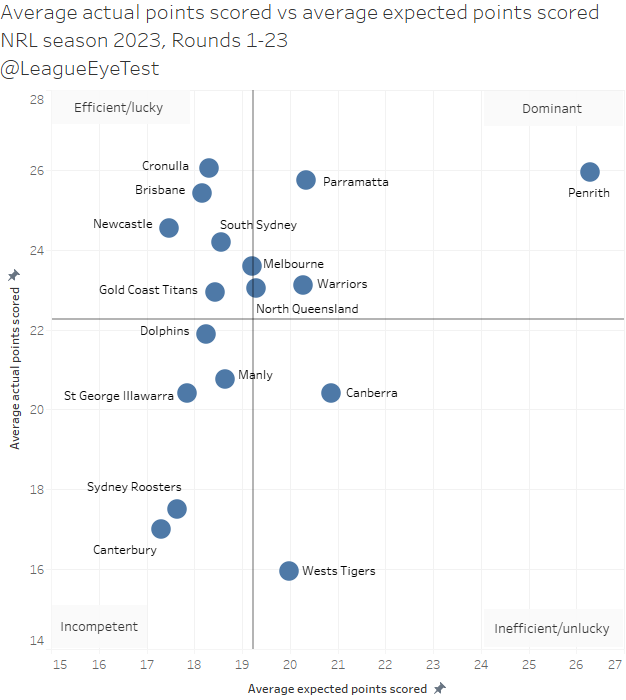
Here’s Canberra sitting in the “inefficient/unlucky” quadrant with the Tigers. Canberra has the second highest expected points average of all NRL teams, which means they can get themselves into good field position. But they’re equal forth lowest in actual points scored per game, which highlights their inefficiency. Nothing too surprising here for Raiders fans.
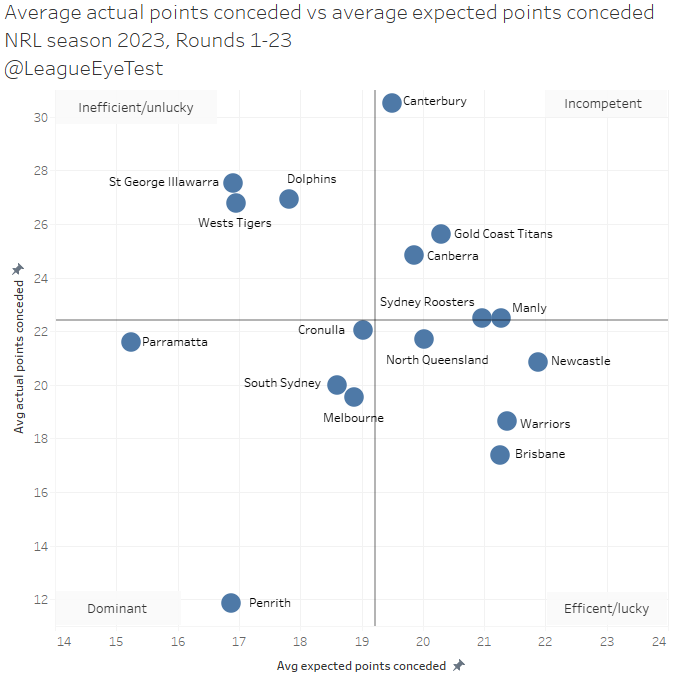
And defensively, they have more in common with the Titans than the top eight where they Canberra allow more than league average in actual and expected points.
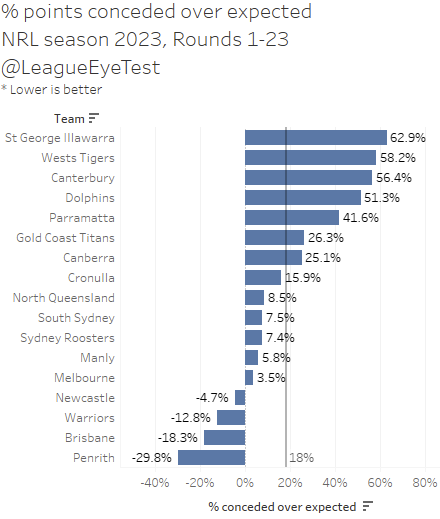
The chart of the Raiders actual points scored over expected points further demonstrates this, and why they were able to hold out the Tigers on Sunday.
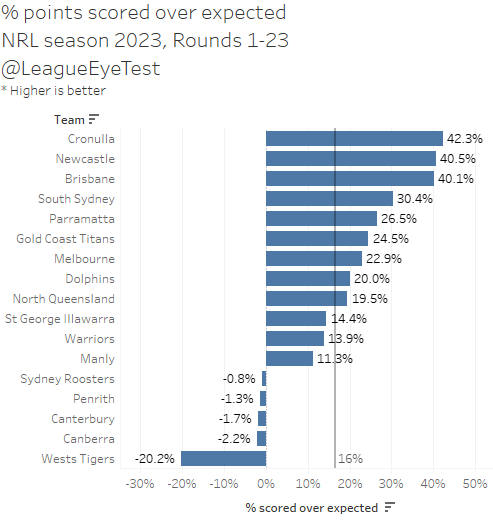
Canberra has the second worst percentage of points scored against expected, sitting at -2.2% after Round 23. That number means that they score 2.2% fewer points than an average team would with the same field position and possession. The Wests Tigers are the only team worse in the NRL than them, at -20.2%, which is why Canberra came away with the win despite Wests having better field position. Given the league average is +16%, both those sides are under indexing hard.
One of the reasons they might not be as efficient as they have been in previous seasons is that they’re seeing more play the balls in their own half. Below is the breakdown of zones where the ball is played – inside own half, inside opponents’ midfield (50-20m) and inside opponents 20m.
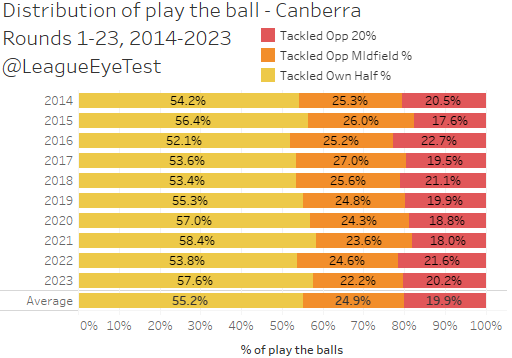
There’s not a massive shift here but it is noticeable. Canberra has almost 58% of their play the balls inside their own half this season, which is up from nearly 54% last season. That 4% difference is coming mostly from opponent midfield play the balls (-2.4%), and lesser from tackles inside 20m (-1.4%).
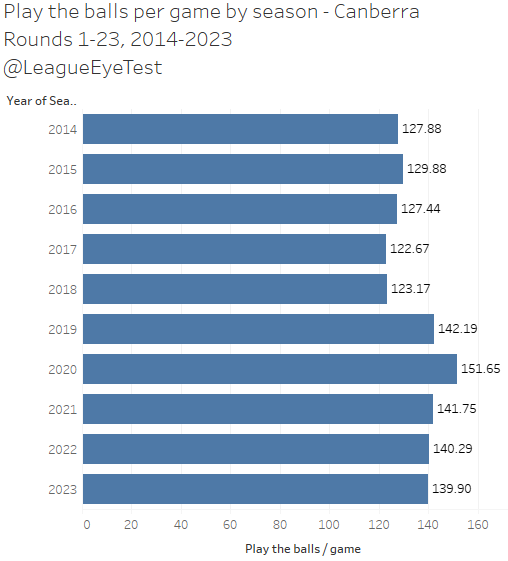
Are the Raiders seeing more or less ball this season? Their number of play the balls and completed sets are very similar to last season, but quite down from their peak in 2020.
Maybe they’re making shorter runs than previous seasons? Again, this doesn’t look like the case.
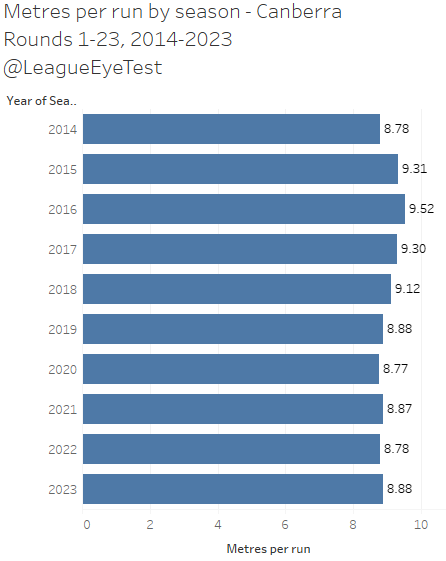
No, they’re making 10 centimetres more per run this year than in 2022, and that number is exactly the same as their successful 2019 season.
Are they allowing opponents more run metres through?
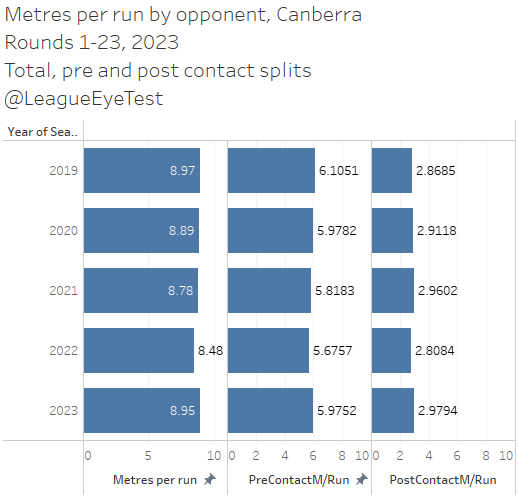
Here’s one of the problems, they’re allowing almost half a metre more per run than last season, and it’s their highest number since 2020 at 8.95 per run.
And of that extra half metre, about 30 centimetres is coming pre contact, with the remainder post contact, which means they’re not hitting the ball runner as early as they have been. That’s also the highest post contact metre average per run for Canberra since 2019.
The other thing that stands out this season is the Raiders second phase play. The Raiders were the second most prolific offloading team in the NRL in 2022, averaging 11.7 per game which placed them only behind the Eels at 13.7. Here’s their last ten season averages.
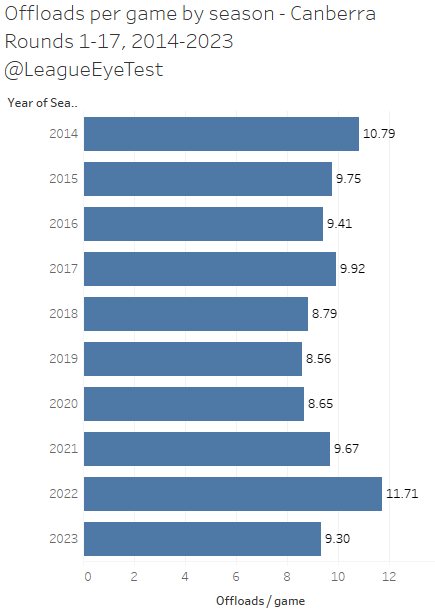
It’s pretty clear here they’ve also limited their ball playing, with a drop of 2.4 offloads per game compared to last year. Instead of being second in the NRL, they’re now firmly mid table overall.
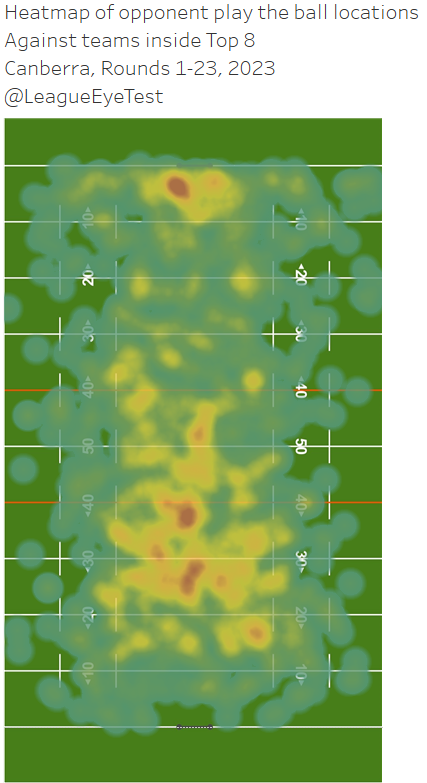
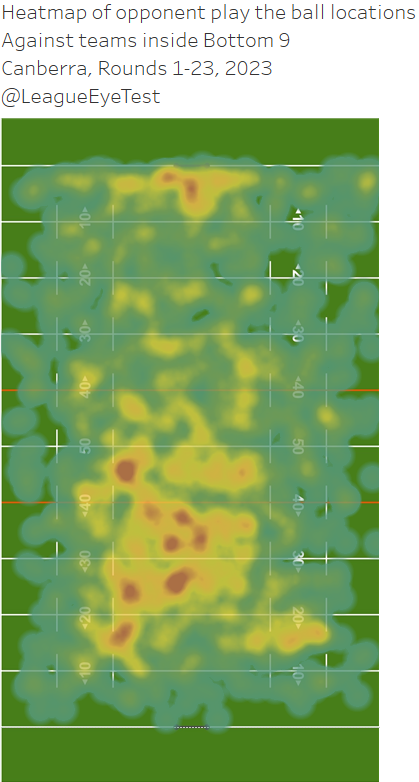
Some of the drop in offloads might be due to playing a tighter game against top eight sides. If you compare the two heat maps of Canberra play the balls below (left v Top 8, right v Bottom 9), you can see that against Top 8 sides their play the ball locations are slightly narrower, possibly indicating a simpler game plan through the middle.
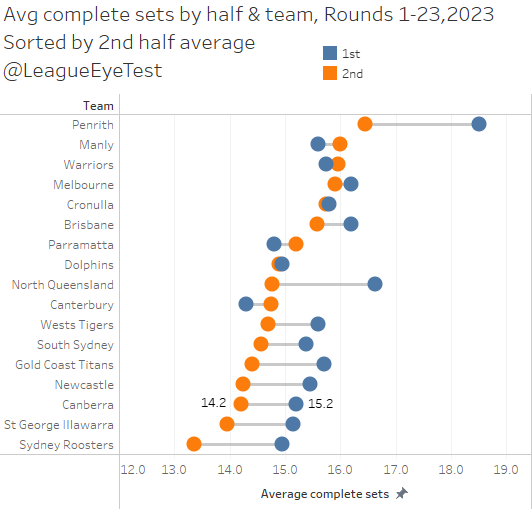
However, as we discovered last time, we looked at the Raiders second half issues, it mostly comes down to possession. Or lack of it. Below is the average number of completed sets by both halves (blue – 1st, orange 2nd). First up here’s Canberra’s averages.
And now here’s their opponents, showing a similar opposite trend.
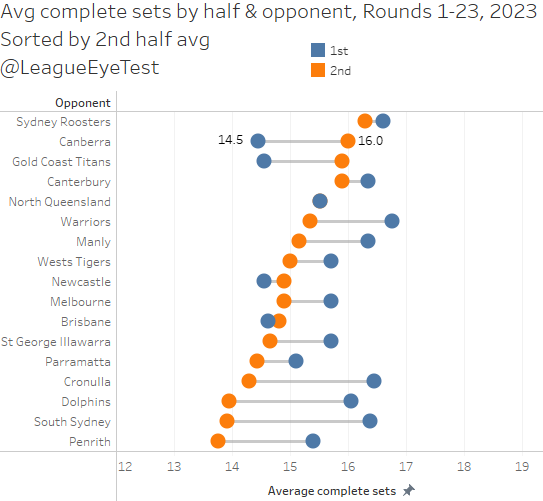
The numbers are quite glaring. Canberra has the third lowest number of complete sets in the second half in the NRL at 14.2 per game, and their first half number of 15.2 isn’t that impressive either. The disparity in the second half complete sets for Canberra opponents is more alarming though, averaging 16.0, second most in the NRL after just 14.5 in the first half, which is the lowest in the NRL. If you want to protect a lead, having less of the ball isn’t the way to go about it.
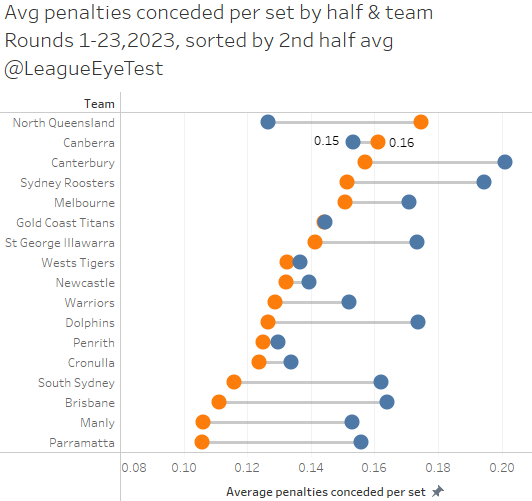
Part of that is due to discipline, with the Raiders having the second highest rate of conceding penalties in the second half at 0.16 penalties per set.
With a month remaining, Canberra controls their own fate. If they keep winning, that -74 margin means nothing and they could firmly entrench themselves in the top eight.
The good news is they have another chance to fix their point difference in Round 25 when they host Canterbury, who allow 56% more points than expected.
The bad news is that after Melbourne, their other remaining games are against Brisbane (2nd) and Cronulla (6th). All three allow fewer points than the league average for expected points, indicating it’s going to be hard to claw back that negative points margin.
Additionally, only two teams inside the top 8 have byes remaining, and one of them is in 8th (South Sydney). Ninth (North Queensland) and eleventh (Parramatta) also have byes remaining and could chase down the Raiders given they all have positive point differentials. Their gap of four competition points is just two when you take byes into account, meaning two bad results could easily see them slide from 5th to 9th.
Which means the formula is simple, they just need to win. It just looks like they’re doing the bare minimum all season to get those victories. I’m surprised being a Raiders fan isn’t listed as a pre-existing condition on most insurance forms given their propensity to throw away second half leads.
In the end, a win is a win, so maybe that’s not the worst approach? A grand final count the same if you win by a single point as one won by 40 points. But it certainly appears as though the Raiders are playing to the level of their competition more often than not, with their season looking like the epitome of FAFO.
And I think most Raiders fans are sick of finding out. I’ll leave the last word to Dan from the Sportress again, as it encapsulates this perfectly.
“Another win keeps them in a good position for the finals but if they can’t play better than this, what’s the point?”

huh, the average for and average against are exactly equal? what a game.