
Last week at the Eye Test we looked at whether ladder position had an affect on teams being whistled for more penalties (narrator: it did not). Coaches were claiming that teams at the lower end of the ladder were scrutinised more than those at the top, which appears to be largely unfounded based on last weeks post.
At the end of that article, I alluded to this weeks post looking at penalties being awarded to teams leading or trailing as a better view than using ladder position. And that’s exactly what we’ll be going over.
One of the reasons I suggested that using in game margin as a better way of analysing penalties was that not all penalties are created equal. Those given at the start of games could be more impactful than those at the end of a game, and penalties late in a close game are significantly more influential than those in a 20+ point blowout.
Let’s get into the details then. As mentioned last week, all of the penalty, scoring and minute data is from Fox Sports Stats for seasons 2014 to 2022 (as of the close of Round 7). We’ll be using a similar approach to last seasons analysis of set restarts by margin and time, where we grouped time into eight minute buckets over the course of a game. If you haven’t read that post, it might be a good starting point to get an understanding of how infringements are called over the course of a game.
To start things off, here’s the raw volume of penalties by minute over the course of the past eight and a bit seasons.
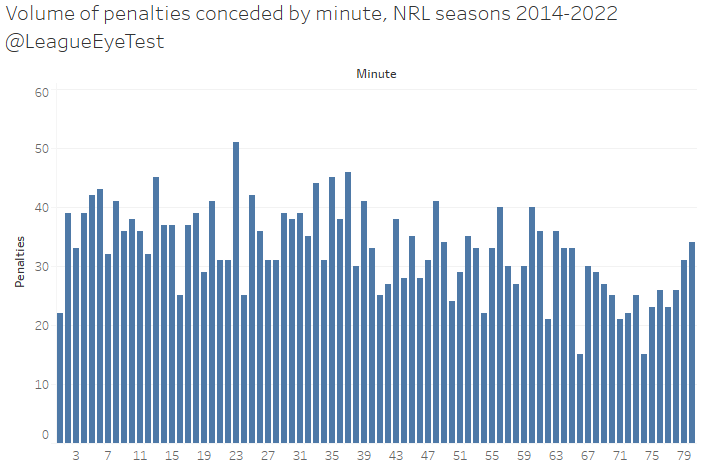
At first glance, the opening half has a pretty steady flow of penalties, that does pick up slightly towards the end of the half. This would be due either to players being fatigued or giving away cynical penalties as the clock ticks down to end the half without conceding a try. Then as you move into the second half, the number of penalties declines as referees are no longer setting the tone of the game and are letting players play.
These trends aren’t that different form the set restart deep dive from 2021, the main difference is a slower rate of decline in the second half for penalties than there was for set restarts.
Next, we’ll add on a layer for penalties given when the margin was even or conceded by the team that was leading/trailing. Blue is for even, red for trailing and orange for leading.
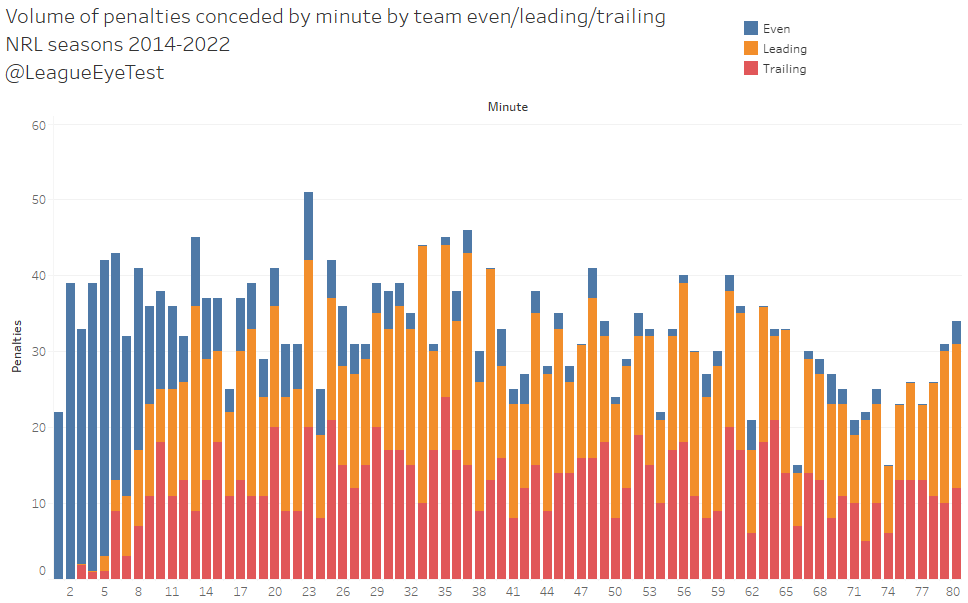
There’s not a great deal to easily take away from this visualisation as there’s too much going on, although it sort of looks like that teams leading are conceding more penalties than those trailing over the course of a game. To make this easier to interpret, lets break it down by the eight minute buckets I mentioned before.
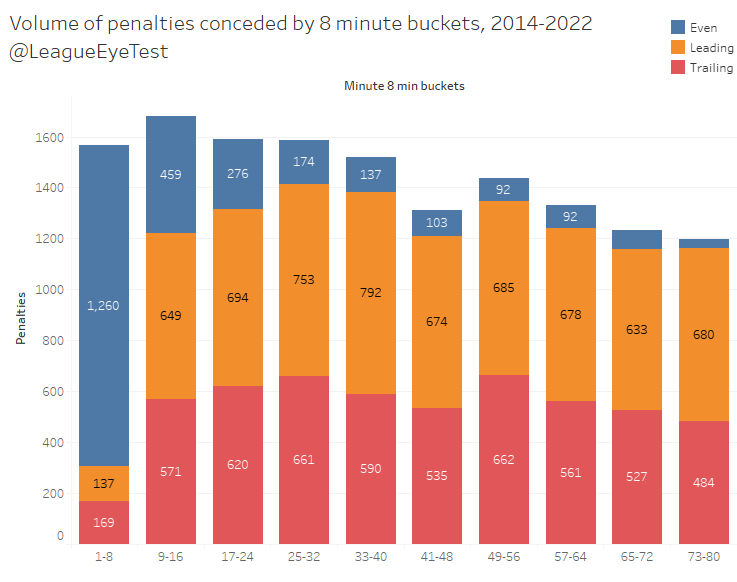
This looks a little bit cleaner, as you can see the trend for fewer penalties to be called as the game progresses. And with the totals on each section of the bar chart you can see the volume of penalties called for teams leading does appear to be higher. Let’s make it even easier to compare by checking the share of penalties per eight minute group rather than the volume.
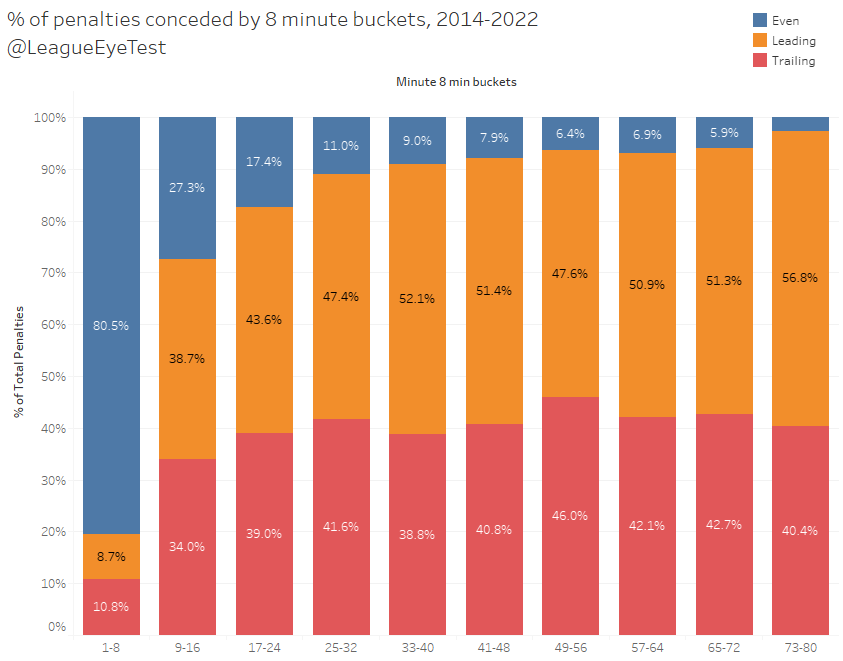
Now we’ve got something. In the first eight minutes, 11% of penalties are called on teams trailing and 9% on teams leading. It stays even through the next eight minutes before diverging from 17-24 minutes towards around 50% of penalties being called on teams leading, 38-45% for those trailing and between 6-11% in even games. There’s a noticable trend, but still the “even” games are making this analysis a little more difficult than it needs to be. So, let’s exclude those minutes.
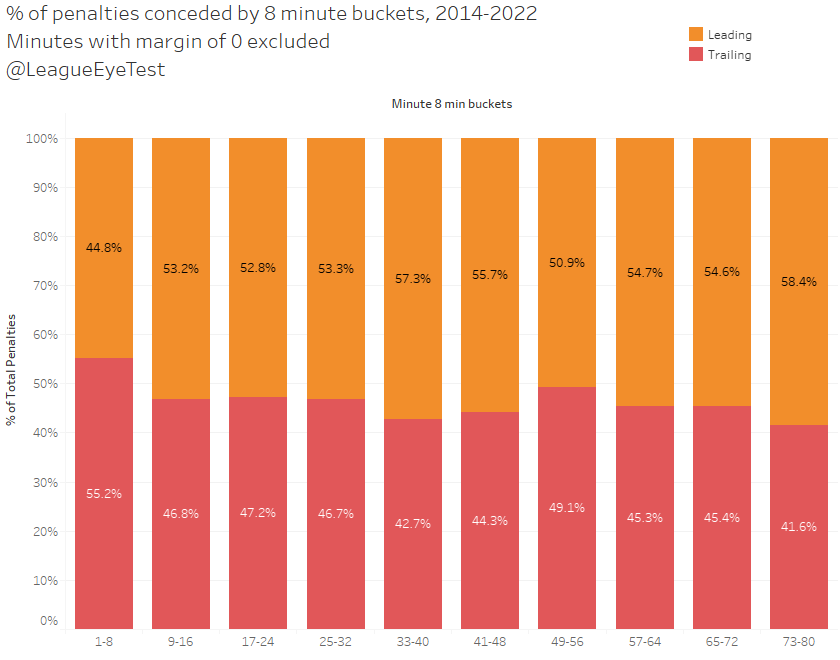
And there we have it. A very clear trend of teams leading being called for a higher share of penalties than those trailing, moving from 44% to those ahead in the first eight minutes, to over 50% for the remainder of the game, peaking in the final eight minutes of the first half at 57%. This peaks again in the final eight minutes of a game where the leading team gives away 58.4% of penalties in a game that isn’t tied.
The data is pretty obvious here – there’s no clear correlation at all between sides trailing and conceding more penalties, and if anything, the opposite is true. Just like last week, which does present a chicken or the egg situation. Are these teams ahead because they push the envelope more or do they keep their lead because of the penalties they’re conceding? My thoughts are the same as last week in that it’s probably a mix of both with a lean towards teams who push the envelope more leading.
With that in mind, are there any trends if we break these numbers down by teams? Here’s look at the previous chart by team from 2014-2022.
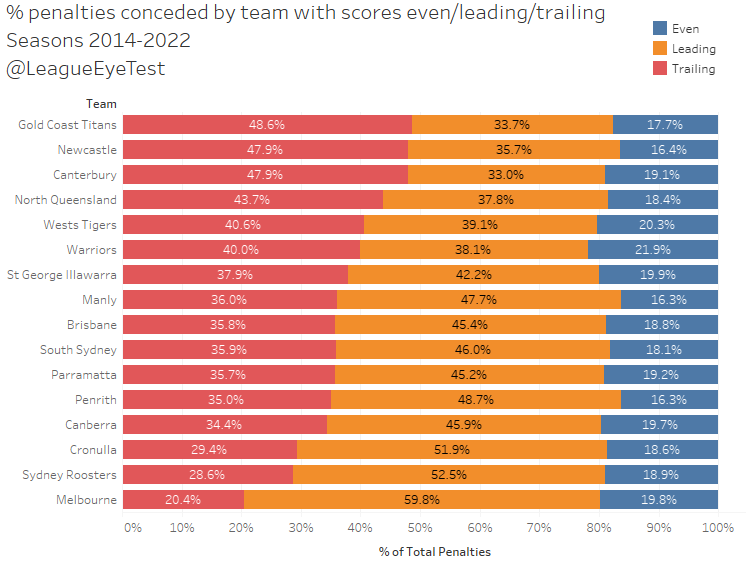
There’s a bit of a bias in that teams who’ve been successful during this period have played fewer minutes trailing, so are likely to concede fewer penalties when trailing. That said we’re looking at such a long period of time we’ve got a large enough sample size for each group to see significant results.
No surprises for seeing that Melbourne only concede 20% of their penalties whilst trailing and 60% when leading, as they’ve pioneered many tactics that have pushed the limit of rules and referees and have been incredibly successful during this time frame.
Only two other teams have conceded more than 50% of their penalties whilst leading, those being Cronulla and the Sydney Roosters, the latter of which were one of the worst culprits in deliberately conceding penalties on their own goal line.
At the other end of the chart, you have the usual suspects, all of whom only have had lean times during the past eight seasons. The bottom six here (Titans, Knights, Bulldogs, Cowboys, Tigers and Warriors) have all given away over 40% of their penalties whilst being behind on the scoreboard, and the Bulldogs have the lowest share of penalties concede when leading at just 33%.
Let’s flip that chart around now and look at penalties conceded by opponent.
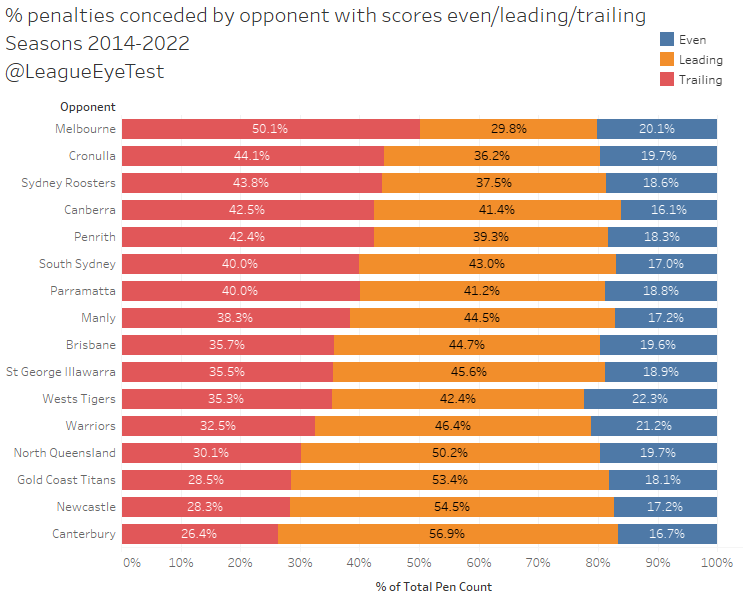
Just 30% of penalties are conceded by teams playing Melbourne when leading but over 50% of penalties are given away when the Storm are ahead their opponents. No other opponent received gave away more than fewer than 30% of penalties when leading, and no other opponent conceded more than 44% of their penalties whilst trailing. Just another slew of statistics that show how dominant the Storm have been, not that we really needed any more after Monday’s annihilation.
These charts have been for the past eight seasons, if we look at only 2022 do the numbers change at all?
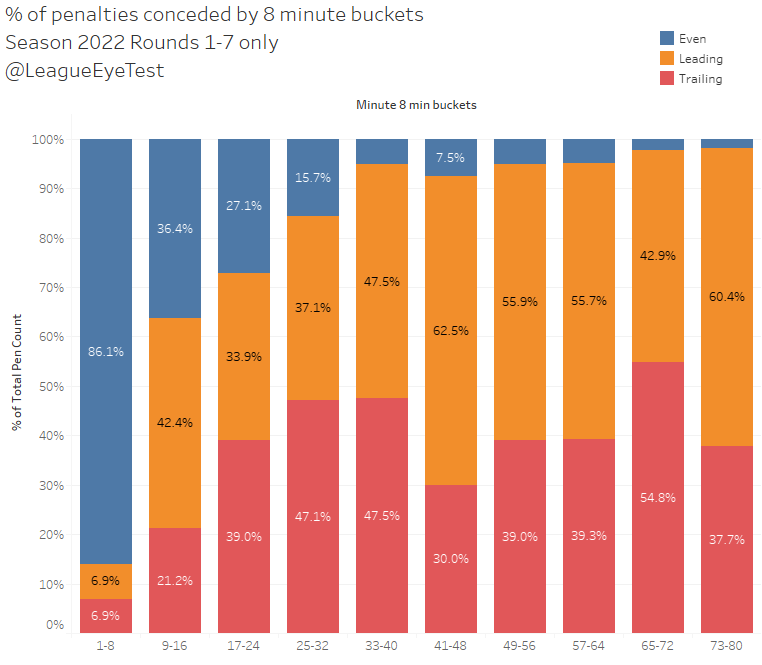
Keep in mind we have just seven rounds of games so far in 2022, but the numbers are in line with prior seasons, if not a little bit higher. Over 60% of penalties are called against leading teams in the 41-48 and 73-80 minute groups, far higher than the overall numbers. The other big difference is that teams trailing in the 65-72 minute group are conceding nearly 55% of penalties during that time, up from 43%. This might be the source of frustration among losing coaches but given the small sample sizes I’d expect this to revert to the mean as the season progresses.
By team it’s a pretty similar story thus far for 2022.
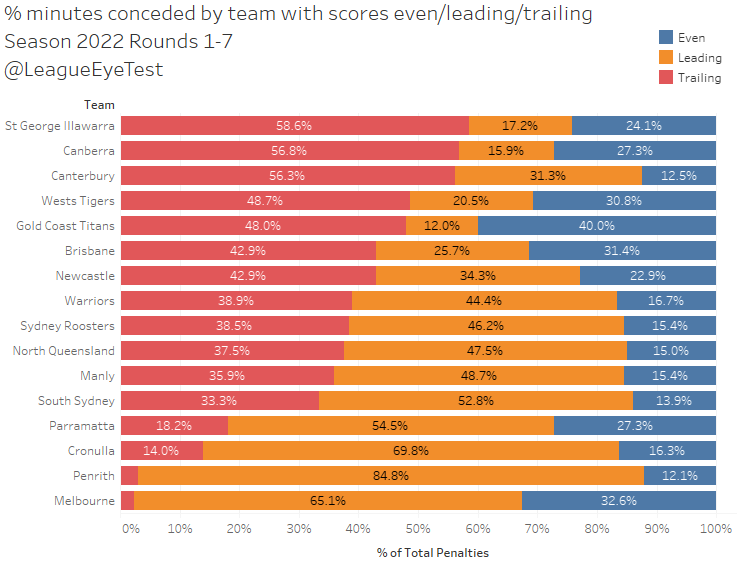
Besides just how dominant Melbourne and Penrith are there’s a few things that stand out to me. The first is Canberra conceding 70% of penalties whilst trailing, which isn’t a great example of their discipline issues amidst a very poor start to the season.
The next is that the Gold Coast Titans have only been called for 12% of their penalties whilst leading. They’ve played nearly 29% of their time with a lead, so they’re significantly under indexing here which is a positive – not giving away more penalties whilst leading is a good sign. However where they are over indexing is in tied games. The Titans have played around 14% of minutes with the scores even, yet they’ve conceded 40% of their penalties during those minutes, which shouldn’t be that surprising given their struggles.
The other thing that stood out was the Roosters conceding 55% of their penalties whilst trailing, and only 5% during tied games. They’ve historically been a team that concedes penalties on their own line as mentioned before, yet they are having serious issues defensively this season and what used to be a tactic that would pay off may not be as useful for them anymore.
We’ve now looked at the overall penalty trends by minute and margin, but are there any differences in penalties conceded in close games? Below is the breakdown of penalties conceded in the last 16 minutes of games where the margin has been broken down into four groups – less than one converted try, between one to two converted tries, between two to three converted tries and more than three converted tries.
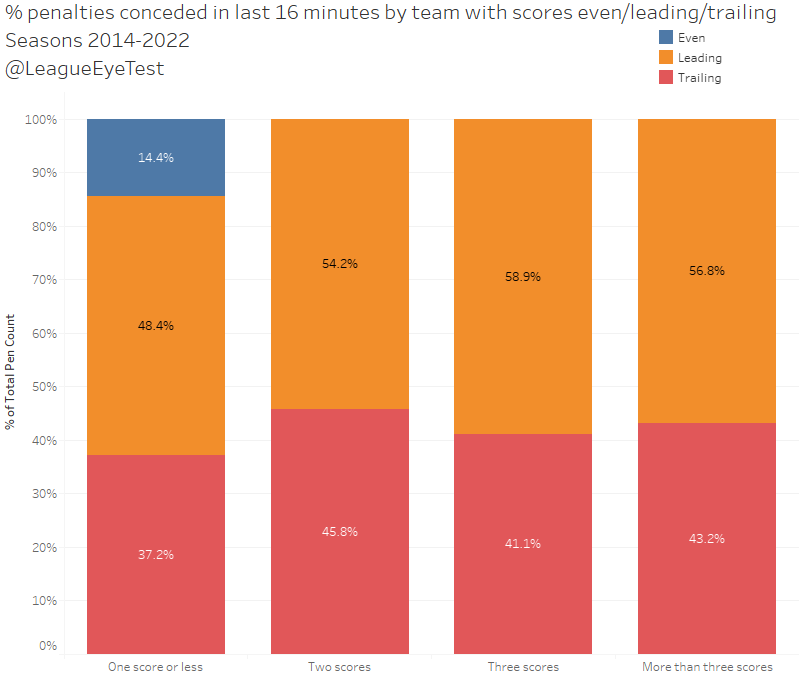
Even accounting for the 14% of penalties in even games, the team leading in each of these situations is far more likely to allow a penalty in a close game. Nearly 50% of all penalties conceded in a game with a margin of less than one converted try are given away by the leading team, and at least 54% in every other situation.
Lastly let’s change the view and look at referees, this time from Round 3 2020 onward as prior to this we were operating under the (vastly superior) two referee system.
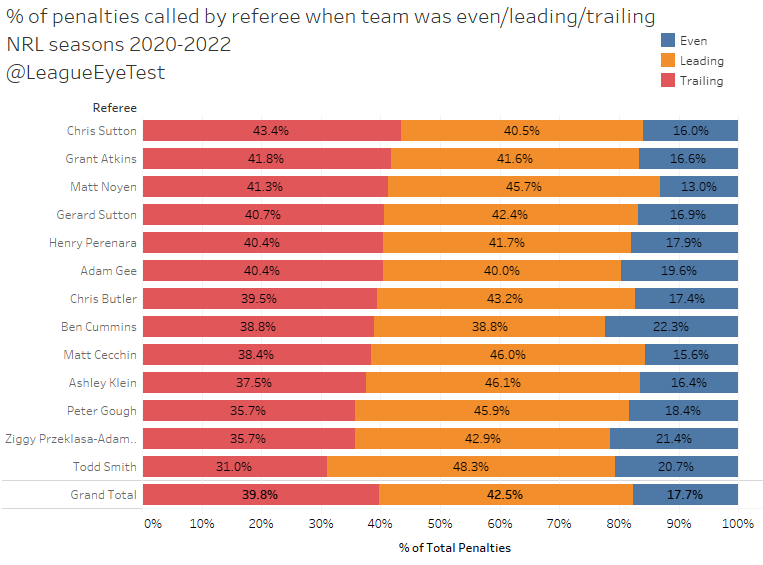
The numbers are pretty close overall, and there’s only a small gap of just under 3% between penalties called against teams leading or trailing. Individually, Todd Smith’s numbers are low due to the handful of games he’s officiated, which is a similar case for Ziggy Przelkasa-Adamski, meaning you can likely disregard their numbers for now. I’d like to point out, as I do with any referee’s analysis, that I’m a huge fan of the job the referees are doing given the circumstances they’re in with ever changing rules and interpretations. In no way am I suggesting that they are consciously or sub consciously favouring any team, just that these are the numbers, and this is what the trends are.
Ben Cummins has the interesting case of the same percentage of penalties being awarded to teams trailing or losing at 38.8%. He also has 22% of those given in games there were even at the time, which is a factor of him usually receiving more high profile games featuring teams with high ladder positions. Grant Atkins and Adam Gee also have similarly close shares of penalties given to teams losing or trailing.
Matt Cecchin and Ashley Klein have the largest gap between share of penalties called against teams leading over those trailing, while Chris Sutton is the only referee who calls a higher share of penalties against teams trailing than those leading (43.3% to teams behind compared with 40.5% called on those leading).
What conclusions can we draw from this analysis? It seems that just like last week, there’s no data to support that teams trailing are conceding more penalties than those leading. In fact, it’s exactly the opposite. Teams leading give away far more penalties than those behind on the scoreboard, which should be benefiting those teams who are making accusations that they’re being mistreated.
Teams leading are far more likely to concede penalties, especially as game time increases. That isn’t to say that there won’t be mistakes made or games decided by a timely penalty, but to suggest there’s a bias against teams trailing would fly against the data already presented in this post.
Keep that in mind the next time you hear a coach of a losing side talk about penalty counts in the post game press conference.
If you’re enjoying the content on this site please consider supporting The Rugby League Eye Test by donating through one of the links on the support page or at the end of this post. You choose the amount to donate based on the value that you feel this site provides.
Scan the QR code or copy the address below into your wallet to send some Bitcoin to support the site Scan the QR code or copy the address below into your wallet to send some Ethereum to support the site Scan the QR code or copy the address below into your wallet to send some Litecoin to support the site Scan the QR code or copy the address below into your wallet to send some Bitcoin cash to support the site Select a wallet to accept donation in ETH BNB BUSD etc.. Donate To Address
 Donate Via Wallets Bitcoin
 Ethereum
 Litecoin
 Bitcoin cash
Support The Rugby League Eye Test
Support The Rugby League Eye Test
Support The Rugby League Eye Test
Support The Rugby League Eye Test
Donate Via Wallets


Do you have analysis based on conceded points against betting odds? I hypothesise that the penalties are higher against the team who is the underdog.