Last season on the Eye Test I had a crack at projecting player value for the 2023 season, estimating player salaries based on prior statistical production as well as other factors like player age progression.
It wasn’t a failure, but there were clearly areas for improvement. I looked back at the projections in September and noted there were a lot of players I was very close with, like Cameron Munster (0.8% difference), Junior Paulo (0.3%) and Dylan Edwards (0.2%). But there also some that I had missed by a wide mark, like Reece Walsh and Shaun Johnson. In the end it did prove useful to an extent.
Knowing there were some areas to improve upon, I’ve had another attempt at projecting player value for the upcoming 2024 season. This time with a few tweaks that I hope will improve the output.
I’ll quickly recap the methodology here, which is available in longer detail in the initial post from last year. To get this estimated player salary, we firstly take a three year weighted average of their Eye Test Player Contribution Rating, a metric that weights statistics that correlate to winning games, compared to a replacement level player at their position. If a player has played fewer than 16 games in any of those three seasons, I add in a regression to the mean level of production to make up the difference.
We then factor this production based on age (younger players improve, older players decline) and position, and project that production out to the expected games and minutes played. Then we have our estimated level of production projected per player for 2024 to base a salary or value on.
The next step is to divide the total number of salary cap dollars available by the number of minutes played above replacement level across the NRL. The theory is that if a player isn’t producing above what a replacement level player is (someone outside the top 30), then they would only be valued at minimum salary level.
Then we can multiply each players production by the dollar value of a minute of above replacement level production, with negative value being no lower than league minimum salary. That gives us the estimated player salary or value for 2024.
As noted earlier, I ended up changing several things this year which I think will create a better set of outputs.
The first is that I scrapped the baseline of 22 games for everyone. My initial thought behind this is that it would provide an even playing ground and allow for better like for like comparisons. In the end it just overvalued someone like Tom Trbojevic, who even by estimating lower production for games missed was estimated to be one of the most valuable players. Which he probably is, but he’s played just 36 games in three seasons. It’s hard to be valuable when you’re not on the field, unless you’re a net negative player.
To combat this, this year I’ve used a weighted three year average of games and minutes played, with an additional two extra games added to their predicted games played to account for prior injuries. The weighting is similar to how I weighted their actual production. The number of games or average minutes played in a players’ prior season is worth more than two seasons ago, which is weighted more than three seasons ago.
This should ensure we end up with more accurate player salaries for 2024 based on how many games they are likely to play, rather than how many they I thought they should play. Which makes sense, if a club is paying a player $800,000 for 24 games and you only get 14, then that club isn’t getting what they paid for. Again these should be more accurate, not perfect. I’m again not going to let perfect be the enemy of good or useful.
I’ve also tweaked the age progression factor. Looking back, I was too low on projecting player growth early on (20-23), and way too lenient on declines as they pass their peak, especially in positions requiring lateral quickness where the drop off becomes very noticeable as they near or pass 30.
And lastly, I’ve updated the replacement level player values, which were probably too harsh last season. It’s closer to the 80% percentile of the historic league average (by position), rather than approximately 75% that I used last year.
In the end I think it’s useful enough to start conversations about player value and what proportion of the salary cap are they worth.
With that out of the way, let’s get to the numbers. Here’s the top 25 players by projected 2024 value based on the above methodology.
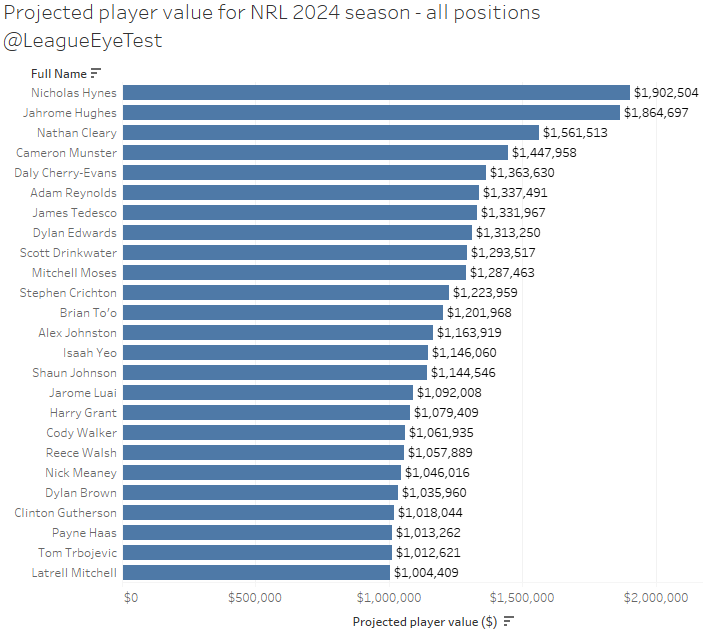
With the adjustments made Nicho Hynes takes top spot, with an estimated value of $1.904m million for 2024 or about 15.7% of the 2024 salary cap of $11.25million. That’s slightly ahead of Melbourne’s Jahrome Hughes at $1.865m, or 15.4% of the 2024 salary cap. Nathan Cleary drops back from first place last year to third at $1.561m, or just under 13% of the cap. His slip to third position is mostly due to the games played adjustment I noted above.
Cleary has played in 59 games in the past two seasons, with Hynes (70) and Hughes (67) appearing more regularly. Because of that gap, Cleary had some regression to the mean numbers applied to his missing games, and is projected to play a handful games fewer than the other two based on his last three seasons. Another minor factor is that his 2023 ETPCR numbers weren’t as dominant as prior seasons. But as we saw in the grand final, there are some things that can’t be measured by numbers and Cleary possesses a lot of those traits. If he plays the same number of games as Hynes or Hughes, he’d be number one this year.
Cameron Munster remains top five eighth and takes fourth spot at $1.447m (12% of cap), with Manly’s Daly Cherry-Evans in the fourth halfback in the top five, valued at $1.363m (11% of cap). The Broncos extending Adam Reynolds was also a no-brainer. As long as he continues to produce at this level they should hang on to him.
The biggest change from last season is that Tom Trbojevic tumbles down to 24th spot at just $1.012m. The Manly #1 has played in just 36 games in the past three seasons due to several injuries. By changing to a player specific projected number of games played instead of a static assumption for appearances, it hurts Trbojevic more than anyone. Still, for a player to be worth more than all but 24 others despite playing in less than half of the available contests is a huge testament to just how game changing he was when he was playing.
Other notables in the list are Stephen Crichton the highest valued centre at $1.23m (10% of cap), Brian To’o the highest valued winger at $1.20m (10% of cap) and Isaah Yeo the highest valued lock at $1.146m (9.5% of cap). Payne Haas is the top valued prop at $1.013m (8% of cap), with Harry Grant number one for hookers at $1.079m (9% of cap).
And as noted above, Reece Walsh is now projected as the 19th most valuable player in the NRL at $1.058m, a far cry from the minimum value he was projected at for 2023.
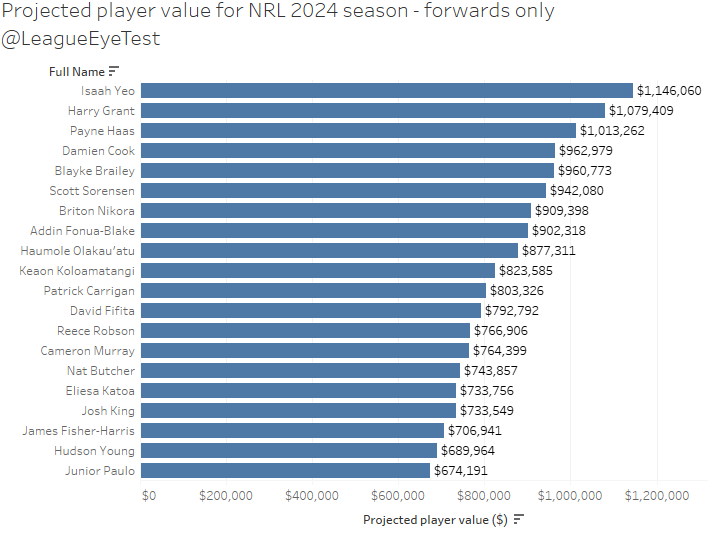
It might look like this is dominated by backs, but there’s a glut of forwards just outside this list. Damian Cook (28th), Blayke Brailey (29th), Scott Sorensen (30th), Briton Nikora (34th) and Addin Fonua-Blake (35th) fall inside the next group of 10 players. 36th is another forward too with Sea Eagles edge forward Haumole Olakau’atu valued at just over $877k (8.7% of cap).
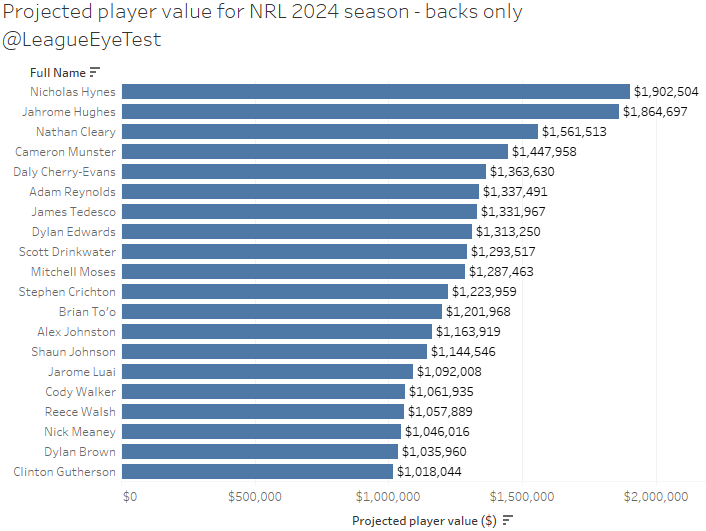
If I break down these into top 20 back and forwards it paints a clearer picture, as you know I’m generally not one to compare players across positions. I’ll leave out any more commentary here but overall, I think it’s a generally good representation of what happens on field.
Here’s the top 20 backs, all of whom appeared above.
And here’s the top 20 forwards, most of whom didn’t appear above.
A few notes on players outside these top 20s that have been in the news. There’s been stories about Terrell May being offered to clubs at $500k a season, I’ve got him projected at $299k for 2024. Half a million is probably paying overs and you’re banking on him developing significantly through the duration of his next deal. Similarly with the Warriors reported $650k per season deal for Braden Hamlin-Uele, who I have projected at a value of $416k. Panic buying is a real.
Luciano Leilua has recently moved to the Dragons from North Queensland, on a deal reported anywhere from $1.8million to $2.7million. My model has him valued at $550k, which means the lower spectrum of that deal isn’t too bad. The higher end though is significantly more than his on field value has showed recently. But if you’re the Dragons you’re probably going to need to overpay to upgrade certain positions.
I mentioned this last year and it bears repeating again, but under no circumstances do I consider this the final word on a player’s value, as there is far too much going on in an NRL game that isn’t captured, or if it is it isn’t captured well. In the end I’m just estimating a player’s value on their production to be $X, or X% of the salary cap. It’s just creating a starting point and allows comparisons with other players to compare meaningful production on field. But not everything that happens on field, video will always be vitally important for adding much needed context.
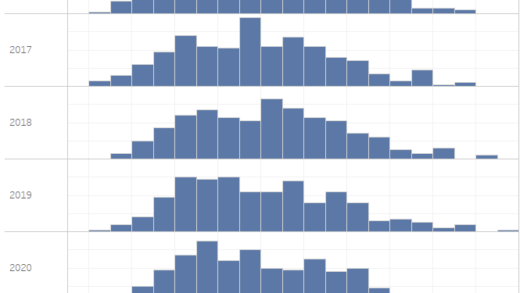
The spread of value across the league is pretty similar to last year. Here’s the breakdown of player value by $200k bins, showing the percentage of total players in each bucket.
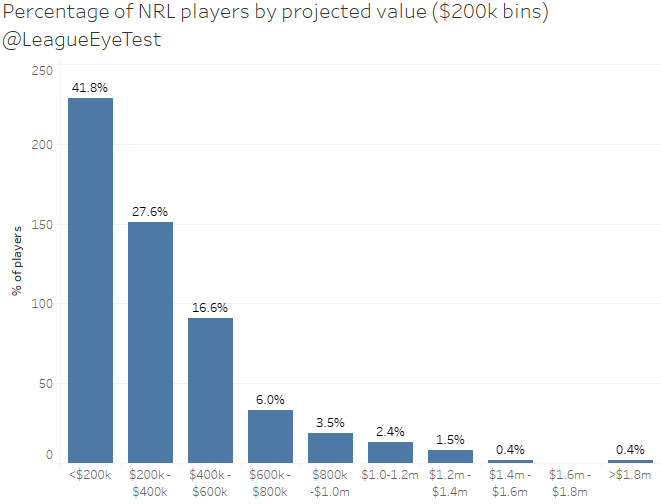
The sub $200k bucket has increased slightly this year to nearly 41% (up from 38% last year), largely due to the changes mentioned above. Last year there were 18 players projected above $1million, this year it’s 25, although some of that is due to a slightly higher cap level. Players in positions 22-25 were only over the $1million mark by a collective total of $48,000, and if the cap had stayed the same would probably have been projected under that mark. Combine that with almost 70% of players valued at $400k or under, it appears like the middle class is shrinking.
Next up we’ll break down each position into a box and whiskers plot, which shows the distribution of players value, with breakdowns into quartiles as well as any significant outliers.
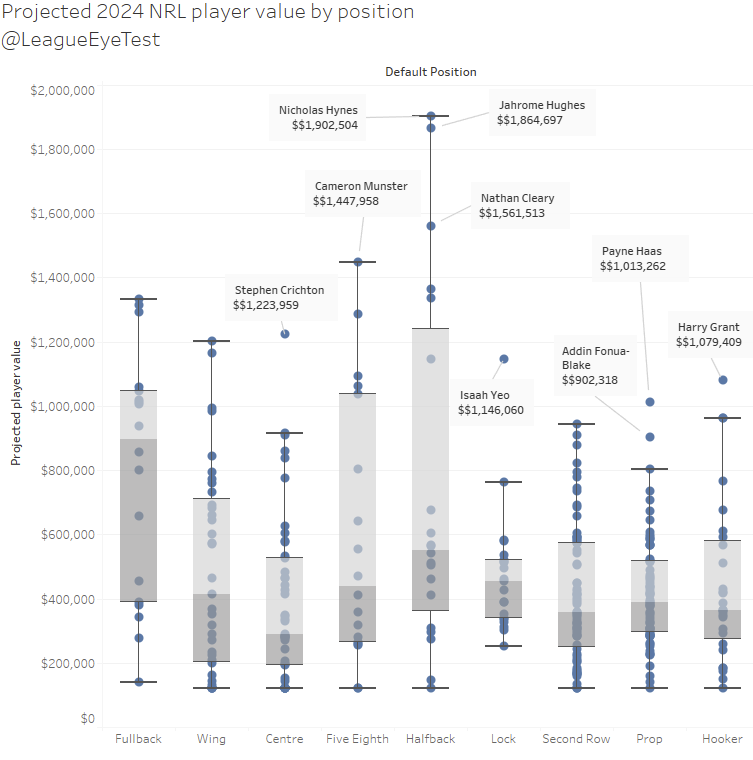
Here we can see that centre, lock, prop and hooker have players who are outliers from the upper hinge of this plot. Those correspond to Crichton, Yeo, Haas, Fonua-Blake and Grant. Additionally, Munster, Hynes and Hughes are close to being outliers, and have quite a gap to the rest of that position. We’ve always known that strong halfbacks are important for a premiership winning team, and this chart shows why.
The positions with the smallest variance between position are lock (low volume of players), centre and prop. There’s a few elite centres like Crichton, but largely the production levels are similar once you get past the best at the at position. Outside of Yeo and Cameron Murray, the value of production for locks doesn’t vary much either.
Which brings us to the Eye Tests favourite position, prop forward. We have the two obvious outliers in Haas and Fonua-Blake, and once you get past that things start to get very congested. There’s plenty of value in this position in the upper quartiles, and even the third quartile has high value compared to other positions.
In an interesting coincidence, Dan Walsh of <THIS MASTHEAD> had a story last week about how well prop forwards are getting paid. One of the insights from that article is that one NRL club had 30% of it’s salary cap tied up in middle forwards, who made up 27% of their top 30 players.
The story by Walsh also had comments about how front rowers usually peak later than other positions and tend to drop off later, with which also referenced one of the more popular posts on this site noting where players peak statistically by position.
It also had 2022 bench marking for NRL salaries across positions. The top 5 props in the NRL for 2022 averaged a salary of $845,860, with locks not much further behind at $841,316. Walsh’s piece also noted the average salary of props ranked 16-20 was higher than any other position in 2022, indicating that there’s value in the position outside of the elite players.
Last year I noted on the site that there wasn’t as much positional scarcity for prop forwards and overpaying for them wasn’t a sensible strategy as there was plenty of value within the position under that rung of elite players.
As noted for the box and whiskers chart above for 2024 it’s still true, with Haas and Fonua-Blake as outliers who are clearly worth every cent. Props may have the lowest upper quartile, but the bottom their third quartile is higher than any other position. Simply put, the depth is there but the highs aren’t as high.
My takeaways from this would be twofold. The first is that my quantifiable production isn’t capturing some areas that clubs are valuing something other than production with middles when deciding how much they’re worth. Quite possibly they’re paying a premium for other clubs to develop them because, as noted above, it’s a position that takes longer to mature. Or they’re speculating on significant improvements, like the deal for May mentioned above. There’s a reason they’re overpaying for production that doesn’t directly correlate with positive measurable on field performance, but as I’m not a scout, agent or list manager I’m not entirely sure what it is.
For example, I don’t include tackles completed in my ETPCR metric because making more of them negatively correlates with winning. If a player is making a lot of tackles, it’s usually because their team doesn’t have the ball, or an opponent is targeting a player defensively. Neither of those feels like a positive thing, but it’s something that middle forwards to a lot. Again I’m not discounting the effort required to make those tackles, but as a statistical contribution to winning rugby league games they’re not relevant.
This site’s ETPCR metric also highly values tries, try assists and line breaks, since they correlate highly with winning games, and those statistics aren’t the domain of middle forwards. There’s likely a gap here relating to intangibles or currently untraceable defensive ability.
The second would be that (some) clubs aren’t doing a great job evaluating middle forwards properly and are paying somewhat on name value alone or again speculating and hoping to hit the jackpot when a player develops late. The box and whiskers chart above shows that there’s plenty of similar production available from middle forwards once you drop past the top two, and the distribution of production within the position is not that vast. There’s enough value there that finding a replacement starting prop is probably easier than any other position, if you know what you’re looking for. Unless you’re replacing an elite one, which like most other positions in rugby league is near impossible.
That’s not to say the elite middles aren’t worth it, they clearly are. Haas and Fonua-Blake were in a class of their own in 2023. But overpaying for the range below elite is where things get out of hand and how you end up like the Dragons or Bulldogs.
The projected value of a Junior Paulo compared to a Tofofoa Sipley or Moses Leota is less than $100k, or about 1% of the salary cap. Most of that comes down to minutes played – Paulo plays about 15 minutes per game on average more than Sipley or Leota, so you’re paying per minute for similar production. I’ve projected a dozen props with value between $500-600k. Once you get down to that group the on field value is very similar, and the largest variation is how long they’re on the field.
The gap between the two elite props and the second tier isn’t anywhere near as wide as it is for a position like halfbacks, where the top five players in the competition are producing significantly more than the remainder of the league.
This method is still not something that 100% satisfied with, and probably never will be. But I feel that there’s still merit in using this form of valuation. It’s not perfect, and we’ll never capture everything in a single catch all metric the way baseball does or the NBA tries to do. Rugby League is more akin to football where there are so many moving parts that you’ll never solve the game with a single number. But we can use this to get a quick gauge on player value, especially if you’re trying to compare two or more players.
The player values used in this post can give you a good reference point to determine which player is better at quantifiable production that contributes to winning rugby league games. From there you layer on the context needed. It’s not definitive nor holistic, but a good starting point. Player X might produce more quantifiable value, but are they a leader on the field? Do they communicate well defensively? Do they fit with your teams’ “no dickheads” policy? You can’t completely Moneyball rugby league, but you can take some aspects of it to make your recruitment more efficient.
I’ll continue to evolve this method, and I’ll circle back at the end of the season to see how it fared. Hopefully better than 2023. As usual, if you have any thoughts, comments or even complaints please share them by email or through one of the sites social media accounts (Twitter/X, Threads, BlueSky, Instagram).